| Param | Original file | Final file |
|---|---|---|
| Filename | modeM0/AS1A07_145T01_9000005370_38267cztM0_level2.fits | modeM0/AS1A07_145T01_9000005370_38267cztM0_level2_quad_clean.evt |
| Size (bytes) | 781,346,880 | 178,574,400 |
| Size | 745.2 MB | 170.3 MB |
| Events in quadrant A | 5,478,503 | 1,212,206 |
| Events in quadrant B | 5,174,923 | 1,230,369 |
| Events in quadrant C | 6,066,589 | 1,164,590 |
| Events in quadrant D | 11,366,827 | 1,051,408 |
| Mode M9 | |||
|---|---|---|---|
| Quadrant | BADHDUFLAG | Total packets | Discarded packets |
| A | 0 | 28 | 0 |
| B | 0 | 28 | 0 |
| C | 0 | 28 | 0 |
| D | 0 | 28 | 0 |
| Mode SS | |||
|---|---|---|---|
| Quadrant | BADHDUFLAG | Total packets | Discarded packets |
| A | 0 | 220 | 0 |
| B | 0 | 220 | 0 |
| C | 0 | 220 | 0 |
| D | 0 | 220 | 0 |
| Mode M0 | |||
|---|---|---|---|
| Quadrant | BADHDUFLAG | Total packets | Discarded packets |
| A | 0 | 22761 | 3 |
| B | 0 | 22692 | 2 |
| C | 0 | 24622 | 2 |
| D | 0 | 41434 | 2 |
| Quadrant | Total seconds | Saturated seconds | Saturation percentage |
|---|---|---|---|
| A | 10807 | 20 | 0.185065% |
| B | 10807 | 120 | 1.110391% |
| C | 10807 | 123 | 1.138151% |
| D | 10807 | 546 | 5.052281% |
Noise dominated data is calculated using 1-second bins in cleaned event files. If a bin has >2000 counts, and if more than 50% of those come from <1% of pixels, then it is considered to be noise-dominated and hence unusable.
| Quadrant | # 1 sec bins | Bins with >0 counts | Bins with >2000 counts | High rate bins dominated by noise | Noise dominated (total time) | Noise dominated (detector-on time) | Marked lightcurve |
|---|---|---|---|---|---|---|---|
| A | 13582 | 10809 | 7 | 7 | 0.05% | 0.06% | 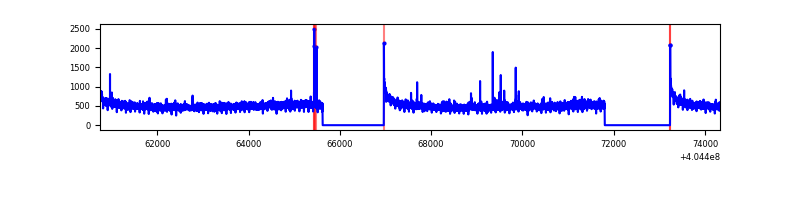 |
| B | 13582 | 10809 | 45 | 45 | 0.33% | 0.42% | 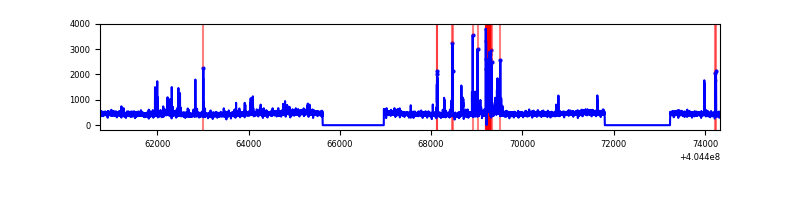 |
| C | 13582 | 10809 | 89 | 89 | 0.66% | 0.82% | 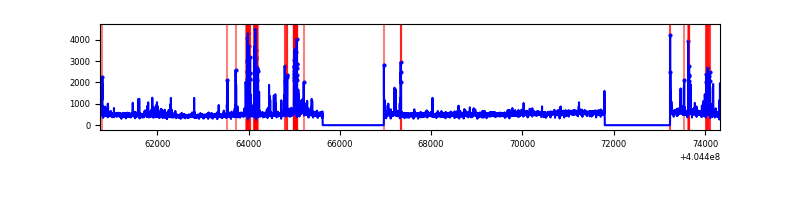 |
| D | 13582 | 10809 | 571 | 571 | 4.20% | 5.28% | 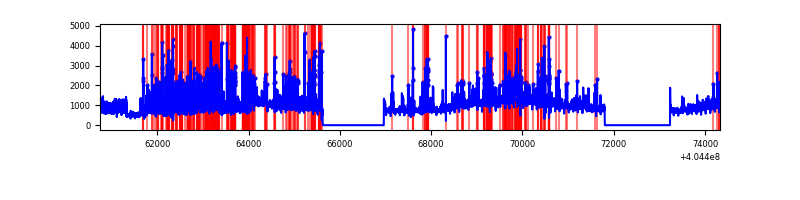 |
Top three noisy pixels from each quadrant. If the there are fewer than three noisy pixels in the level2.evt file, extra rows are filled as -1
| Pixel properties | Quadrant properties | ||||||
|---|---|---|---|---|---|---|---|
| Quadrant | DetID | PixID | Counts | Sigma | Mean | Median | Sigma |
| A | 10 | 83 | 689588 | 2859.54 | 1201 | 1175 | 240.7 |
| A | 12 | 189 | 73616 | 300.91 | 1201 | 1175 | 240.7 |
| A | 9 | 143 | 40707 | 164.21 | 1201 | 1175 | 240.7 |
| B | 5 | 172 | 353776 | 1531.5 | 1188 | 1156 | 230.2 |
| B | 15 | 85 | 59033 | 251.37 | 1188 | 1156 | 230.2 |
| B | 0 | 189 | 39689 | 167.36 | 1188 | 1156 | 230.2 |
| C | 14 | 254 | 494793 | 1825.52 | 1163 | 1170 | 270.4 |
| C | 15 | 214 | 451148 | 1664.11 | 1163 | 1170 | 270.4 |
| C | 10 | 70 | 331182 | 1220.45 | 1163 | 1170 | 270.4 |
| D | 10 | 203 | 4701203 | 16722.75 | 1150 | 1118 | 281.1 |
| D | 12 | 235 | 724054 | 2572.18 | 1150 | 1118 | 281.1 |
| D | 2 | 250 | 621998 | 2209.07 | 1150 | 1118 | 281.1 |
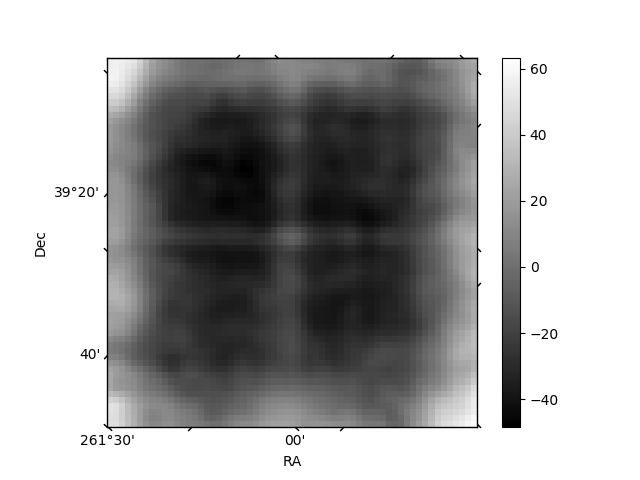
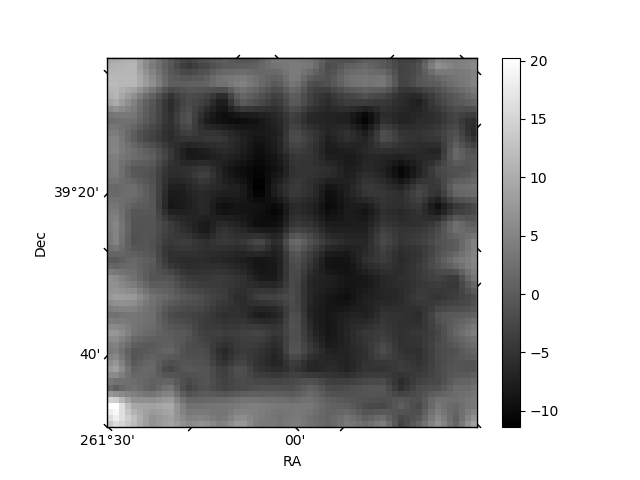
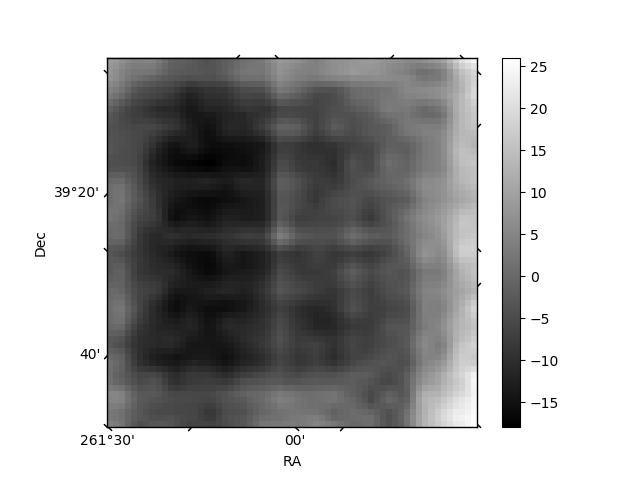
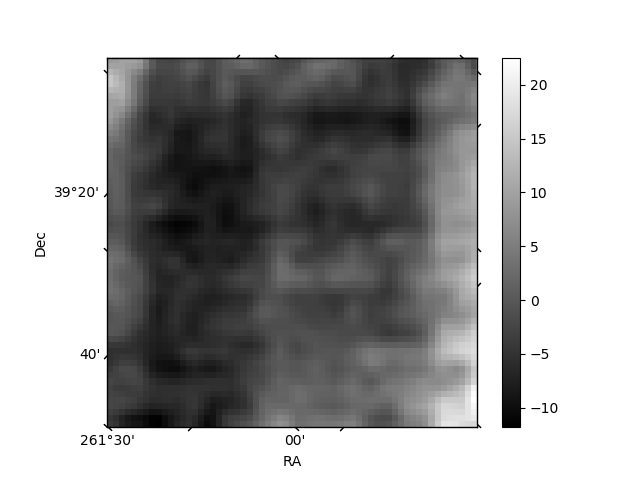
Histogram calculated using DETX and DETY for each event in the final _common_clean file
| Quadrant A | 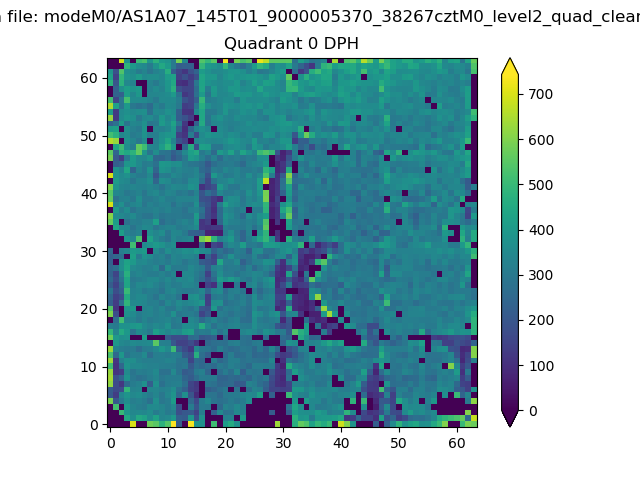 |
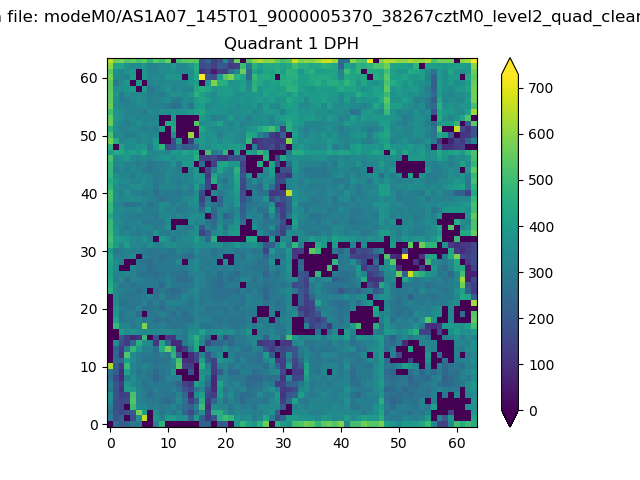 |
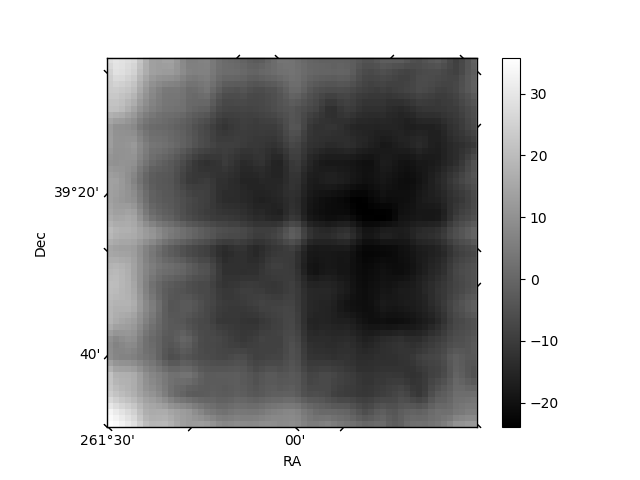
Quadrant B |
|---|---|---|---|
| Quadrant D | 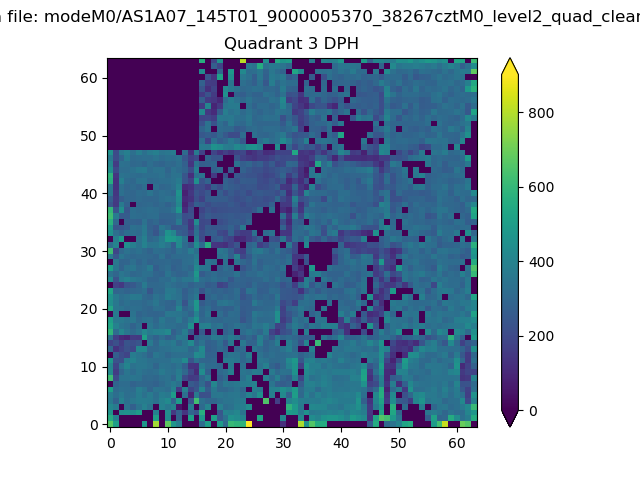 |
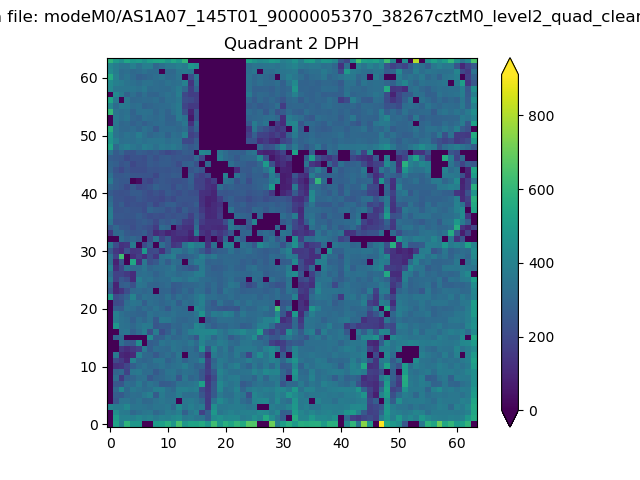 |
Quadrant C |
| Plot type | Count rate plots | Images |
|---|---|---|
| Comparison with Poisson distribution Blue bars denote a histogram of data divided into 1 sec bins. Red curve is a Poisson curve with rate = median count rate of data. |
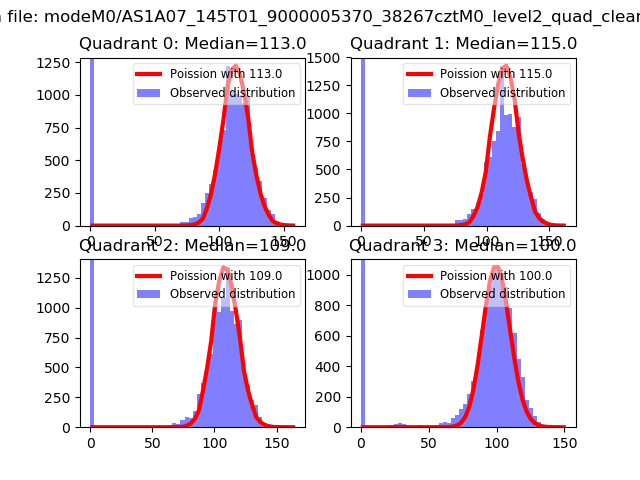 |
 |
| Quadrant-wise count rates Data is divided into 100 sec bins |
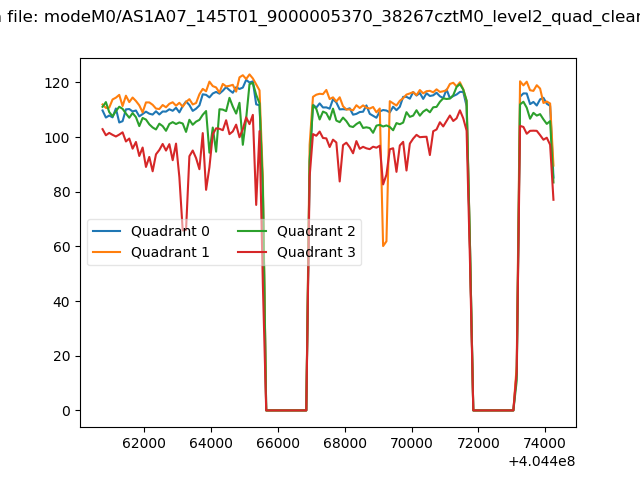 |
|
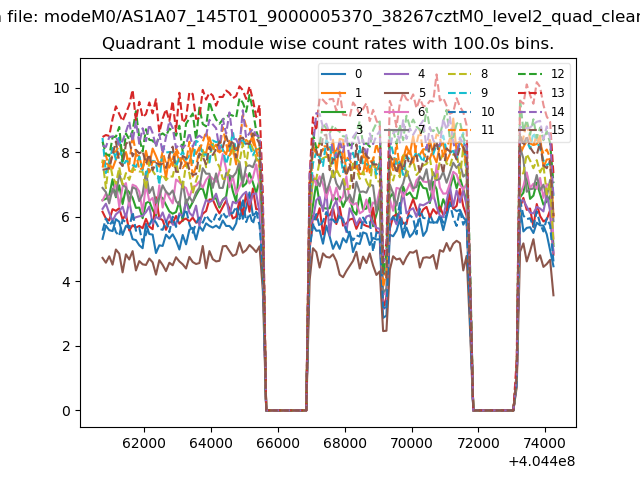
| Module-wise count rates for Quadrant A Data is divided into 100 sec bins |
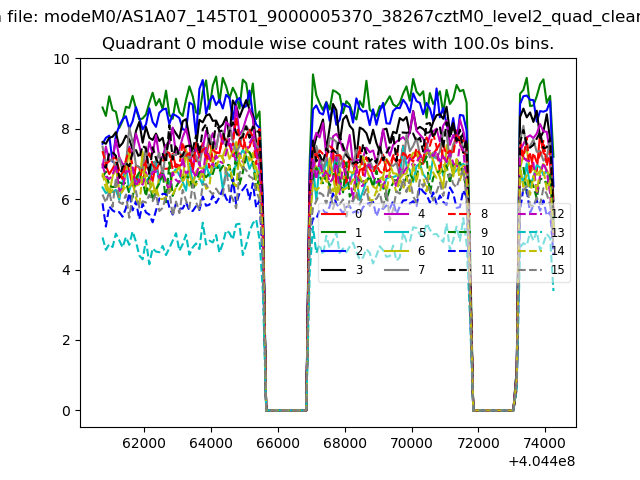 |
 |
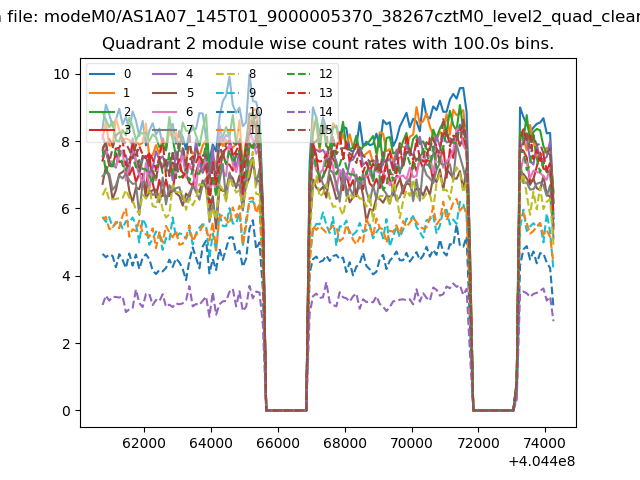
| Module-wise count rates for Quadrant B Data is divided into 100 sec bins |
 |
 |
| Module-wise count rates for Quadrant C Data is divided into 100 sec bins |
 |
 |
| Module-wise count rates for Quadrant D Data is divided into 100 sec bins |
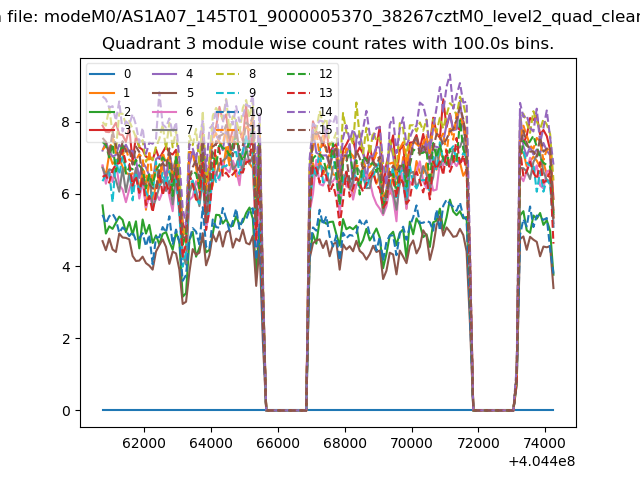 |
 |
| Parameter | Plot |
|---|---|
| CZT HV Monitor | 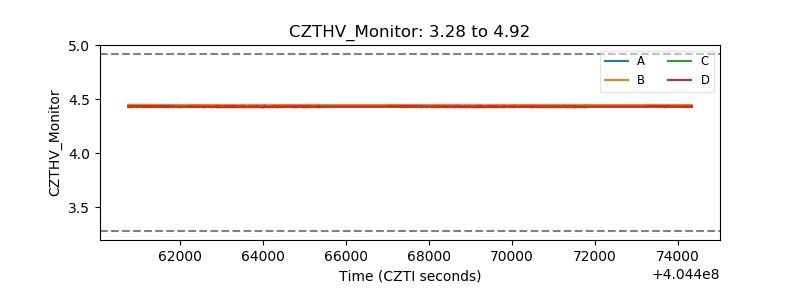 |
| D_VDD | 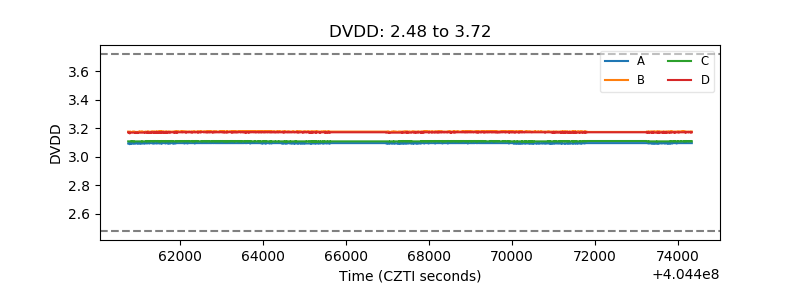 |
| Temperature 1 | 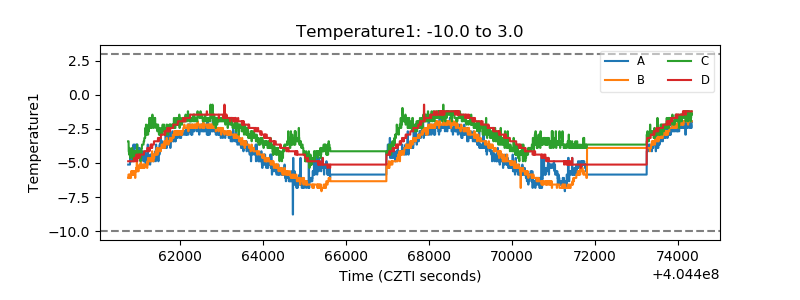 |
| Veto HV Monitor | 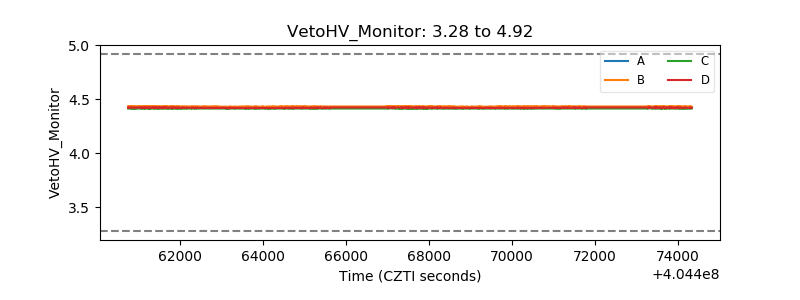 |
| Veto LLD | 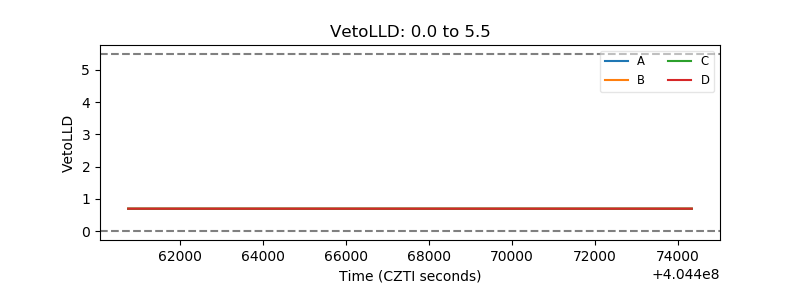 |
| Alpha Counter | 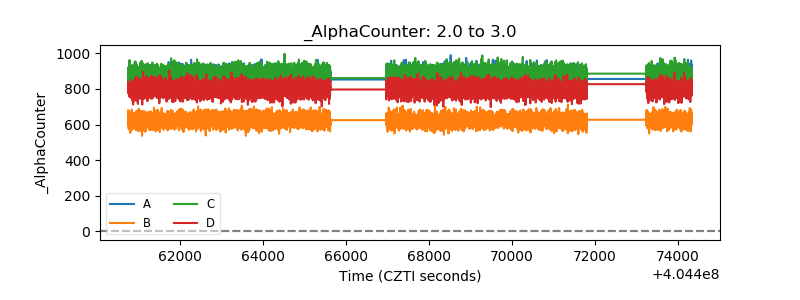 |
| _CPM_Rate | 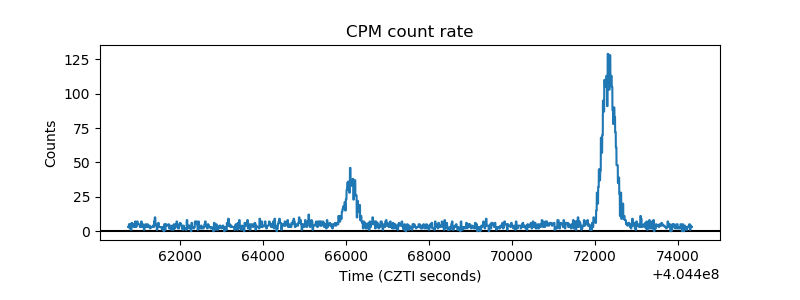 |
| CZT Counter | 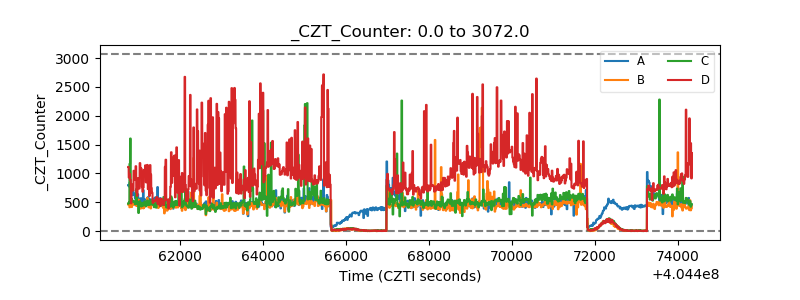 |
| +2.5 Volts monitor | 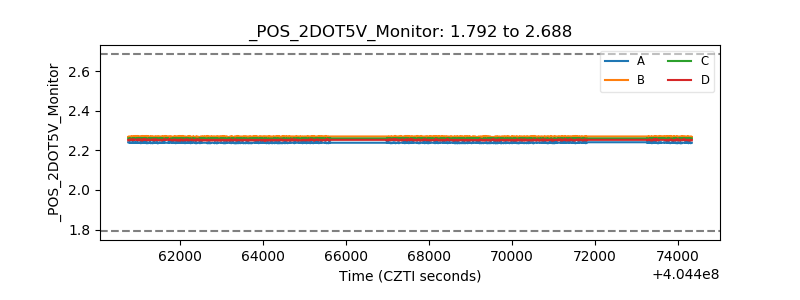 |
| +5 Volts monitor | 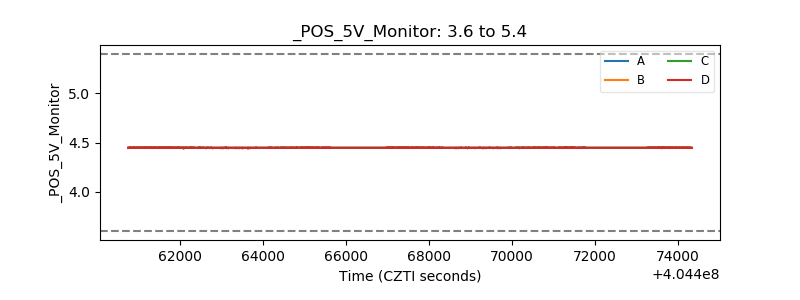 |
| _ROLL_ROT | 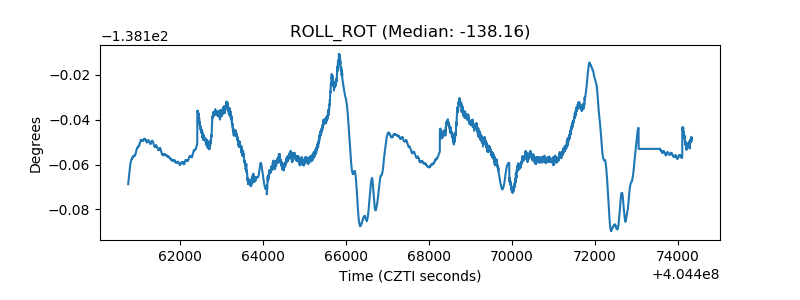 |
| _Roll_DEC | 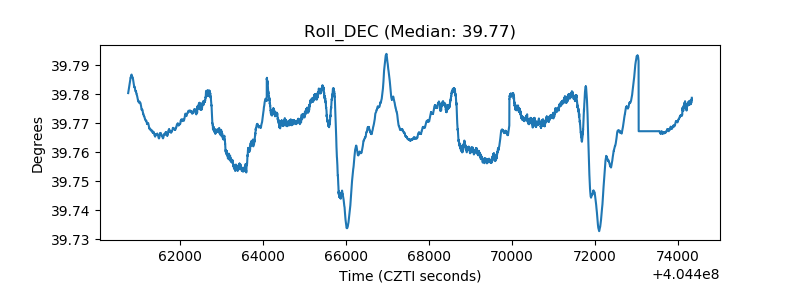 |
| _Roll_RA | 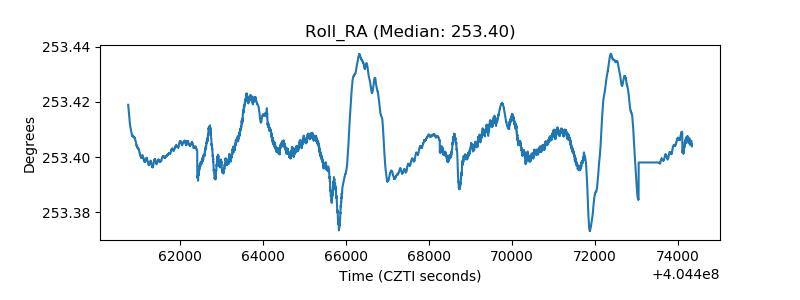 |
| Veto Counter | 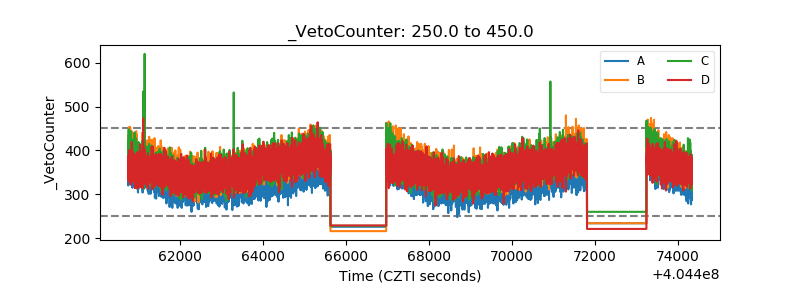 |