| Param | Original file | Final file |
|---|---|---|
| Filename | modeM0/AS1A07_145T01_9000005370_38269cztM0_level2.fits | modeM0/AS1A07_145T01_9000005370_38269cztM0_level2_quad_clean.evt |
| Size (bytes) | 393,408,000 | 92,672,640 |
| Size | 375.2 MB | 88.4 MB |
| Events in quadrant A | 2,813,432 | 632,253 |
| Events in quadrant B | 2,549,650 | 643,652 |
| Events in quadrant C | 2,671,799 | 607,120 |
| Events in quadrant D | 6,102,318 | 539,734 |
| Mode M9 | |||
|---|---|---|---|
| Quadrant | BADHDUFLAG | Total packets | Discarded packets |
| A | 0 | 17 | 0 |
| B | 0 | 17 | 0 |
| C | 0 | 17 | 0 |
| D | 0 | 18 | 0 |
| Mode SS | |||
|---|---|---|---|
| Quadrant | BADHDUFLAG | Total packets | Discarded packets |
| A | 0 | 112 | 0 |
| B | 0 | 112 | 0 |
| C | 0 | 112 | 0 |
| D | 0 | 112 | 0 |
| Mode M0 | |||
|---|---|---|---|
| Quadrant | BADHDUFLAG | Total packets | Discarded packets |
| A | 0 | 11738 | 3 |
| B | 0 | 11327 | 2 |
| C | 0 | 11322 | 2 |
| D | 0 | 22064 | 2 |
| Quadrant | Total seconds | Saturated seconds | Saturation percentage |
|---|---|---|---|
| A | 5475 | 13 | 0.237443% |
| B | 5475 | 37 | 0.675799% |
| C | 5475 | 20 | 0.365297% |
| D | 5475 | 335 | 6.118721% |
Noise dominated data is calculated using 1-second bins in cleaned event files. If a bin has >2000 counts, and if more than 50% of those come from <1% of pixels, then it is considered to be noise-dominated and hence unusable.
| Quadrant | # 1 sec bins | Bins with >0 counts | Bins with >2000 counts | High rate bins dominated by noise | Noise dominated (total time) | Noise dominated (detector-on time) | Marked lightcurve |
|---|---|---|---|---|---|---|---|
| A | 7148 | 5476 | 2 | 2 | 0.03% | 0.04% | 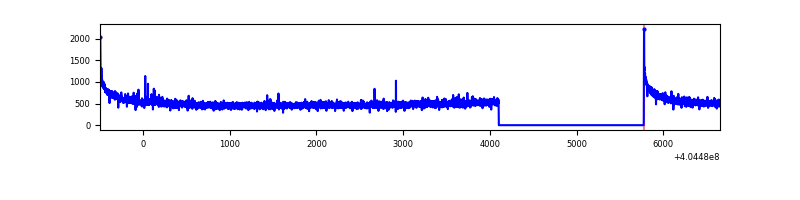 |
| B | 7148 | 5476 | 18 | 18 | 0.25% | 0.33% | 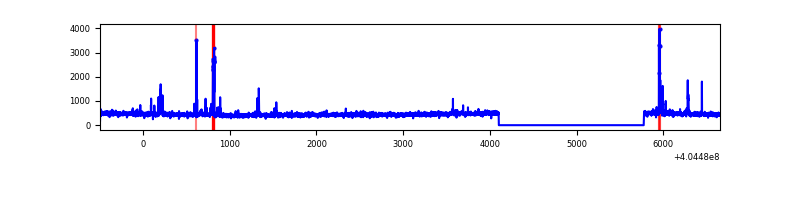 |
| C | 7148 | 5476 | 13 | 13 | 0.18% | 0.24% | 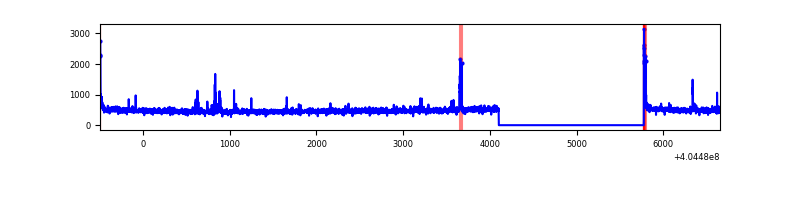 |
| D | 7148 | 5476 | 325 | 325 | 4.55% | 5.93% | 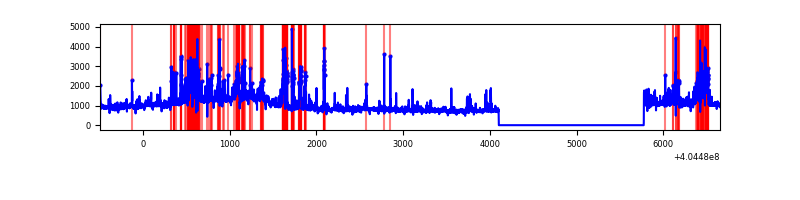 |
Top three noisy pixels from each quadrant. If the there are fewer than three noisy pixels in the level2.evt file, extra rows are filled as -1
| Pixel properties | Quadrant properties | ||||||
|---|---|---|---|---|---|---|---|
| Quadrant | DetID | PixID | Counts | Sigma | Mean | Median | Sigma |
| A | 10 | 83 | 404882 | 3280.58 | 609 | 597 | 123.2 |
| A | 12 | 189 | 31242 | 248.67 | 609 | 597 | 123.2 |
| A | 13 | 6 | 10601 | 81.18 | 609 | 597 | 123.2 |
| B | 15 | 85 | 79215 | 670.55 | 606 | 590 | 117.3 |
| B | 5 | 172 | 48146 | 405.58 | 606 | 590 | 117.3 |
| B | 12 | 111 | 14129 | 115.47 | 606 | 590 | 117.3 |
| C | 15 | 214 | 229437 | 1651.9 | 595 | 598 | 138.5 |
| C | 12 | 249 | 47383 | 337.72 | 595 | 598 | 138.5 |
| C | 0 | 10 | 45279 | 322.54 | 595 | 598 | 138.5 |
| D | 10 | 203 | 2689575 | 18842.23 | 583 | 567 | 142.7 |
| D | 13 | 249 | 384023 | 2686.93 | 583 | 567 | 142.7 |
| D | 1 | 52 | 193415 | 1351.31 | 583 | 567 | 142.7 |
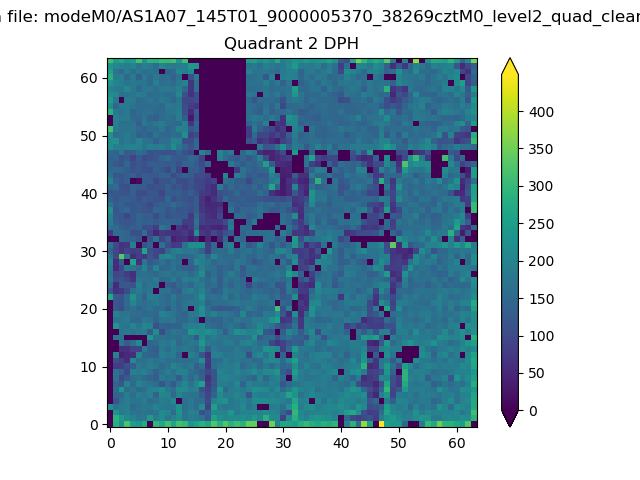
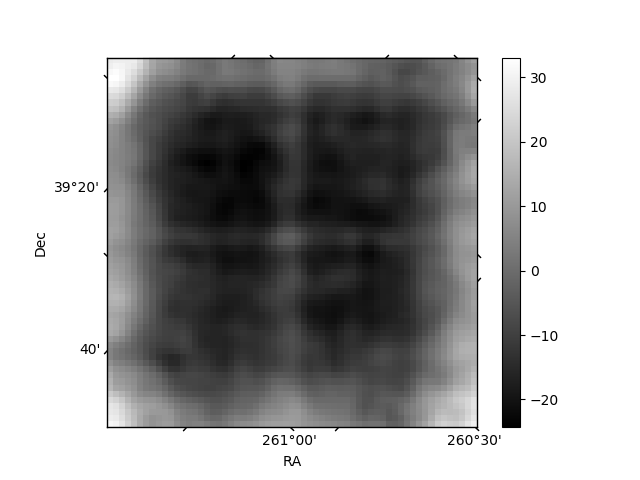
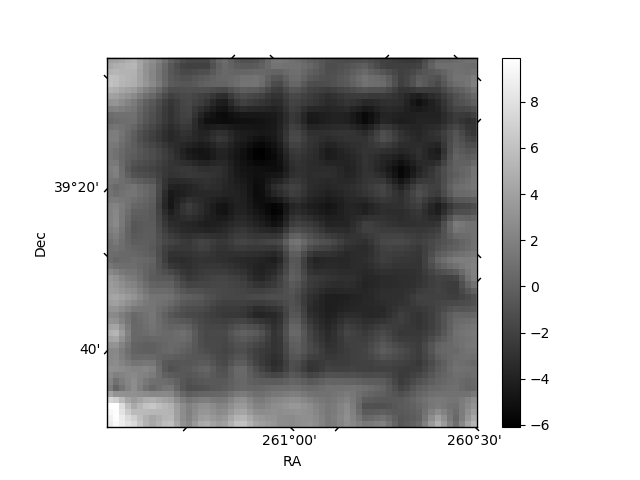
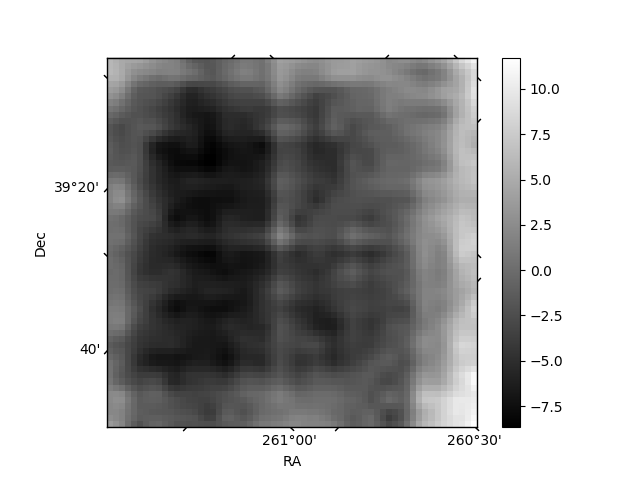
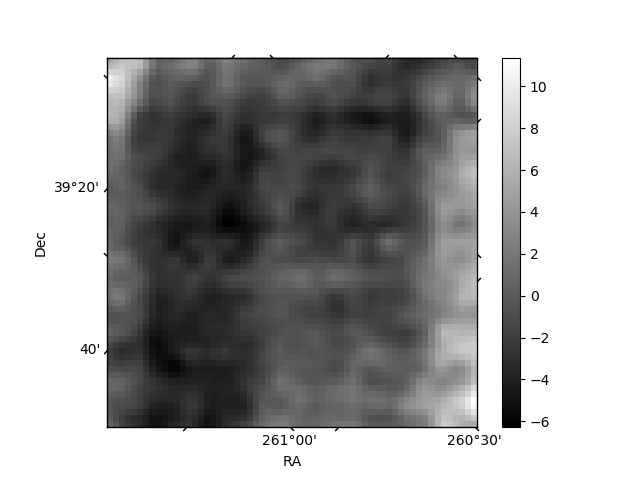
Histogram calculated using DETX and DETY for each event in the final _common_clean file
| Quadrant A | 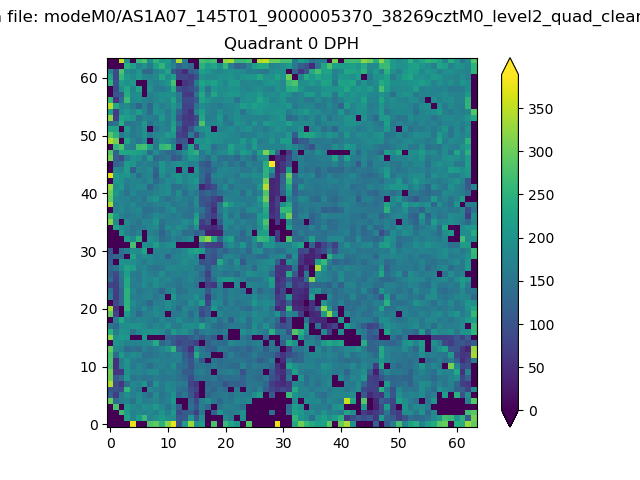 |
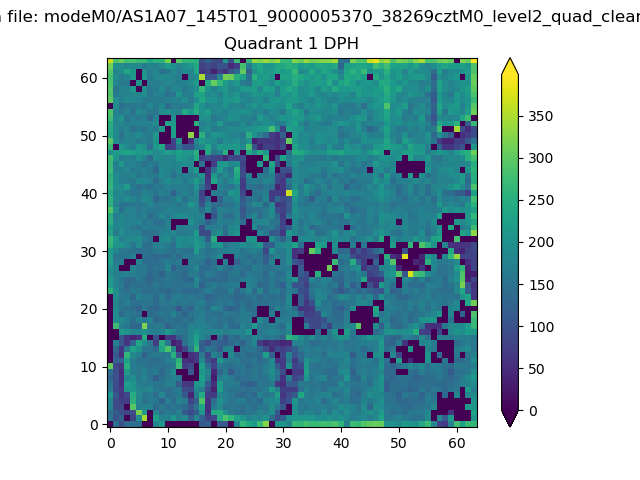 |
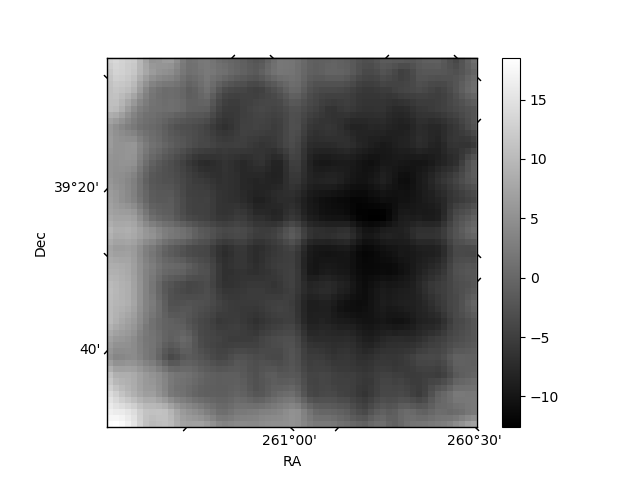
Quadrant B |
|---|---|---|---|
| Quadrant D | 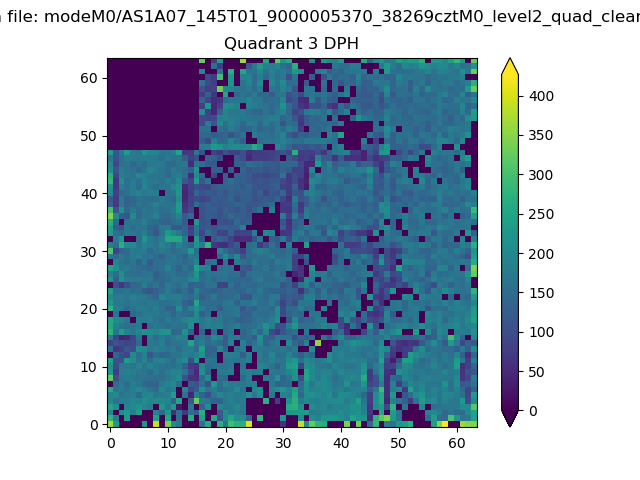 |
 |
Quadrant C |
| Plot type | Count rate plots | Images |
|---|---|---|
| Comparison with Poisson distribution Blue bars denote a histogram of data divided into 1 sec bins. Red curve is a Poisson curve with rate = median count rate of data. |
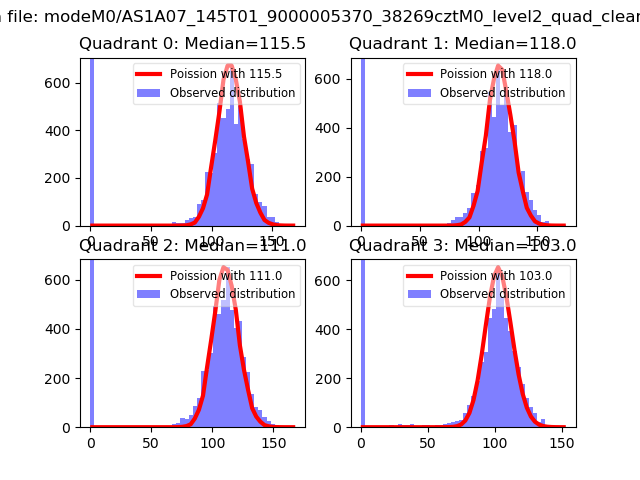 |
 |
| Quadrant-wise count rates Data is divided into 100 sec bins |
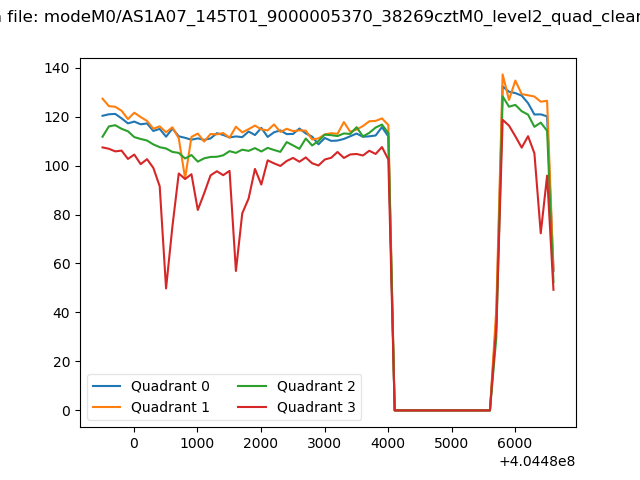 |
|
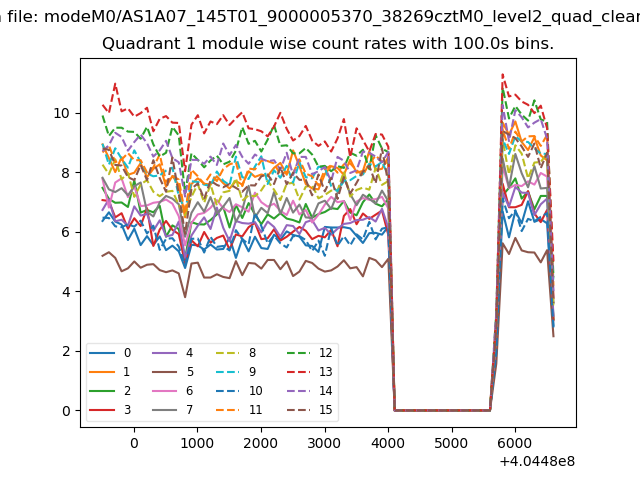
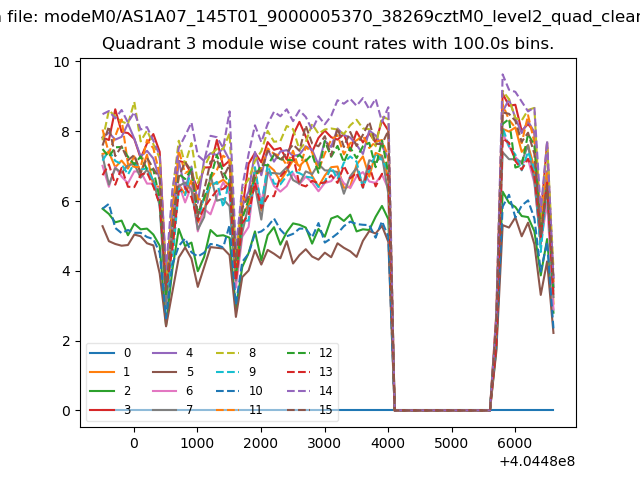
| Module-wise count rates for Quadrant A Data is divided into 100 sec bins |
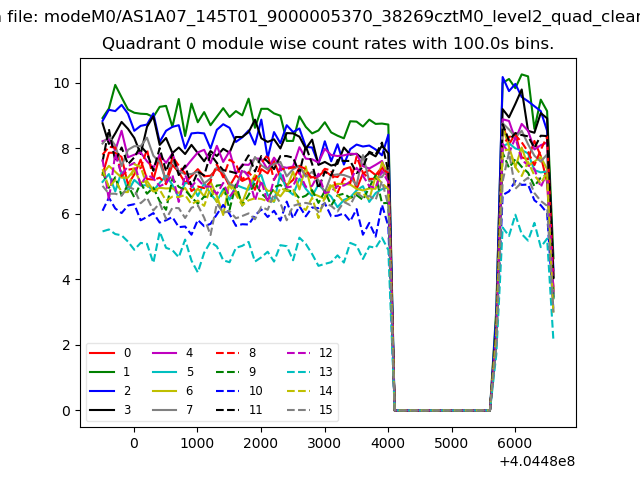 |
 |
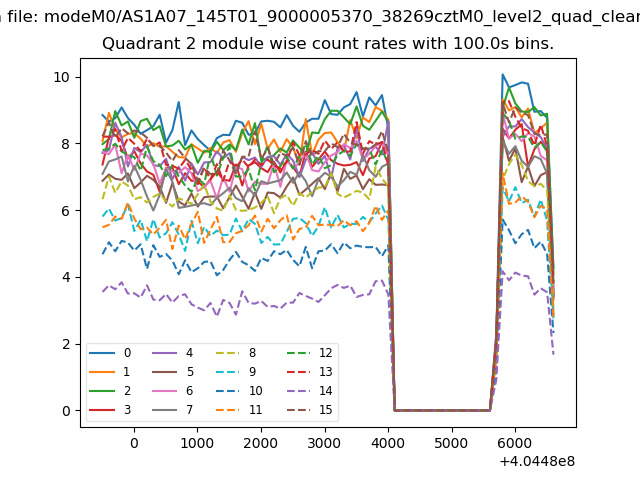
| Module-wise count rates for Quadrant B Data is divided into 100 sec bins |
 |
 |
| Module-wise count rates for Quadrant C Data is divided into 100 sec bins |
 |
 |
| Module-wise count rates for Quadrant D Data is divided into 100 sec bins |
 |
 |
| Parameter | Plot |
|---|---|
| CZT HV Monitor | 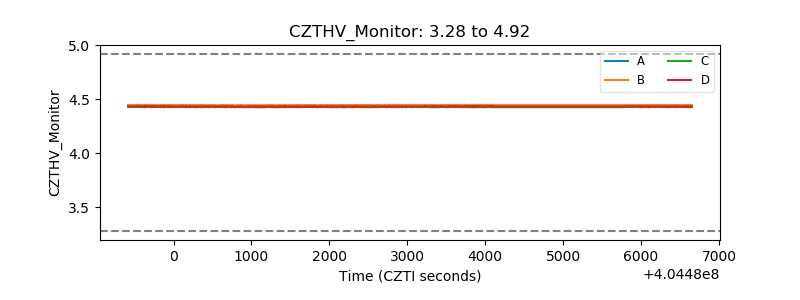 |
| D_VDD | 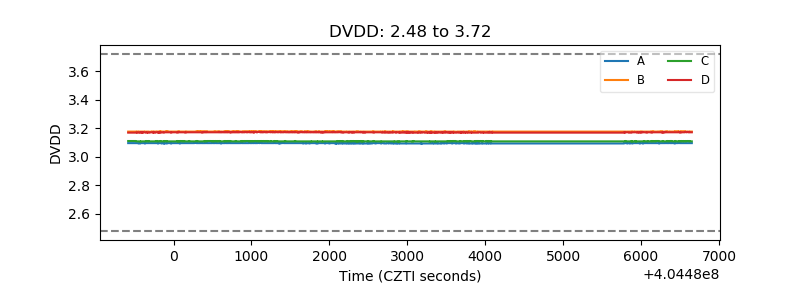 |
| Temperature 1 | 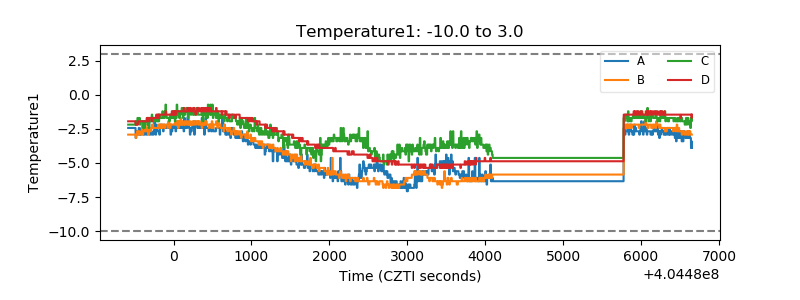 |
| Veto HV Monitor | 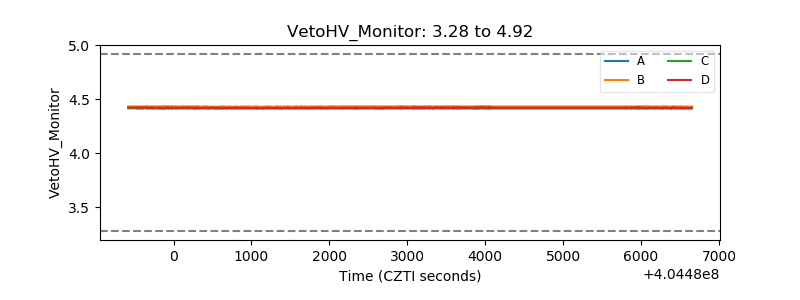 |
| Veto LLD | 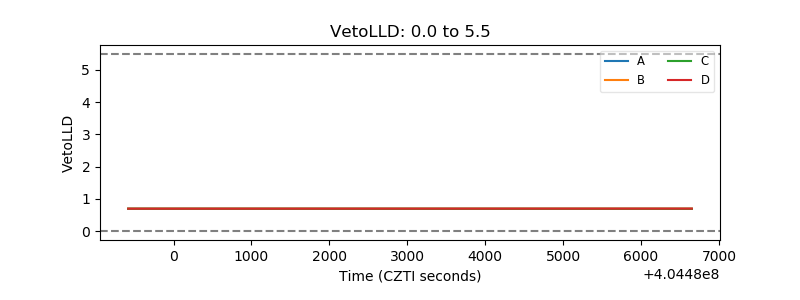 |
| Alpha Counter | 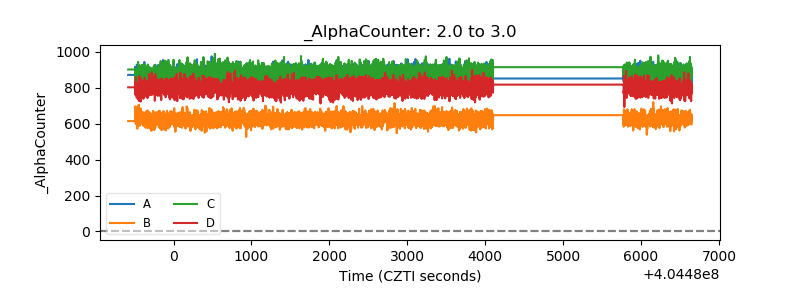 |
| _CPM_Rate | 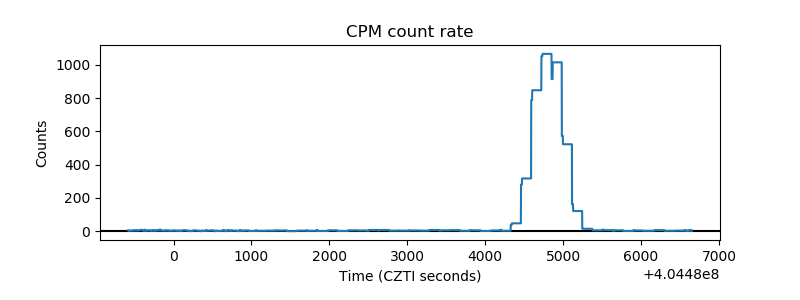 |
| CZT Counter | 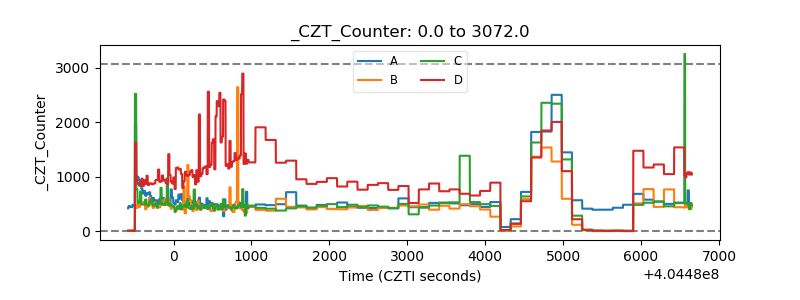 |
| +2.5 Volts monitor | 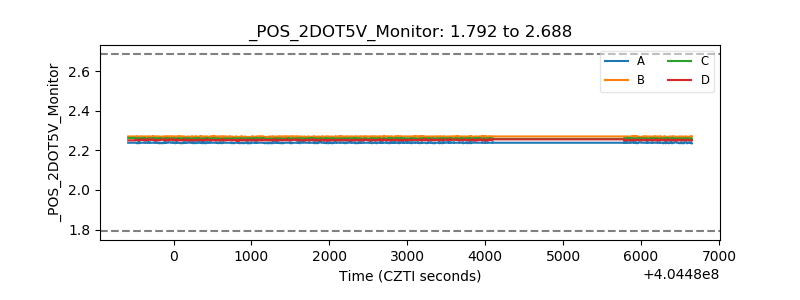 |
| +5 Volts monitor |  |
| _ROLL_ROT | 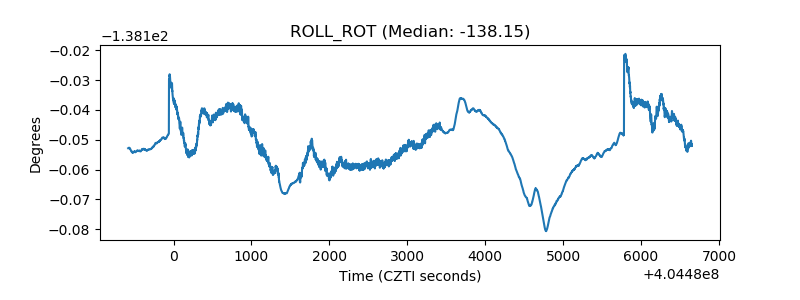 |
| _Roll_DEC | 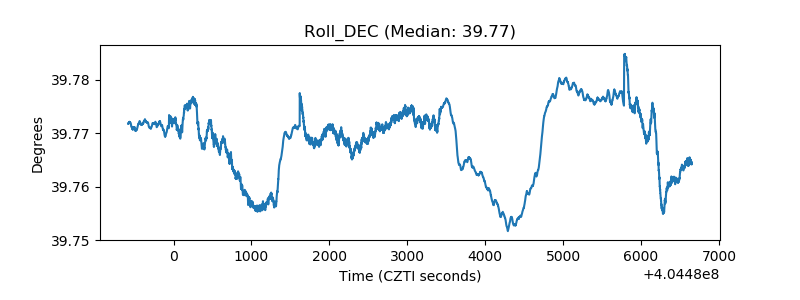 |
| _Roll_RA | 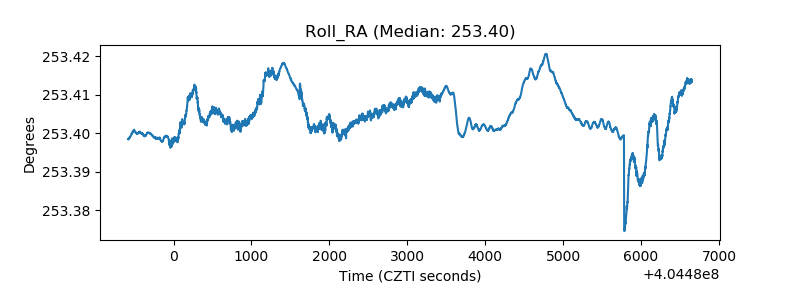 |
| Veto Counter | 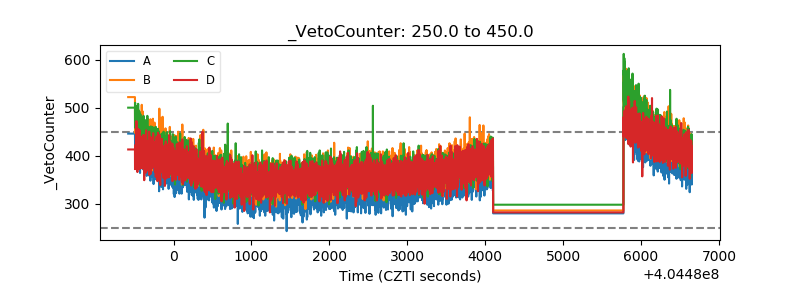 |