| Param | Original file | Final file |
|---|---|---|
| Filename | modeM0/AS1A07_145T01_9000005370_38271cztM0_level2.fits | modeM0/AS1A07_145T01_9000005370_38271cztM0_level2_quad_clean.evt |
| Size (bytes) | 402,151,680 | 95,483,520 |
| Size | 383.5 MB | 91.1 MB |
| Events in quadrant A | 2,838,302 | 650,153 |
| Events in quadrant B | 2,570,042 | 668,760 |
| Events in quadrant C | 2,770,447 | 631,230 |
| Events in quadrant D | 6,284,842 | 560,058 |
| Mode M9 | |||
|---|---|---|---|
| Quadrant | BADHDUFLAG | Total packets | Discarded packets |
| A | 0 | 21 | 0 |
| B | 0 | 21 | 0 |
| C | 0 | 21 | 0 |
| D | 0 | 22 | 0 |
| Mode SS | |||
|---|---|---|---|
| Quadrant | BADHDUFLAG | Total packets | Discarded packets |
| A | 0 | 112 | 0 |
| B | 0 | 112 | 0 |
| C | 0 | 112 | 0 |
| D | 0 | 112 | 0 |
| Mode M0 | |||
|---|---|---|---|
| Quadrant | BADHDUFLAG | Total packets | Discarded packets |
| A | 0 | 11811 | 3 |
| B | 0 | 11252 | 2 |
| C | 0 | 11475 | 2 |
| D | 0 | 22683 | 2 |
| Quadrant | Total seconds | Saturated seconds | Saturation percentage |
|---|---|---|---|
| A | 5441 | 17 | 0.312443% |
| B | 5441 | 21 | 0.385958% |
| C | 5441 | 44 | 0.808675% |
| D | 5441 | 340 | 6.248851% |
Noise dominated data is calculated using 1-second bins in cleaned event files. If a bin has >2000 counts, and if more than 50% of those come from <1% of pixels, then it is considered to be noise-dominated and hence unusable.
| Quadrant | # 1 sec bins | Bins with >0 counts | Bins with >2000 counts | High rate bins dominated by noise | Noise dominated (total time) | Noise dominated (detector-on time) | Marked lightcurve |
|---|---|---|---|---|---|---|---|
| A | 7263 | 5442 | 3 | 3 | 0.04% | 0.06% |  |
| B | 7263 | 5442 | 11 | 11 | 0.15% | 0.20% | 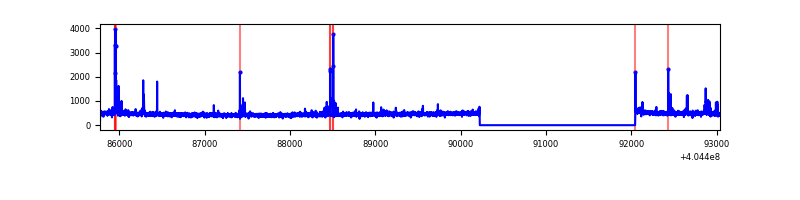 |
| C | 7263 | 5442 | 36 | 36 | 0.50% | 0.66% | 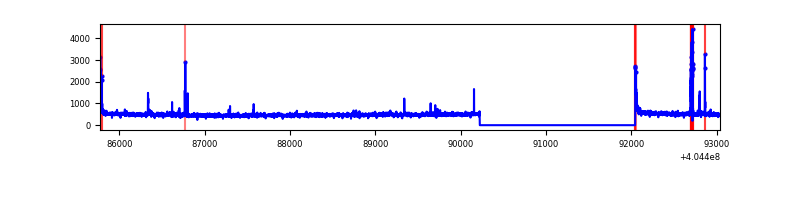 |
| D | 7263 | 5442 | 281 | 281 | 3.87% | 5.16% | 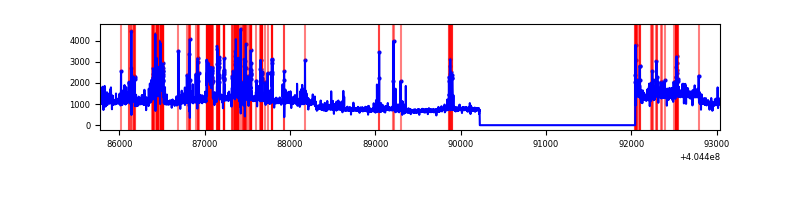 |
Top three noisy pixels from each quadrant. If the there are fewer than three noisy pixels in the level2.evt file, extra rows are filled as -1
| Pixel properties | Quadrant properties | ||||||
|---|---|---|---|---|---|---|---|
| Quadrant | DetID | PixID | Counts | Sigma | Mean | Median | Sigma |
| A | 10 | 83 | 401805 | 3220.83 | 617 | 606 | 124.6 |
| A | 13 | 6 | 20798 | 162.1 | 617 | 606 | 124.6 |
| A | 12 | 189 | 17236 | 133.51 | 617 | 606 | 124.6 |
| B | 5 | 172 | 100486 | 846.97 | 616 | 602 | 117.9 |
| B | 12 | 111 | 14094 | 114.41 | 616 | 602 | 117.9 |
| B | 11 | 111 | 13000 | 105.13 | 616 | 602 | 117.9 |
| C | 15 | 214 | 228545 | 1624.6 | 605 | 609 | 140.3 |
| C | 2 | 16 | 74974 | 530.03 | 605 | 609 | 140.3 |
| C | 0 | 10 | 59282 | 418.19 | 605 | 609 | 140.3 |
| D | 10 | 203 | 3002947 | 20871.51 | 594 | 577 | 143.9 |
| D | 13 | 249 | 248182 | 1721.27 | 594 | 577 | 143.9 |
| D | 2 | 250 | 215074 | 1491.11 | 594 | 577 | 143.9 |
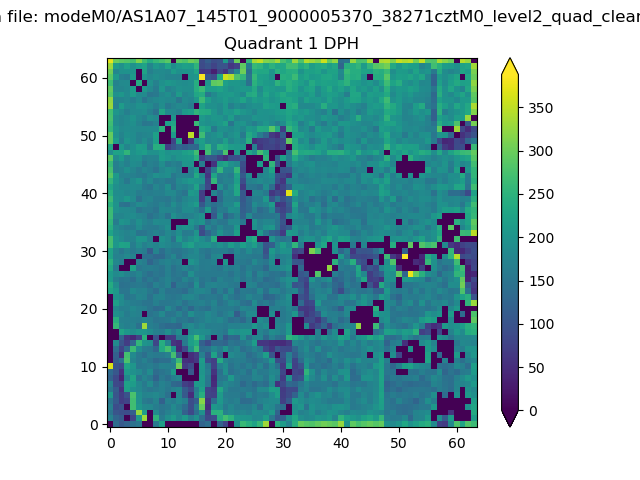
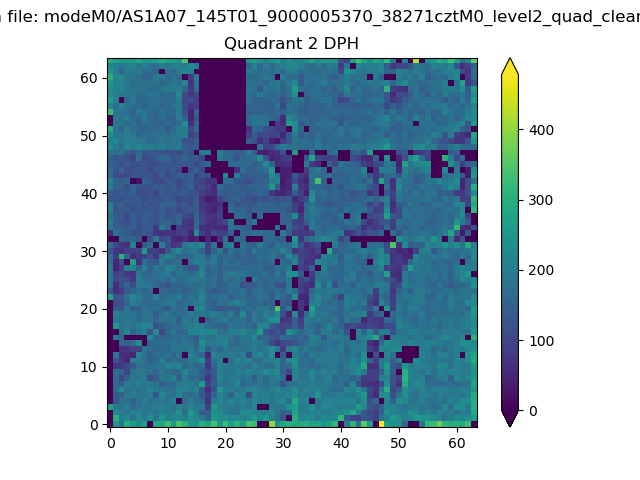
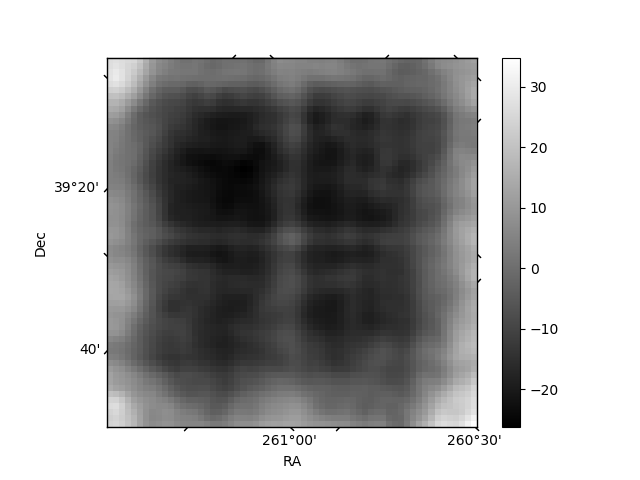
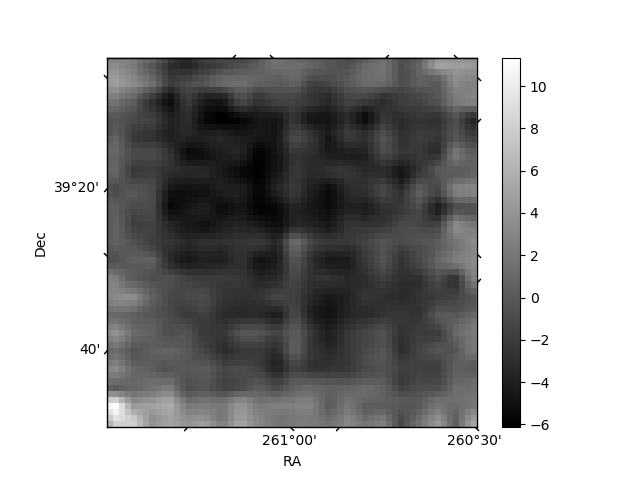
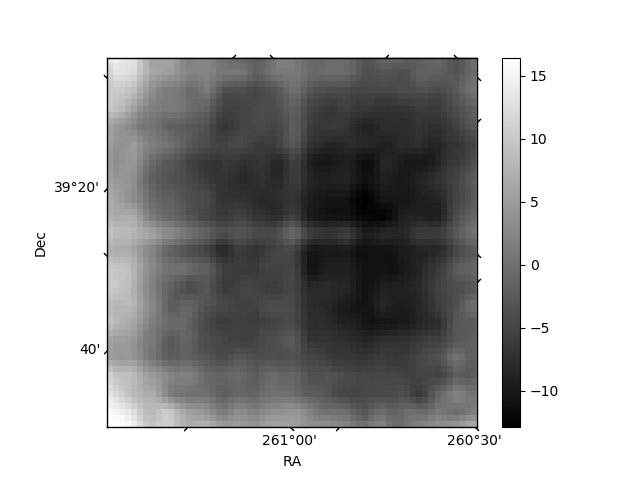
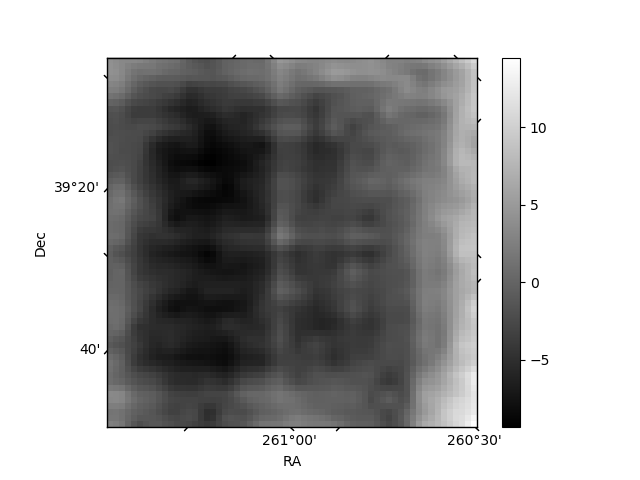
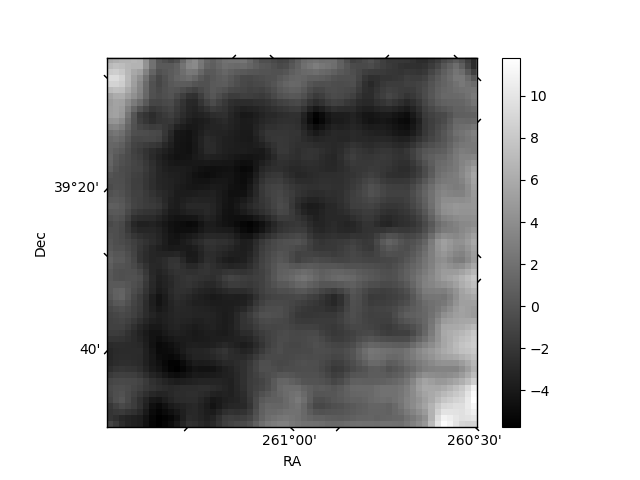
Histogram calculated using DETX and DETY for each event in the final _common_clean file
| Quadrant A | 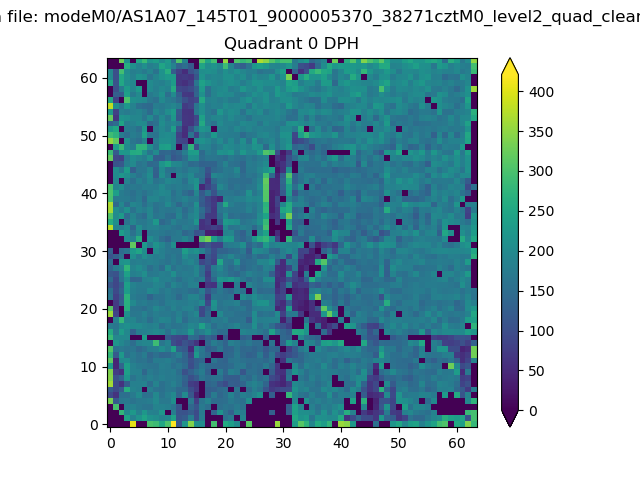 |
 |
Quadrant B |
|---|---|---|---|
| Quadrant D | 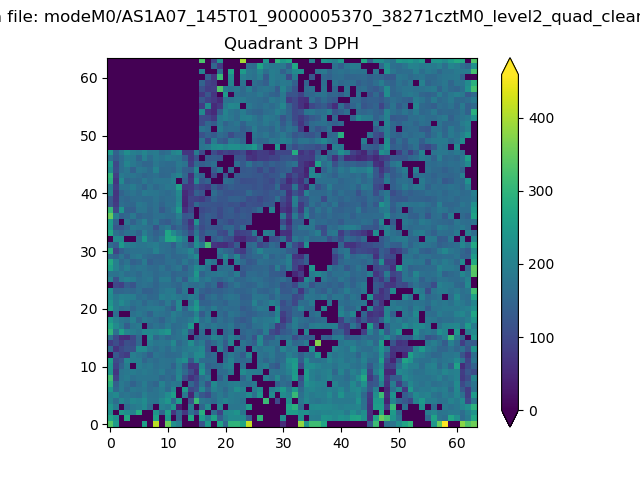 |
 |
Quadrant C |
| Plot type | Count rate plots | Images |
|---|---|---|
| Comparison with Poisson distribution Blue bars denote a histogram of data divided into 1 sec bins. Red curve is a Poisson curve with rate = median count rate of data. |
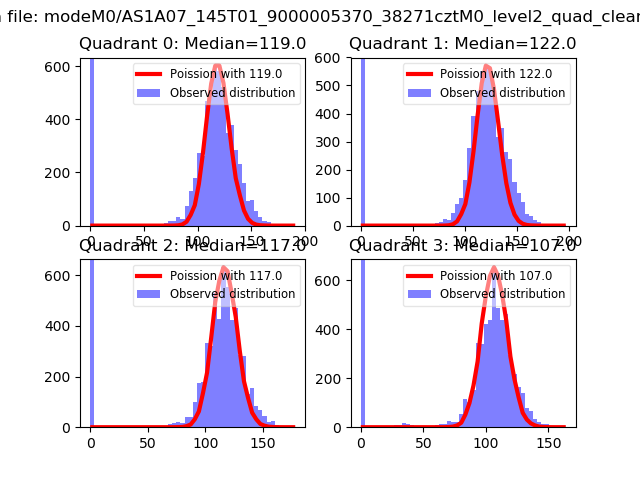 |
 |
| Quadrant-wise count rates Data is divided into 100 sec bins |
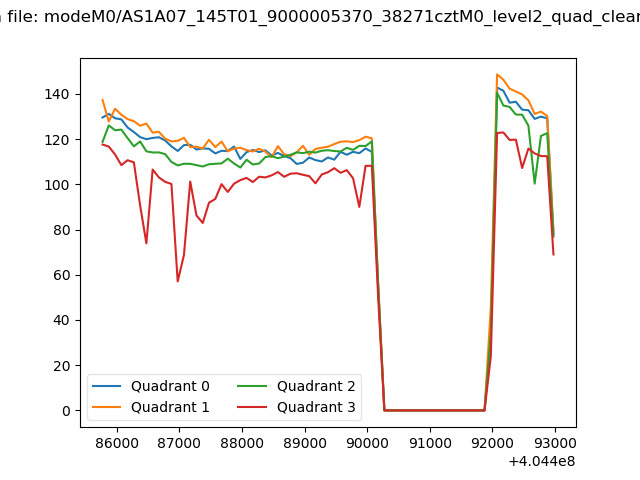 |
|
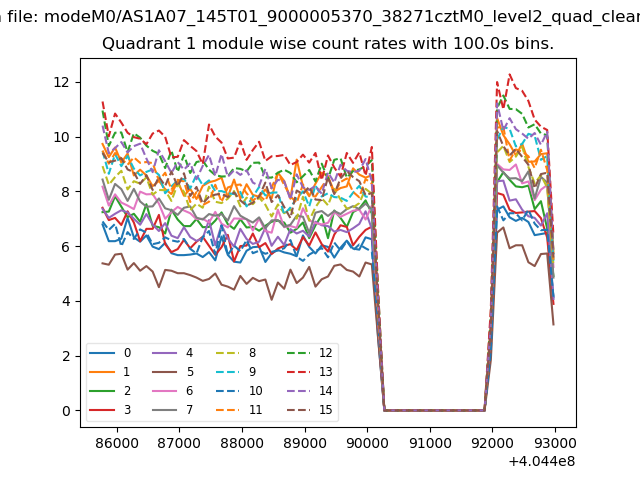
| Module-wise count rates for Quadrant A Data is divided into 100 sec bins |
 |
 |
| Module-wise count rates for Quadrant B Data is divided into 100 sec bins |
 |
 |
| Module-wise count rates for Quadrant C Data is divided into 100 sec bins |
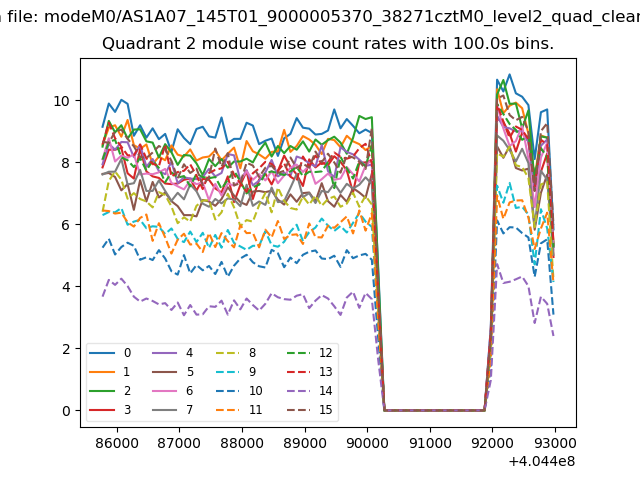 |
 |
| Module-wise count rates for Quadrant D Data is divided into 100 sec bins |
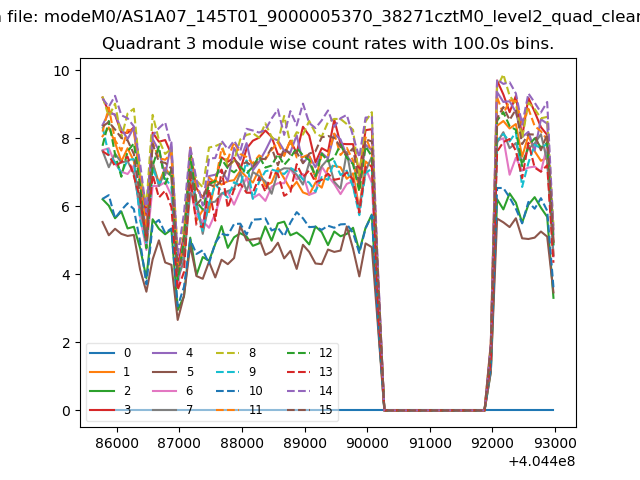 |
 |
| Parameter | Plot |
|---|---|
| CZT HV Monitor | 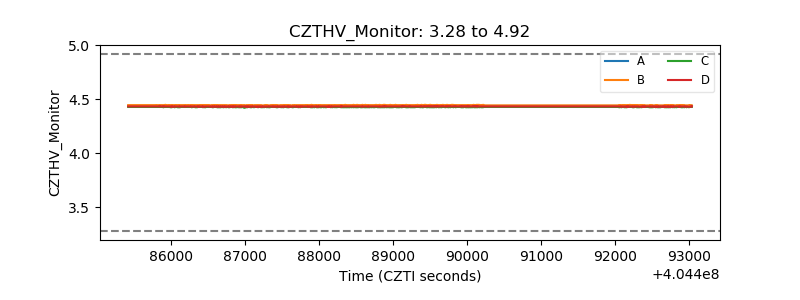 |
| D_VDD | 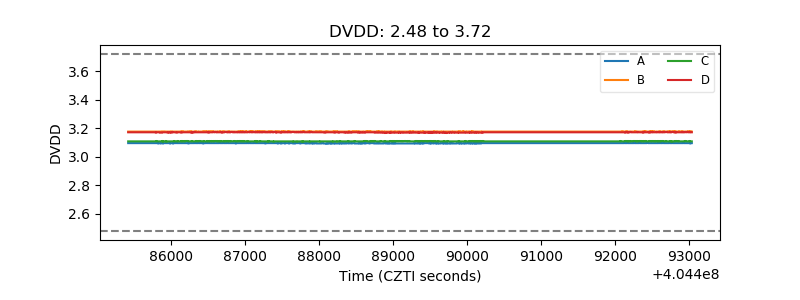 |
| Temperature 1 | 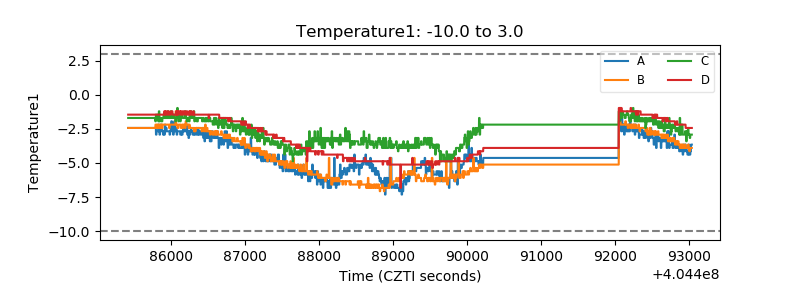 |
| Veto HV Monitor |  |
| Veto LLD | 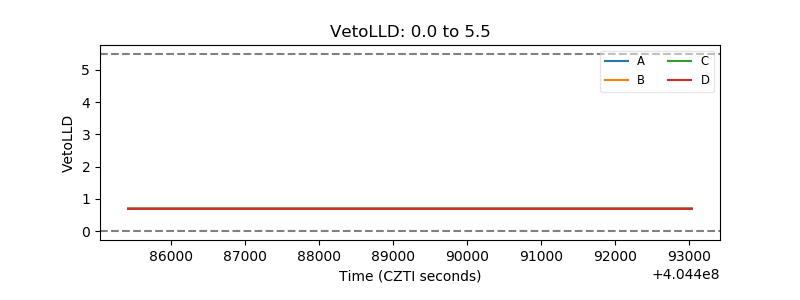 |
| Alpha Counter | 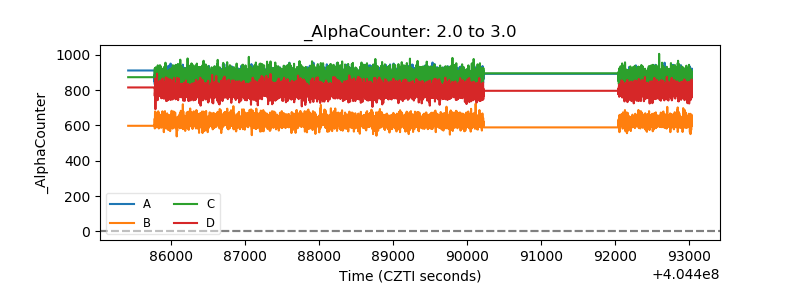 |
| _CPM_Rate | 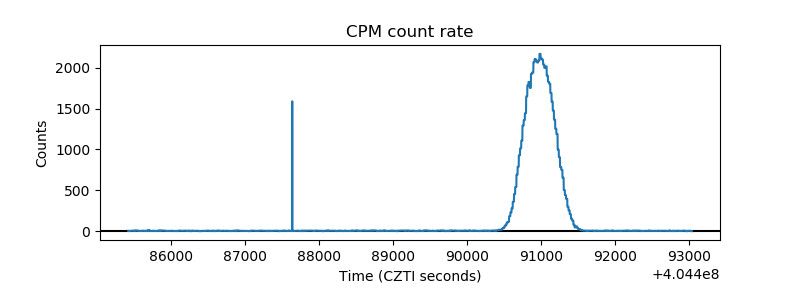 |
| CZT Counter | 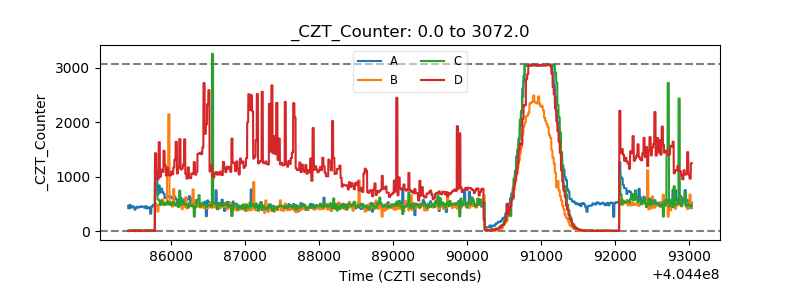 |
| +2.5 Volts monitor | 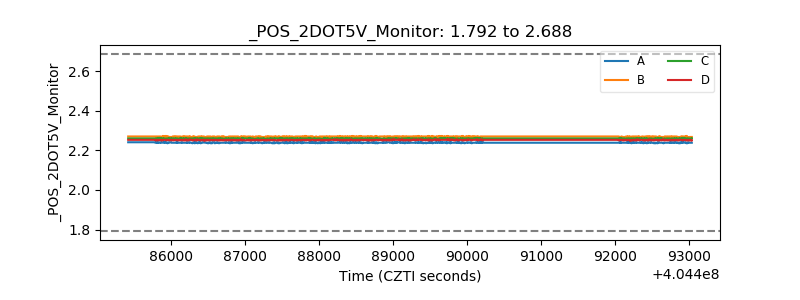 |
| +5 Volts monitor | 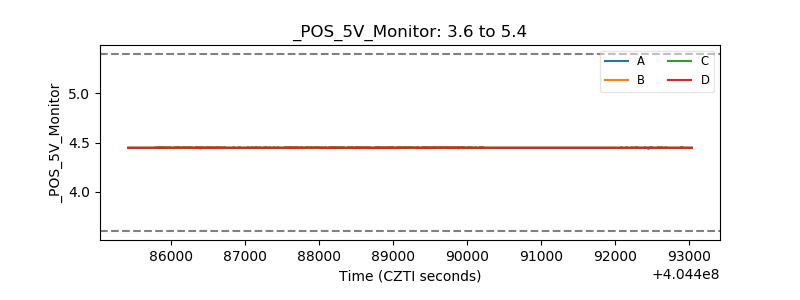 |
| _ROLL_ROT | 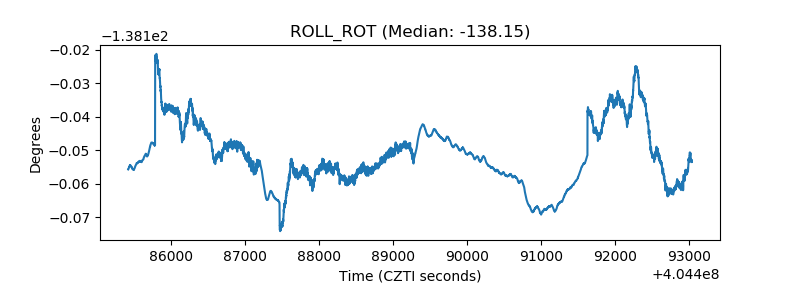 |
| _Roll_DEC | 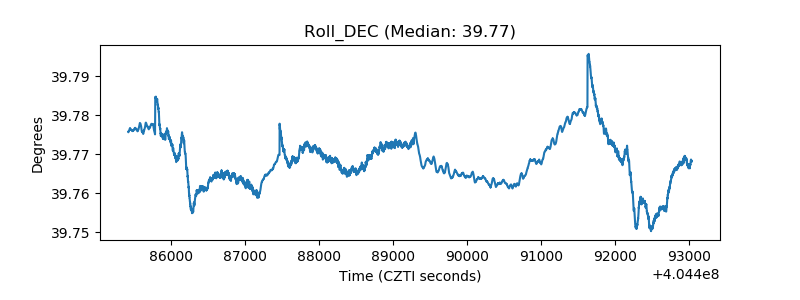 |
| _Roll_RA | 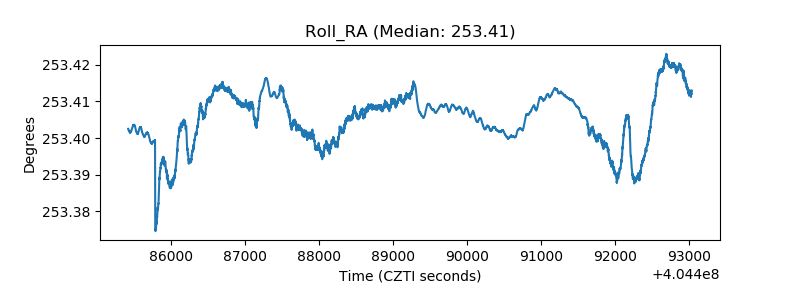 |
| Veto Counter | 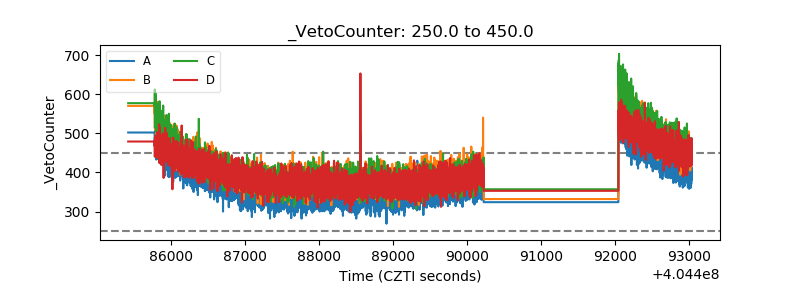 |