| Param | Original file | Final file |
|---|---|---|
| Filename | modeM0/AS1A07_145T01_9000005370_38272cztM0_level2.fits | modeM0/AS1A07_145T01_9000005370_38272cztM0_level2_quad_clean.evt |
| Size (bytes) | 359,449,920 | 92,378,880 |
| Size | 342.8 MB | 88.1 MB |
| Events in quadrant A | 2,642,540 | 625,904 |
| Events in quadrant B | 2,546,177 | 639,811 |
| Events in quadrant C | 2,654,986 | 614,838 |
| Events in quadrant D | 5,071,293 | 564,214 |
| Mode M9 | |||
|---|---|---|---|
| Quadrant | BADHDUFLAG | Total packets | Discarded packets |
| A | 0 | 19 | 0 |
| B | 0 | 19 | 0 |
| C | 0 | 19 | 0 |
| D | 0 | 19 | 0 |
| Mode SS | |||
|---|---|---|---|
| Quadrant | BADHDUFLAG | Total packets | Discarded packets |
| A | 0 | 104 | 0 |
| B | 0 | 104 | 0 |
| C | 0 | 104 | 0 |
| D | 0 | 104 | 0 |
| Mode M0 | |||
|---|---|---|---|
| Quadrant | BADHDUFLAG | Total packets | Discarded packets |
| A | 0 | 10815 | 2 |
| B | 0 | 10761 | 1 |
| C | 0 | 10770 | 1 |
| D | 0 | 18831 | 1 |
| Quadrant | Total seconds | Saturated seconds | Saturation percentage |
|---|---|---|---|
| A | 5026 | 5 | 0.099483% |
| B | 5026 | 55 | 1.094310% |
| C | 5026 | 37 | 0.736172% |
| D | 5026 | 89 | 1.770792% |
Noise dominated data is calculated using 1-second bins in cleaned event files. If a bin has >2000 counts, and if more than 50% of those come from <1% of pixels, then it is considered to be noise-dominated and hence unusable.
| Quadrant | # 1 sec bins | Bins with >0 counts | Bins with >2000 counts | High rate bins dominated by noise | Noise dominated (total time) | Noise dominated (detector-on time) | Marked lightcurve |
|---|---|---|---|---|---|---|---|
| A | 6968 | 5027 | 3 | 3 | 0.04% | 0.06% | 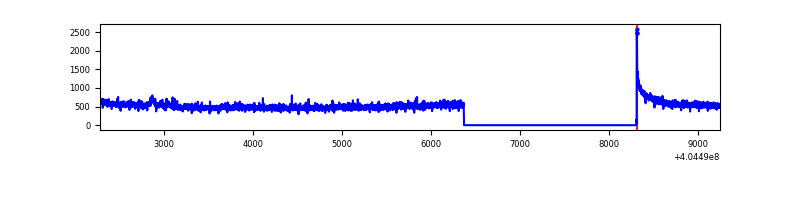 |
| B | 6968 | 5027 | 38 | 38 | 0.55% | 0.76% | 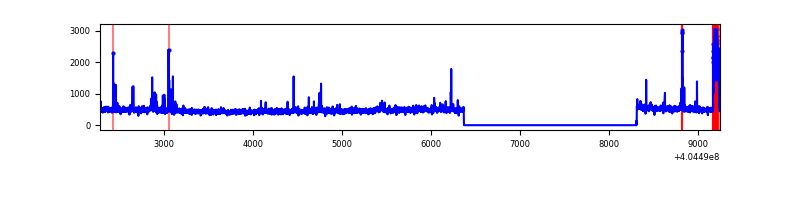 |
| C | 6968 | 5027 | 35 | 35 | 0.50% | 0.70% | 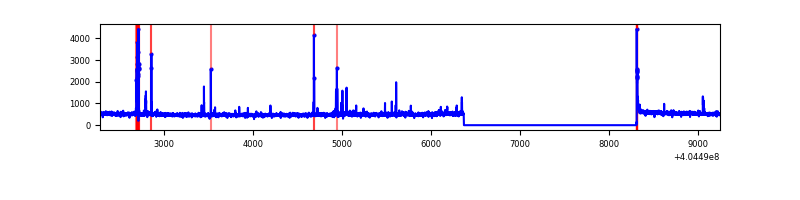 |
| D | 6968 | 5027 | 67 | 67 | 0.96% | 1.33% | 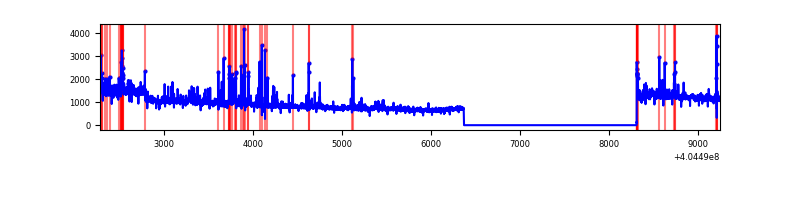 |
Top three noisy pixels from each quadrant. If the there are fewer than three noisy pixels in the level2.evt file, extra rows are filled as -1
| Pixel properties | Quadrant properties | ||||||
|---|---|---|---|---|---|---|---|
| Quadrant | DetID | PixID | Counts | Sigma | Mean | Median | Sigma |
| A | 10 | 83 | 325766 | 2760.81 | 584 | 573 | 117.8 |
| A | 13 | 6 | 32667 | 272.47 | 584 | 573 | 117.8 |
| A | 12 | 189 | 27431 | 228.02 | 584 | 573 | 117.8 |
| B | 5 | 184 | 116532 | 1048.49 | 584 | 569 | 110.6 |
| B | 5 | 172 | 59058 | 528.83 | 584 | 569 | 110.6 |
| B | 15 | 85 | 31224 | 277.17 | 584 | 569 | 110.6 |
| C | 15 | 214 | 206121 | 1541.68 | 578 | 583 | 133.3 |
| C | 2 | 16 | 98249 | 732.56 | 578 | 583 | 133.3 |
| C | 0 | 10 | 29753 | 218.79 | 578 | 583 | 133.3 |
| D | 10 | 203 | 2344767 | 16707.02 | 573 | 558 | 140.3 |
| D | 2 | 250 | 134441 | 954.17 | 573 | 558 | 140.3 |
| D | 12 | 235 | 116295 | 824.85 | 573 | 558 | 140.3 |
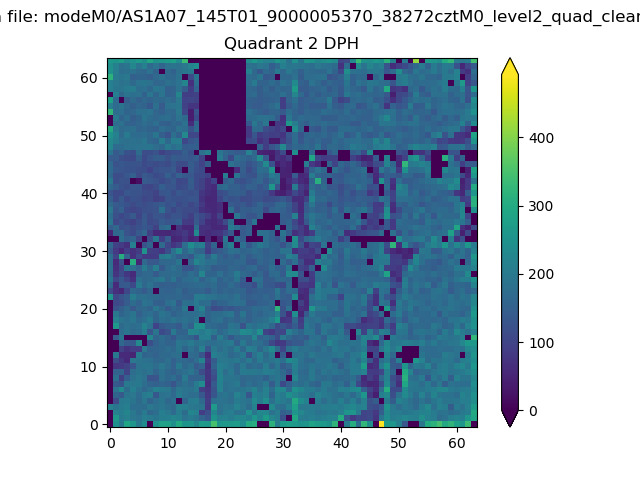
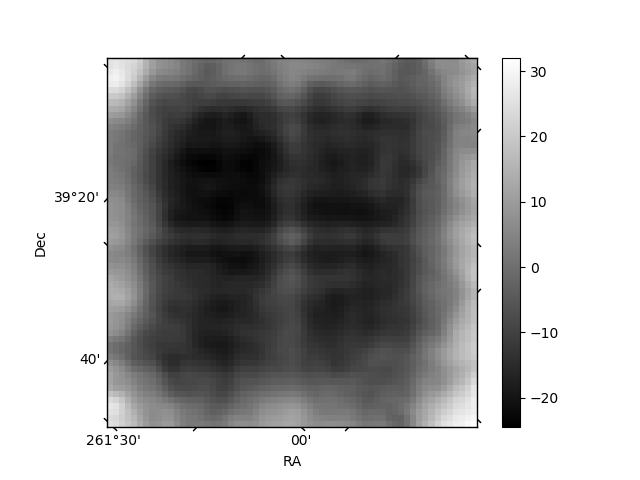
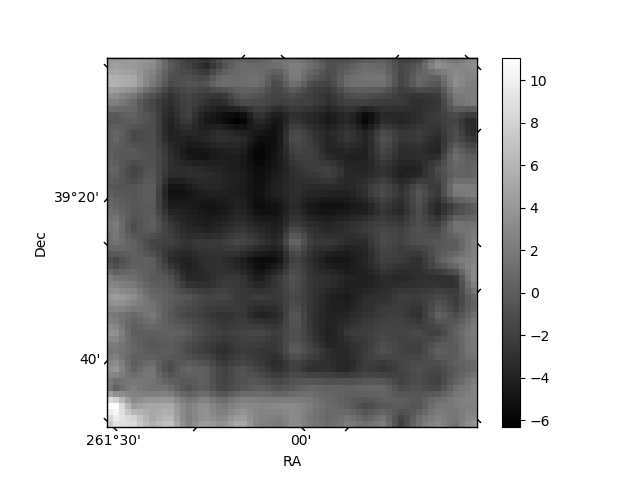
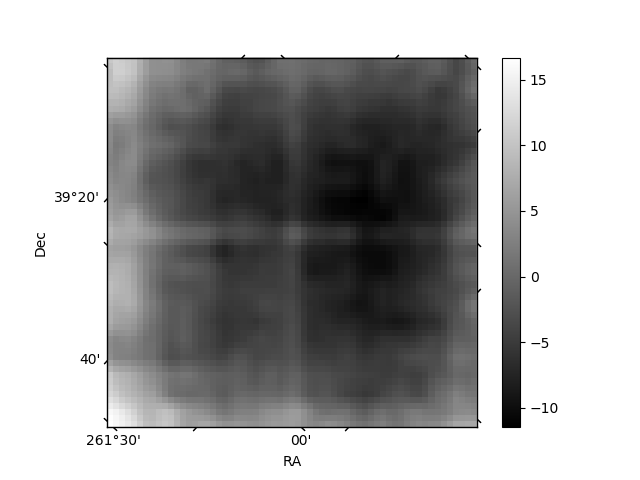
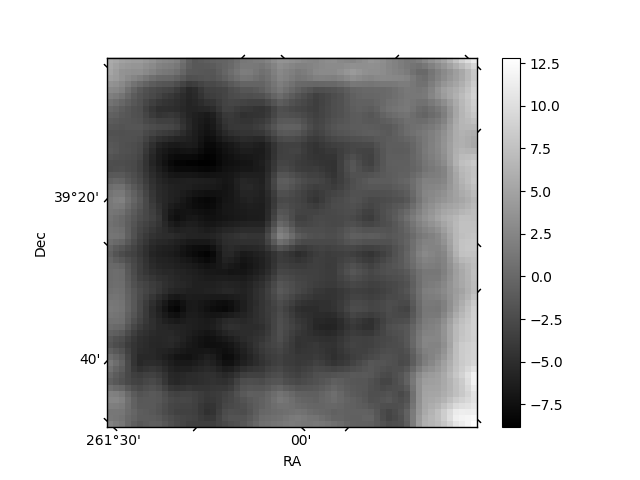
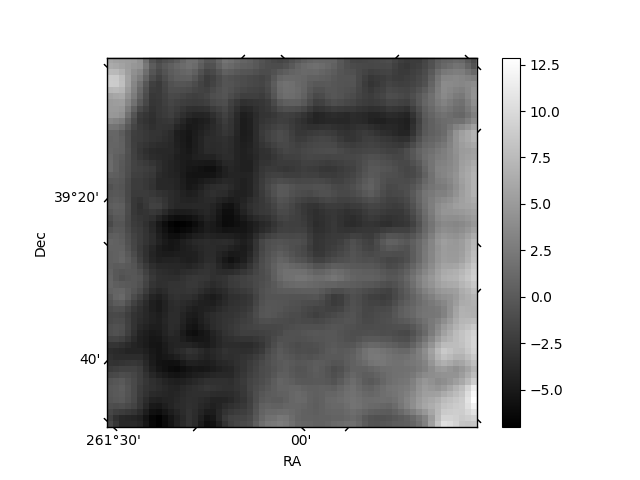
Histogram calculated using DETX and DETY for each event in the final _common_clean file
| Quadrant A | 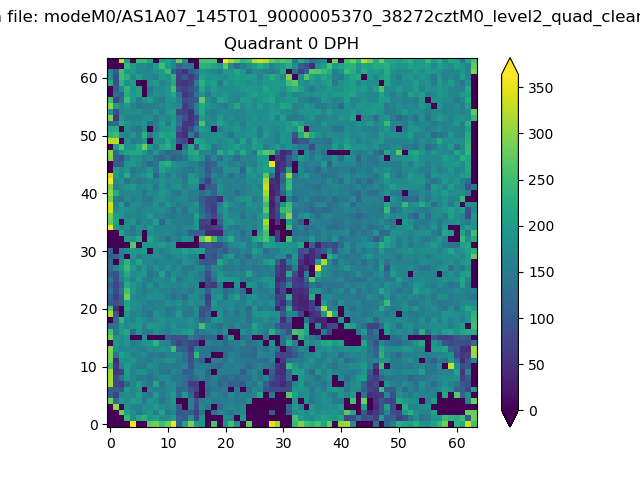 |
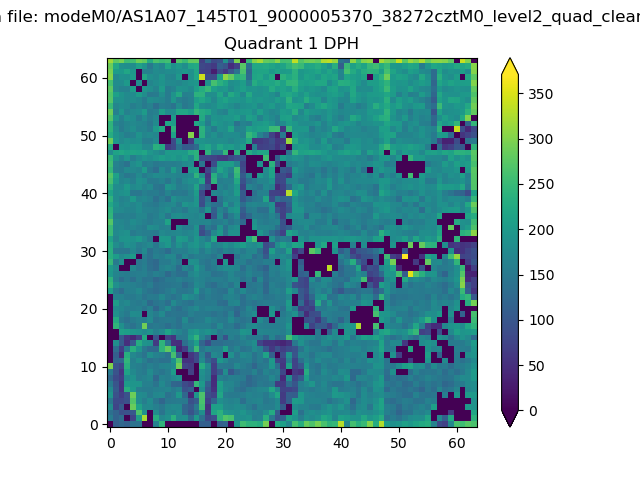 |
Quadrant B |
|---|---|---|---|
| Quadrant D | 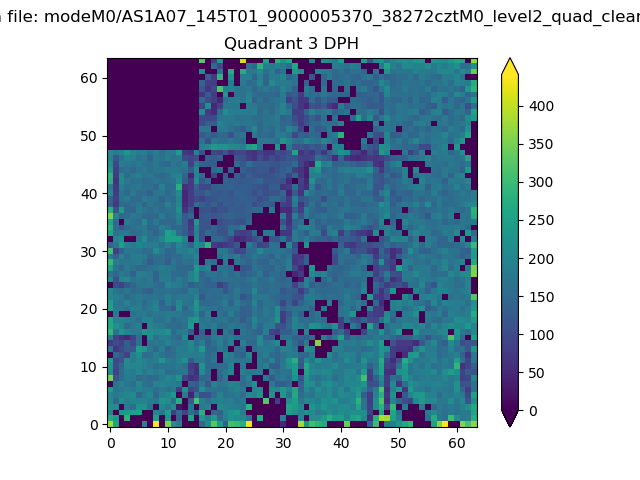 |
 |
Quadrant C |
| Plot type | Count rate plots | Images |
|---|---|---|
| Comparison with Poisson distribution Blue bars denote a histogram of data divided into 1 sec bins. Red curve is a Poisson curve with rate = median count rate of data. |
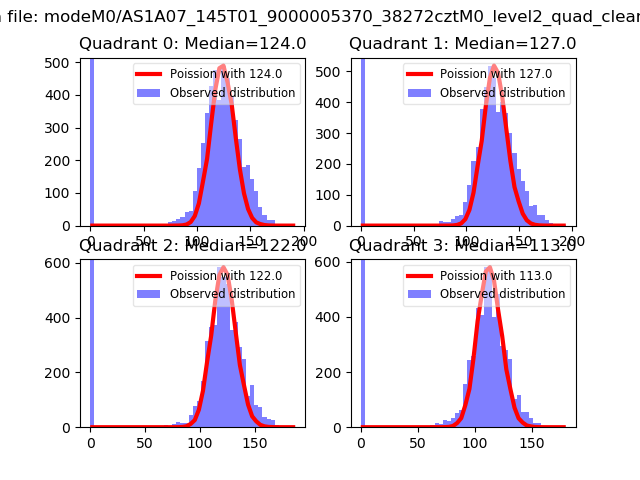 |
 |
| Quadrant-wise count rates Data is divided into 100 sec bins |
 |
|
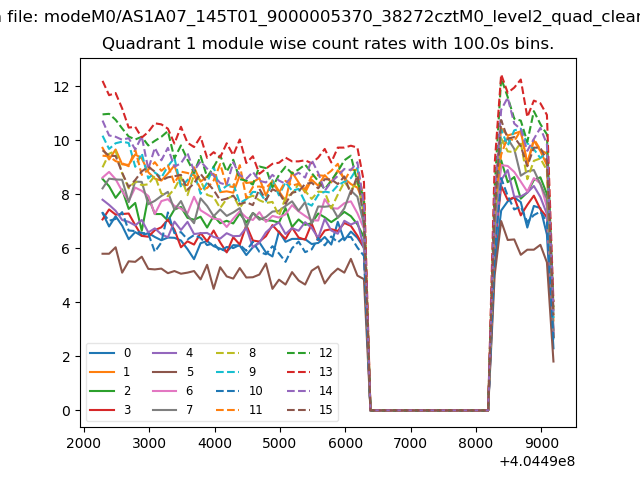
| Module-wise count rates for Quadrant A Data is divided into 100 sec bins |
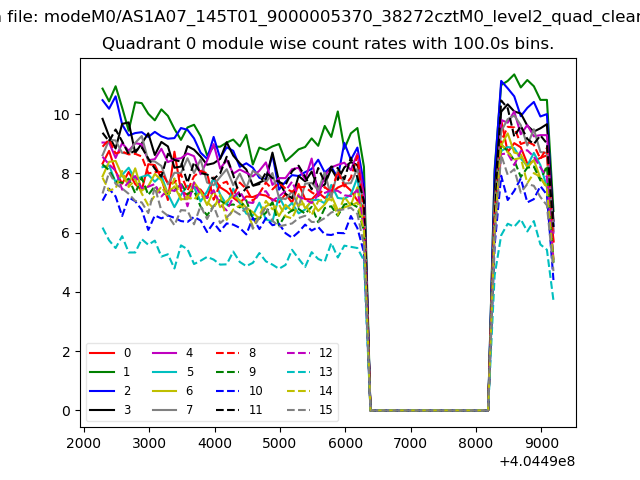 |
 |
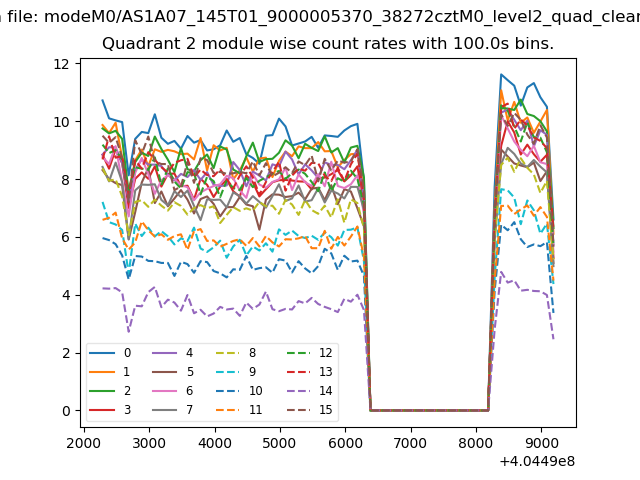
| Module-wise count rates for Quadrant B Data is divided into 100 sec bins |
 |
 |
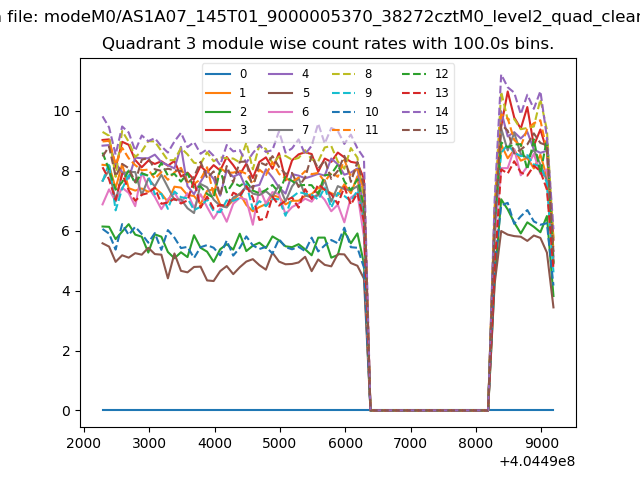
| Module-wise count rates for Quadrant C Data is divided into 100 sec bins |
 |
 |
| Module-wise count rates for Quadrant D Data is divided into 100 sec bins |
 |
 |
| Parameter | Plot |
|---|---|
| CZT HV Monitor | 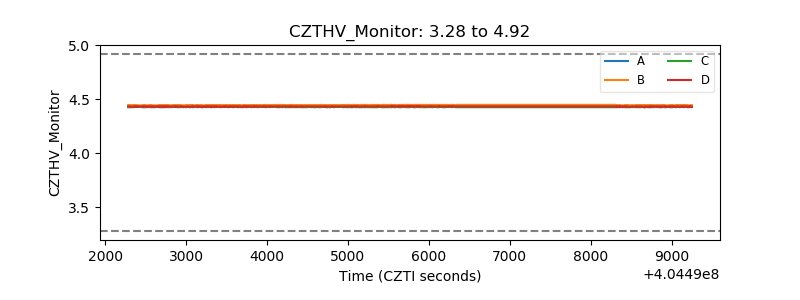 |
| D_VDD | 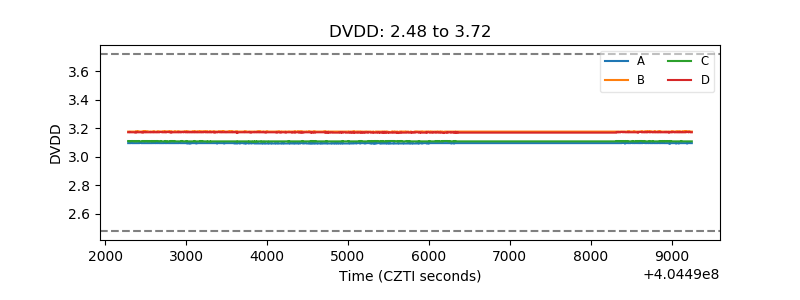 |
| Temperature 1 | 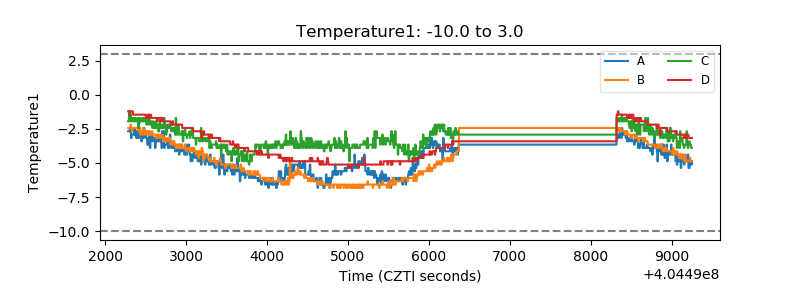 |
| Veto HV Monitor | 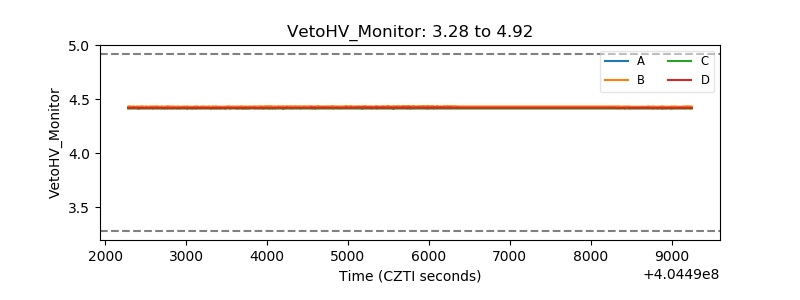 |
| Veto LLD | 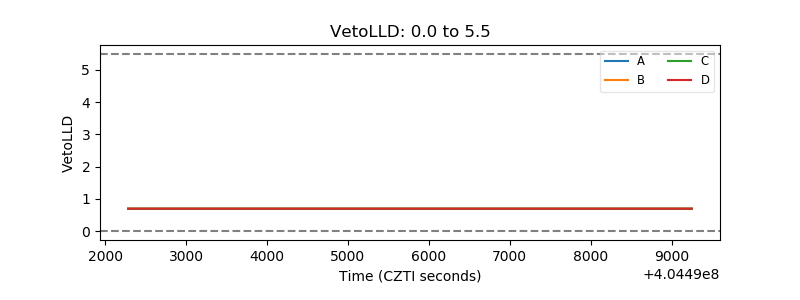 |
| Alpha Counter | 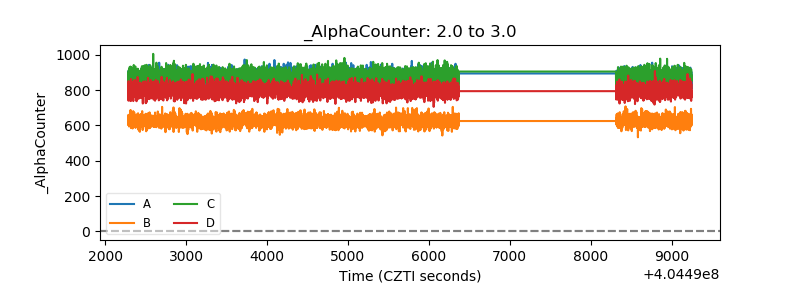 |
| _CPM_Rate |  |
| CZT Counter | 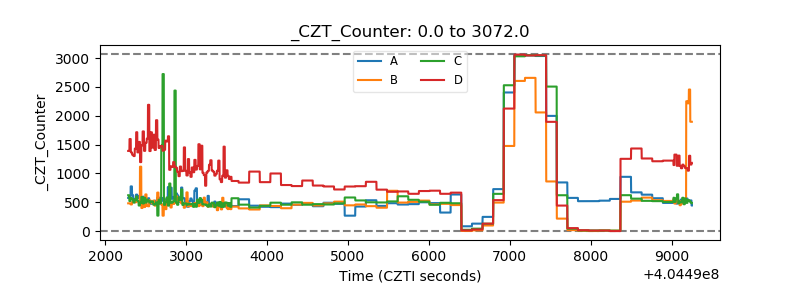 |
| +2.5 Volts monitor | 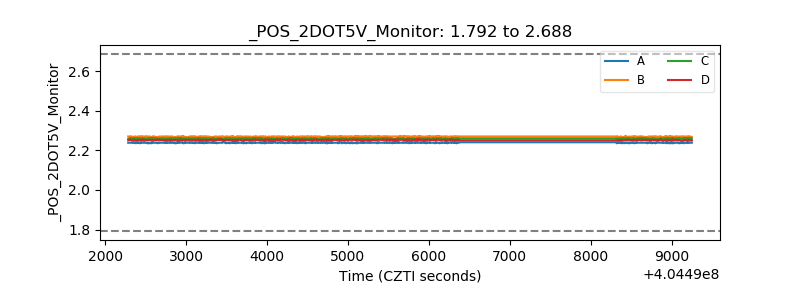 |
| +5 Volts monitor | 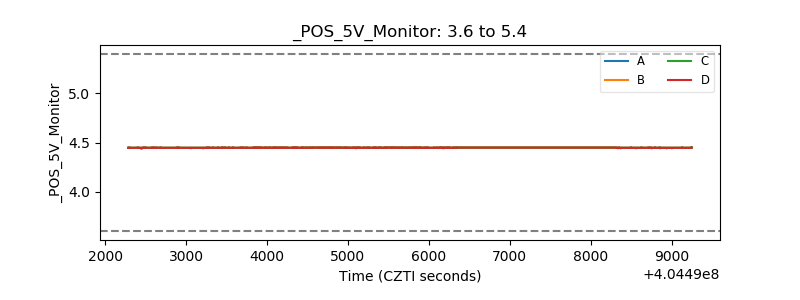 |
| _ROLL_ROT | 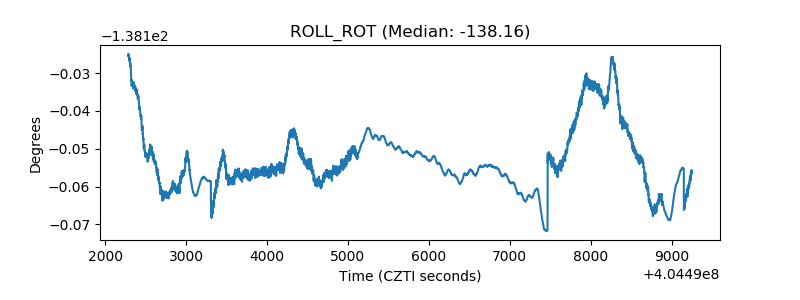 |
| _Roll_DEC | 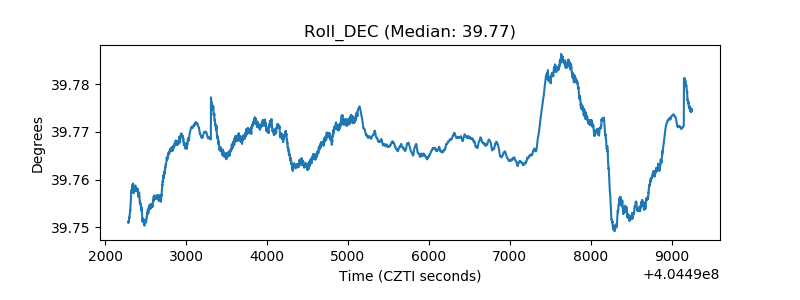 |
| _Roll_RA | 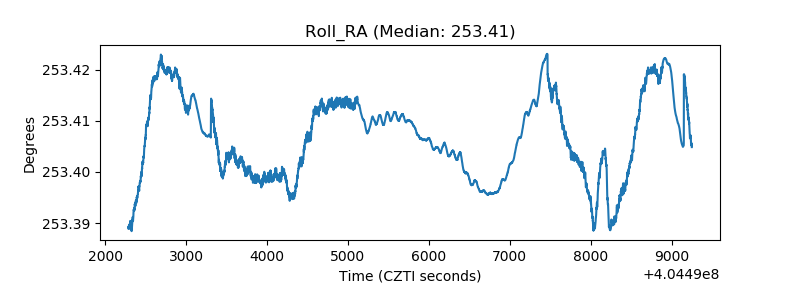 |
| Veto Counter | 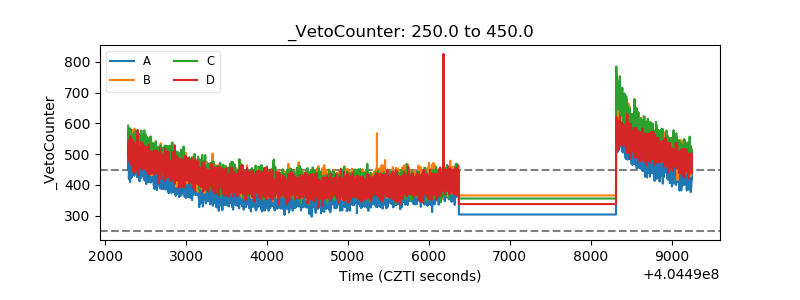 |