| Param | Original file | Final file |
|---|---|---|
| Filename | modeM0/AS1A07_145T01_9000005370_38274cztM0_level2.fits | modeM0/AS1A07_145T01_9000005370_38274cztM0_level2_quad_clean.evt |
| Size (bytes) | 348,684,480 | 92,194,560 |
| Size | 332.5 MB | 87.9 MB |
| Events in quadrant A | 2,630,621 | 617,986 |
| Events in quadrant B | 2,453,348 | 643,573 |
| Events in quadrant C | 2,603,463 | 619,445 |
| Events in quadrant D | 4,840,165 | 568,392 |
| Mode M9 | |||
|---|---|---|---|
| Quadrant | BADHDUFLAG | Total packets | Discarded packets |
| A | 0 | 30 | 0 |
| B | 0 | 30 | 0 |
| C | 0 | 30 | 0 |
| D | 0 | 31 | 0 |
| Mode SS | |||
|---|---|---|---|
| Quadrant | BADHDUFLAG | Total packets | Discarded packets |
| A | 0 | 100 | 0 |
| B | 0 | 100 | 0 |
| C | 0 | 100 | 0 |
| D | 0 | 100 | 0 |
| Mode M0 | |||
|---|---|---|---|
| Quadrant | BADHDUFLAG | Total packets | Discarded packets |
| A | 0 | 10689 | 3 |
| B | 0 | 10327 | 2 |
| C | 0 | 10478 | 2 |
| D | 0 | 17791 | 2 |
| Quadrant | Total seconds | Saturated seconds | Saturation percentage |
|---|---|---|---|
| A | 4882 | 13 | 0.266284% |
| B | 4882 | 29 | 0.594019% |
| C | 4882 | 33 | 0.675952% |
| D | 4882 | 55 | 1.126587% |
Noise dominated data is calculated using 1-second bins in cleaned event files. If a bin has >2000 counts, and if more than 50% of those come from <1% of pixels, then it is considered to be noise-dominated and hence unusable.
| Quadrant | # 1 sec bins | Bins with >0 counts | Bins with >2000 counts | High rate bins dominated by noise | Noise dominated (total time) | Noise dominated (detector-on time) | Marked lightcurve |
|---|---|---|---|---|---|---|---|
| A | 7006 | 4883 | 6 | 6 | 0.09% | 0.12% | 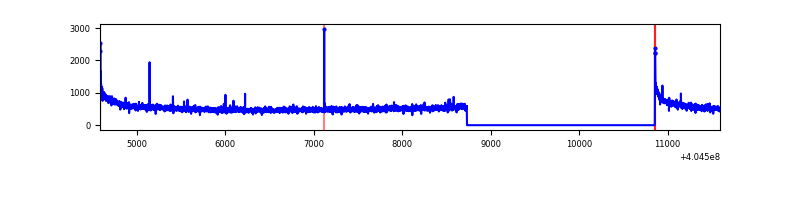 |
| B | 7006 | 4883 | 13 | 13 | 0.19% | 0.27% | 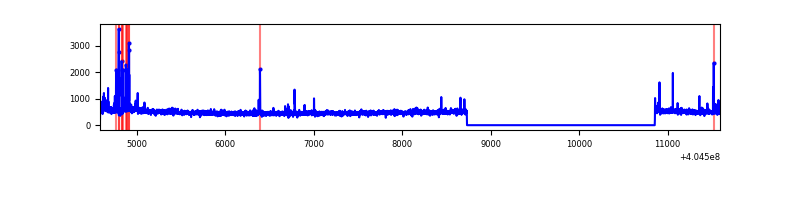 |
| C | 7006 | 4883 | 29 | 29 | 0.41% | 0.59% | 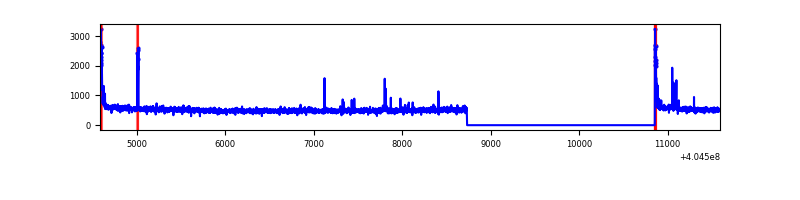 |
| D | 7006 | 4883 | 45 | 45 | 0.64% | 0.92% | 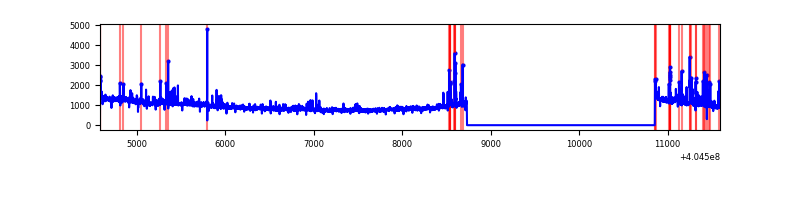 |
Top three noisy pixels from each quadrant. If the there are fewer than three noisy pixels in the level2.evt file, extra rows are filled as -1
| Pixel properties | Quadrant properties | ||||||
|---|---|---|---|---|---|---|---|
| Quadrant | DetID | PixID | Counts | Sigma | Mean | Median | Sigma |
| A | 10 | 83 | 358561 | 3133.84 | 575 | 564 | 114.2 |
| A | 12 | 189 | 21811 | 185.99 | 575 | 564 | 114.2 |
| A | 13 | 6 | 9186 | 75.48 | 575 | 564 | 114.2 |
| B | 0 | 229 | 79032 | 710.76 | 580 | 564 | 110.4 |
| B | 5 | 172 | 60840 | 545.98 | 580 | 564 | 110.4 |
| B | 4 | 232 | 17237 | 151.02 | 580 | 564 | 110.4 |
| C | 15 | 214 | 206695 | 1545.59 | 576 | 580 | 133.4 |
| C | 0 | 10 | 96854 | 721.93 | 576 | 580 | 133.4 |
| C | 2 | 16 | 27787 | 204.02 | 576 | 580 | 133.4 |
| D | 10 | 203 | 2234655 | 16364.32 | 567 | 553 | 136.5 |
| D | 10 | 233 | 113571 | 827.83 | 567 | 553 | 136.5 |
| D | 12 | 235 | 82729 | 601.92 | 567 | 553 | 136.5 |
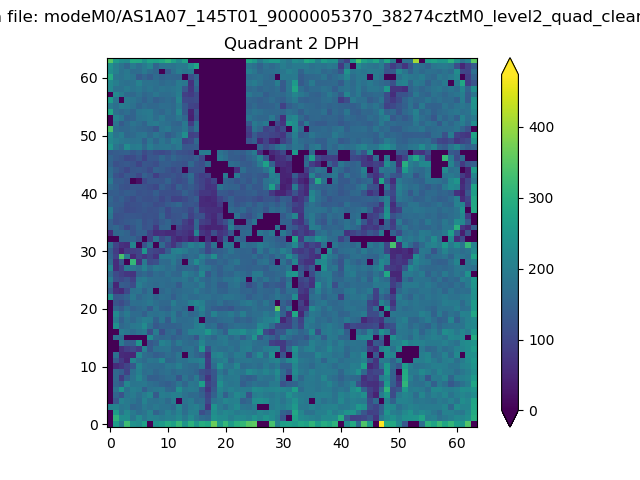
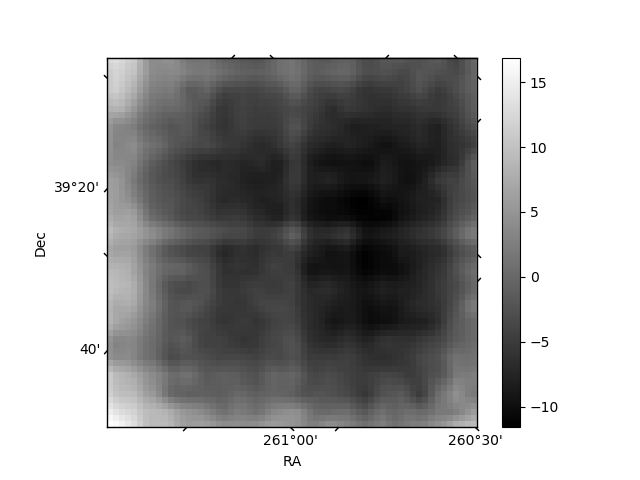
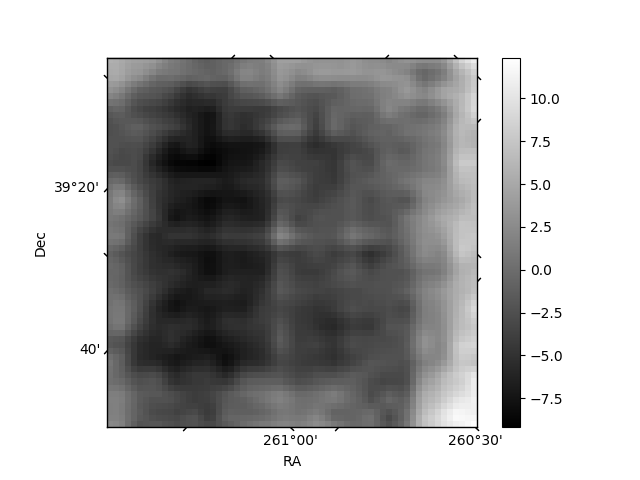
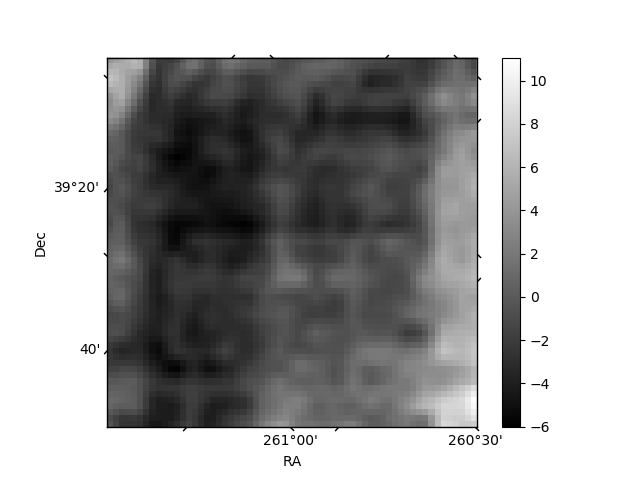
Histogram calculated using DETX and DETY for each event in the final _common_clean file
| Quadrant A |  |
 |
Quadrant B |
|---|---|---|---|
| Quadrant D | 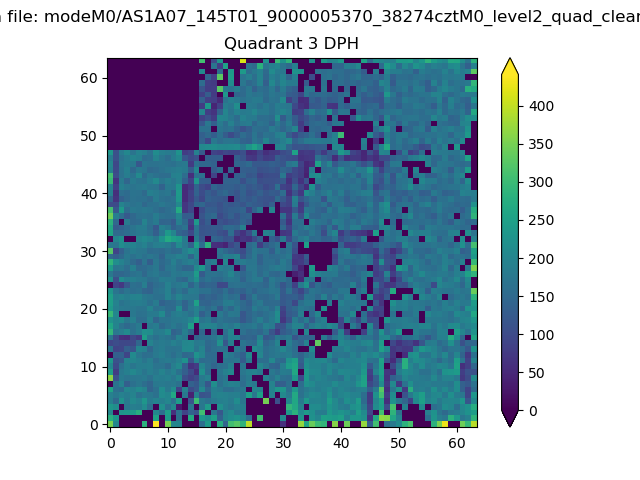 |
 |
Quadrant C |
| Plot type | Count rate plots | Images |
|---|---|---|
| Comparison with Poisson distribution Blue bars denote a histogram of data divided into 1 sec bins. Red curve is a Poisson curve with rate = median count rate of data. |
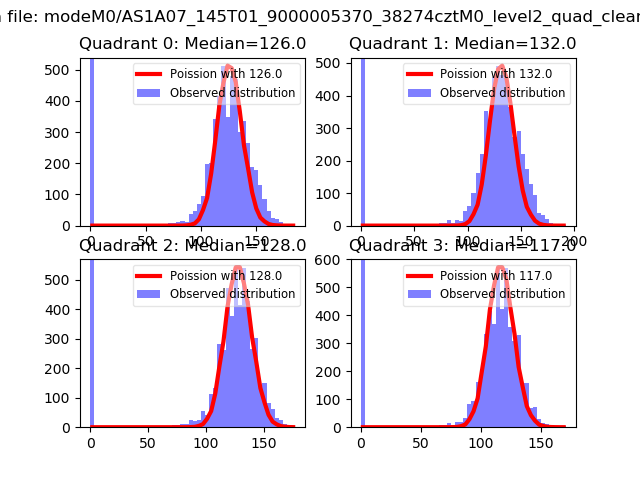 |
 |
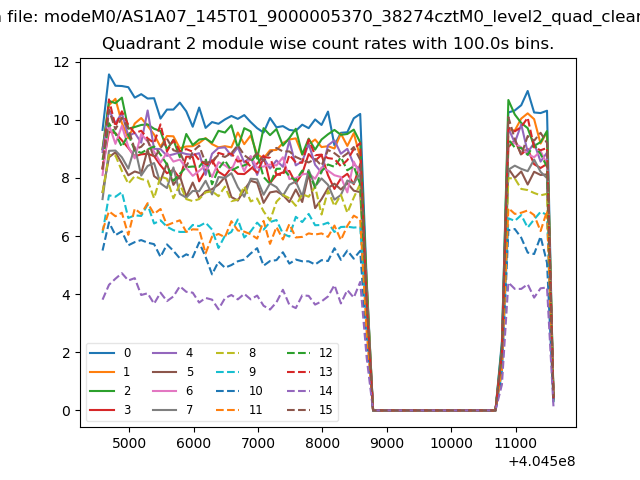
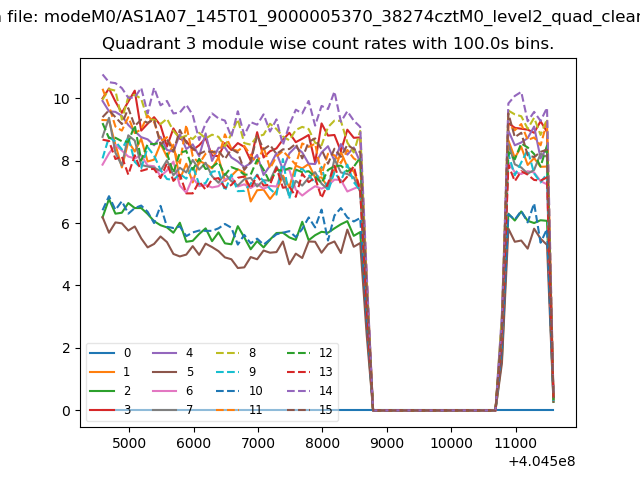
| Quadrant-wise count rates Data is divided into 100 sec bins |
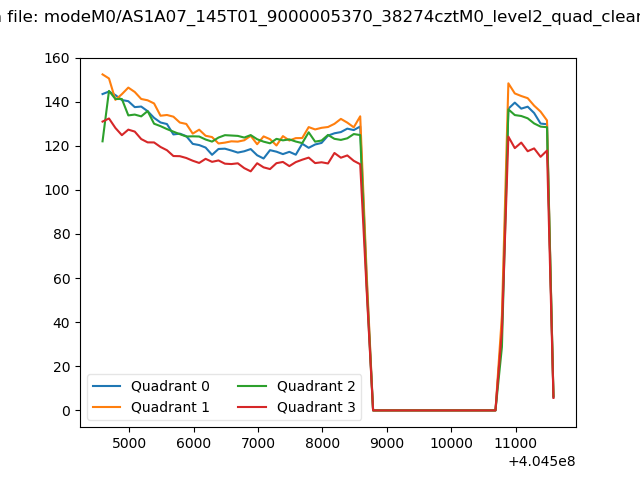 |
|
| Module-wise count rates for Quadrant A Data is divided into 100 sec bins |
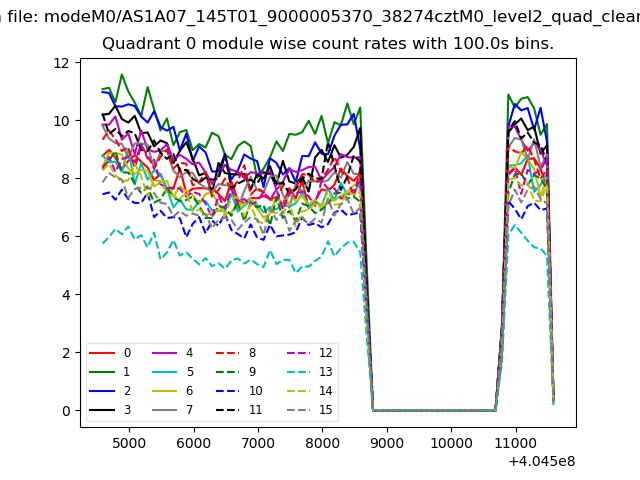 |
 |
| Module-wise count rates for Quadrant B Data is divided into 100 sec bins |
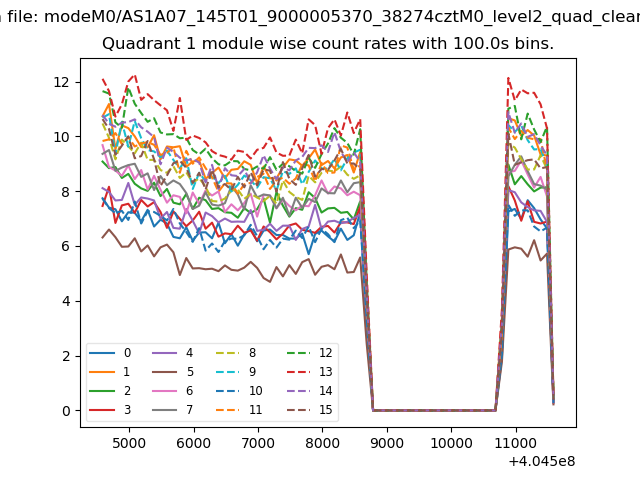 |
 |
| Module-wise count rates for Quadrant C Data is divided into 100 sec bins |
 |
 |
| Module-wise count rates for Quadrant D Data is divided into 100 sec bins |
 |
 |
| Parameter | Plot |
|---|---|
| CZT HV Monitor | 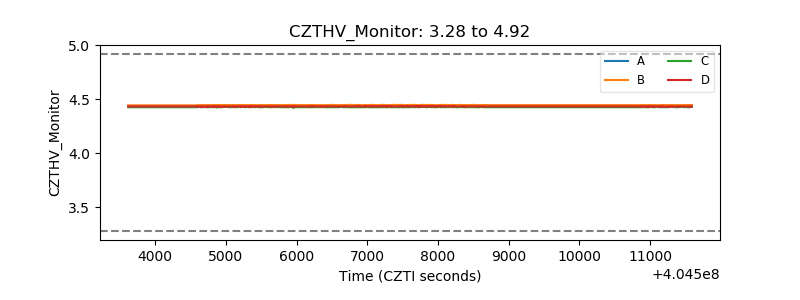 |
| D_VDD | 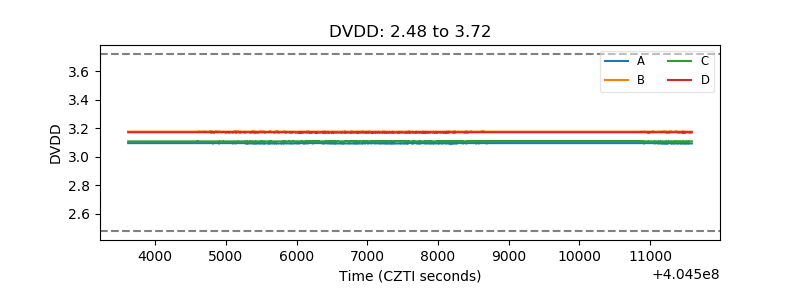 |
| Temperature 1 | 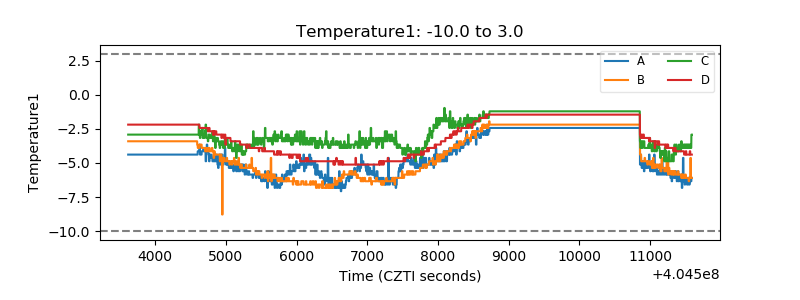 |
| Veto HV Monitor | 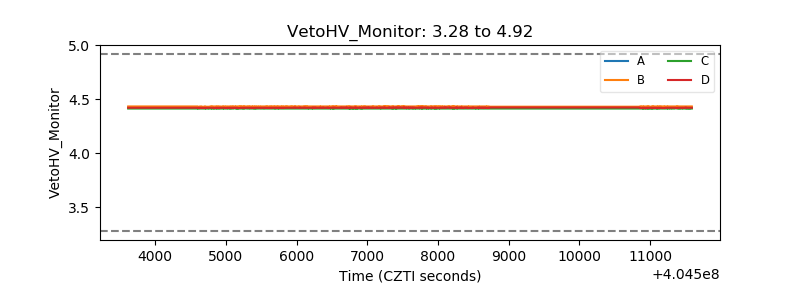 |
| Veto LLD | 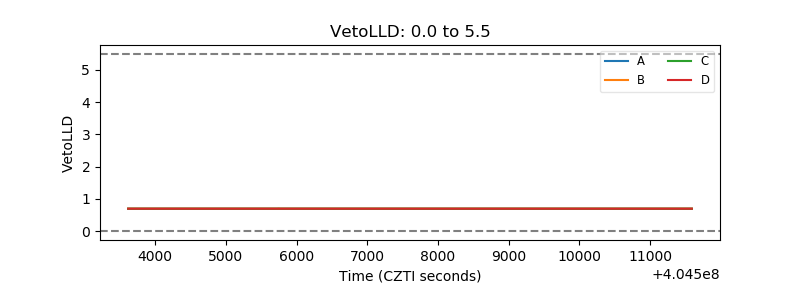 |
| Alpha Counter | 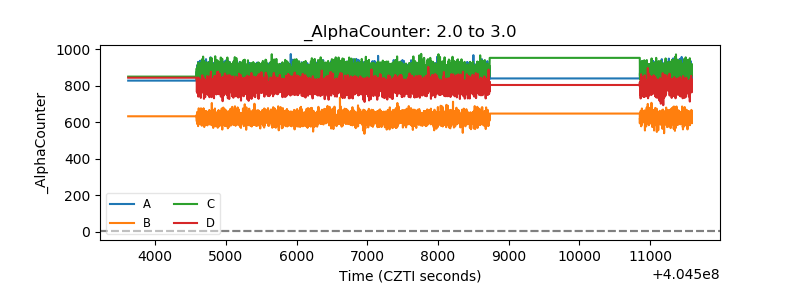 |
| _CPM_Rate | 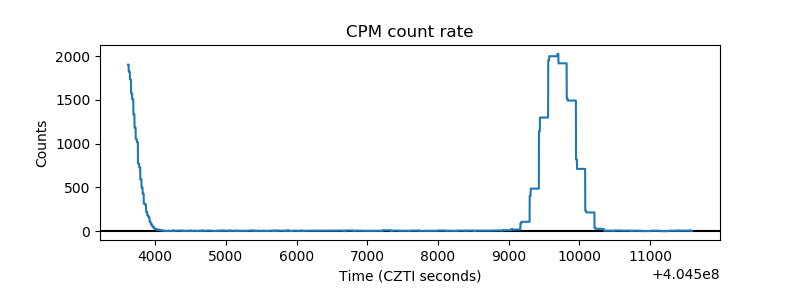 |
| CZT Counter | 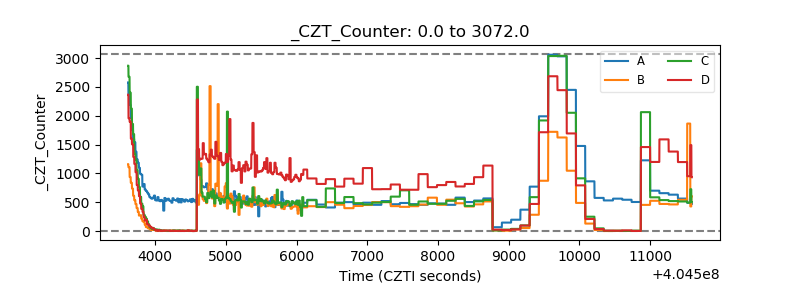 |
| +2.5 Volts monitor | 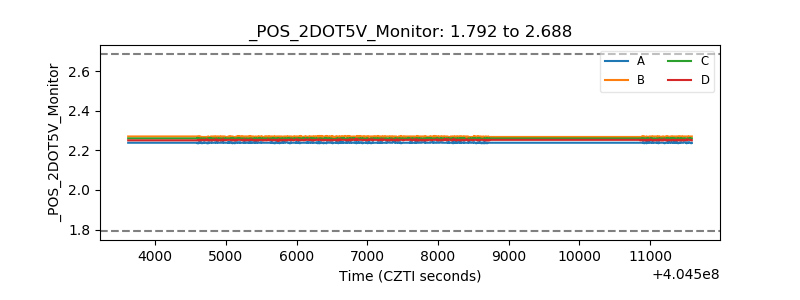 |
| +5 Volts monitor | 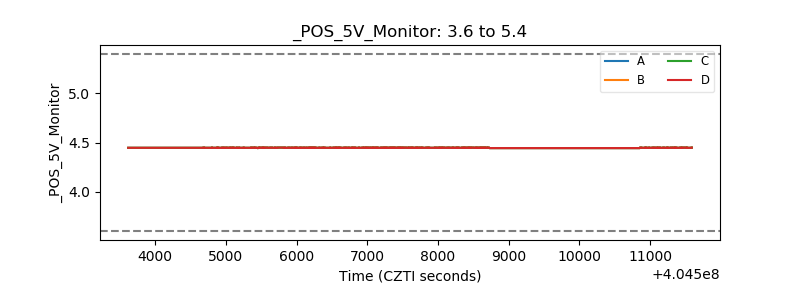 |
| _ROLL_ROT | 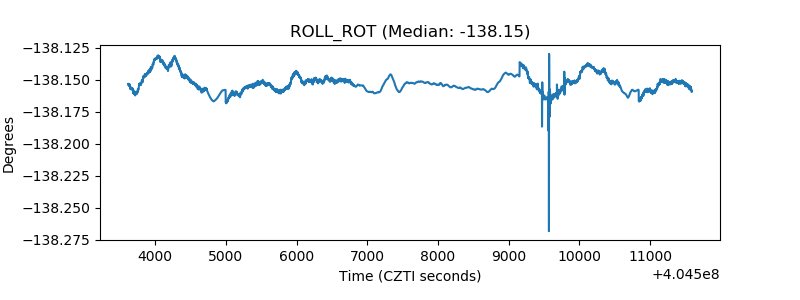 |
| _Roll_DEC | 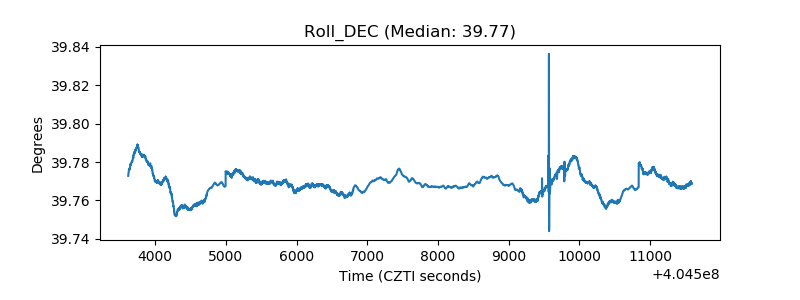 |
| _Roll_RA | 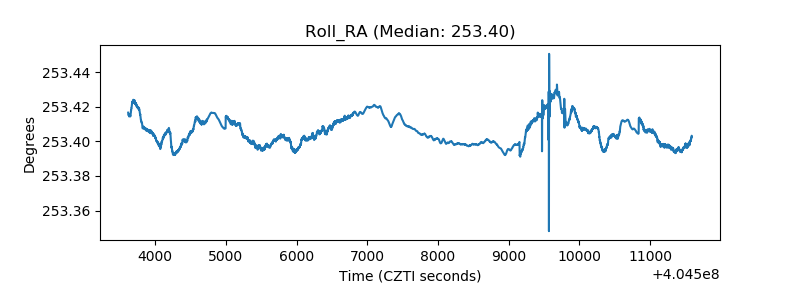 |
| Veto Counter | 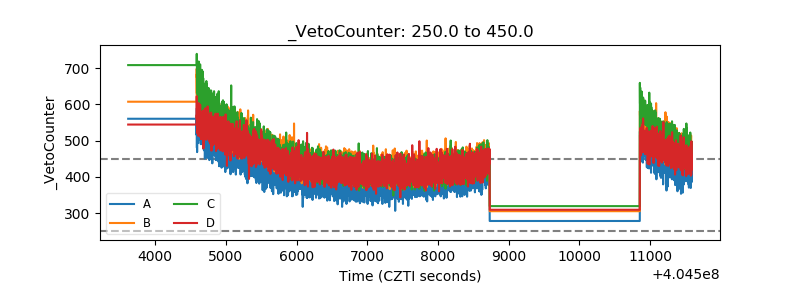 |