| Param | Original file | Final file |
|---|---|---|
| Filename | modeM0/AS1A07_145T01_9000005370_38275cztM0_level2.fits | modeM0/AS1A07_145T01_9000005370_38275cztM0_level2_quad_clean.evt |
| Size (bytes) | 362,905,920 | 92,404,800 |
| Size | 346.1 MB | 88.1 MB |
| Events in quadrant A | 2,703,289 | 619,826 |
| Events in quadrant B | 2,499,123 | 641,540 |
| Events in quadrant C | 2,593,823 | 619,758 |
| Events in quadrant D | 5,241,826 | 561,130 |
| Mode M9 | |||
|---|---|---|---|
| Quadrant | BADHDUFLAG | Total packets | Discarded packets |
| A | 0 | 33 | 0 |
| B | 0 | 33 | 0 |
| C | 0 | 33 | 0 |
| D | 0 | 34 | 0 |
| Mode SS | |||
|---|---|---|---|
| Quadrant | BADHDUFLAG | Total packets | Discarded packets |
| A | 0 | 102 | 0 |
| B | 0 | 102 | 0 |
| C | 0 | 102 | 0 |
| D | 0 | 102 | 0 |
| Mode M0 | |||
|---|---|---|---|
| Quadrant | BADHDUFLAG | Total packets | Discarded packets |
| A | 0 | 11058 | 3 |
| B | 0 | 10645 | 2 |
| C | 0 | 10630 | 2 |
| D | 0 | 19318 | 2 |
| Quadrant | Total seconds | Saturated seconds | Saturation percentage |
|---|---|---|---|
| A | 5085 | 14 | 0.275320% |
| B | 5085 | 35 | 0.688299% |
| C | 5085 | 16 | 0.314651% |
| D | 5085 | 167 | 3.284169% |
Noise dominated data is calculated using 1-second bins in cleaned event files. If a bin has >2000 counts, and if more than 50% of those come from <1% of pixels, then it is considered to be noise-dominated and hence unusable.
| Quadrant | # 1 sec bins | Bins with >0 counts | Bins with >2000 counts | High rate bins dominated by noise | Noise dominated (total time) | Noise dominated (detector-on time) | Marked lightcurve |
|---|---|---|---|---|---|---|---|
| A | 7238 | 5086 | 5 | 5 | 0.07% | 0.10% | 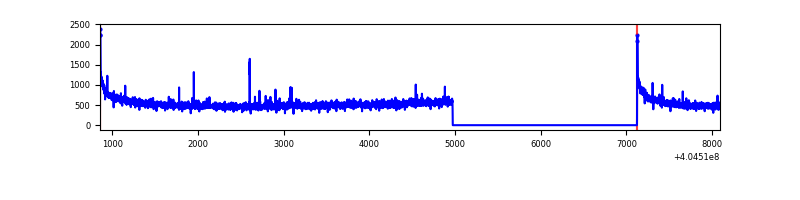 |
| B | 7238 | 5086 | 21 | 21 | 0.29% | 0.41% | 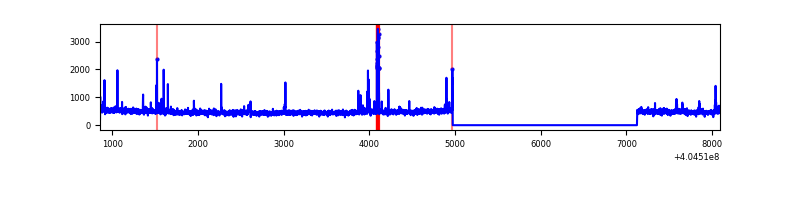 |
| C | 7238 | 5086 | 13 | 13 | 0.18% | 0.26% | 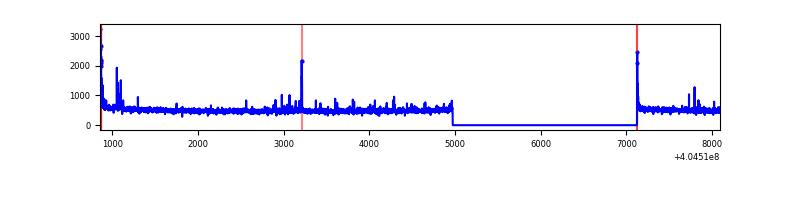 |
| D | 7238 | 5086 | 167 | 167 | 2.31% | 3.28% | 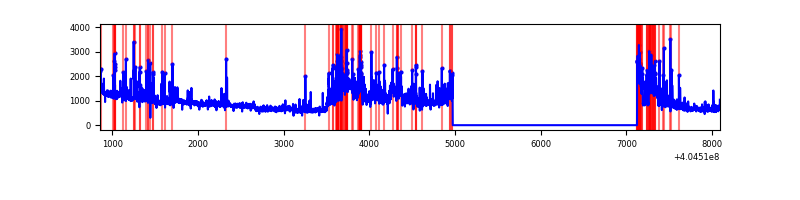 |
Top three noisy pixels from each quadrant. If the there are fewer than three noisy pixels in the level2.evt file, extra rows are filled as -1
| Pixel properties | Quadrant properties | ||||||
|---|---|---|---|---|---|---|---|
| Quadrant | DetID | PixID | Counts | Sigma | Mean | Median | Sigma |
| A | 10 | 83 | 367233 | 3122.78 | 586 | 573 | 117.4 |
| A | 12 | 189 | 23997 | 199.5 | 586 | 573 | 117.4 |
| A | 7 | 16 | 16888 | 138.95 | 586 | 573 | 117.4 |
| B | 5 | 172 | 86897 | 767.87 | 589 | 574 | 112.4 |
| B | 4 | 232 | 35869 | 313.96 | 589 | 574 | 112.4 |
| B | 0 | 229 | 34447 | 301.31 | 589 | 574 | 112.4 |
| C | 15 | 214 | 212928 | 1581.48 | 581 | 589 | 134.3 |
| C | 0 | 10 | 51358 | 378.12 | 581 | 589 | 134.3 |
| C | 15 | 208 | 23285 | 169.04 | 581 | 589 | 134.3 |
| D | 10 | 203 | 1732756 | 12534.61 | 572 | 557 | 138.2 |
| D | 13 | 138 | 633928 | 4583.23 | 572 | 557 | 138.2 |
| D | 12 | 235 | 349129 | 2522.35 | 572 | 557 | 138.2 |
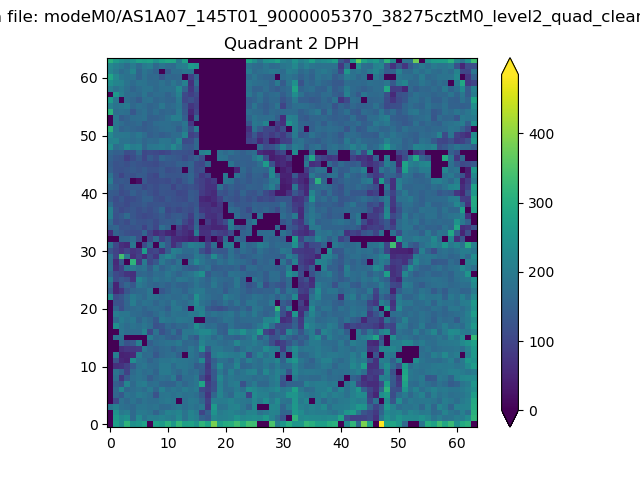
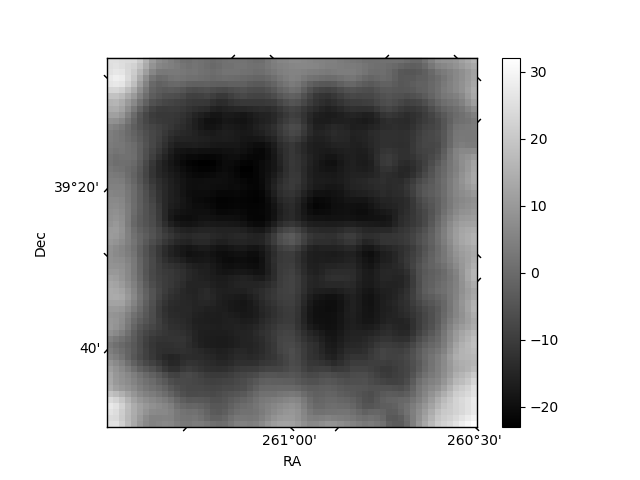
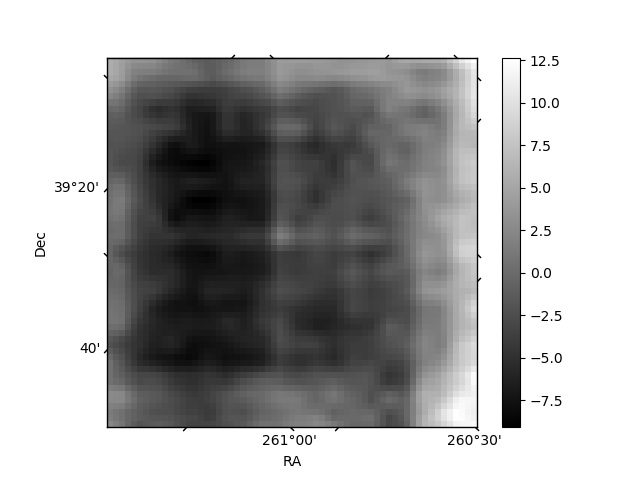
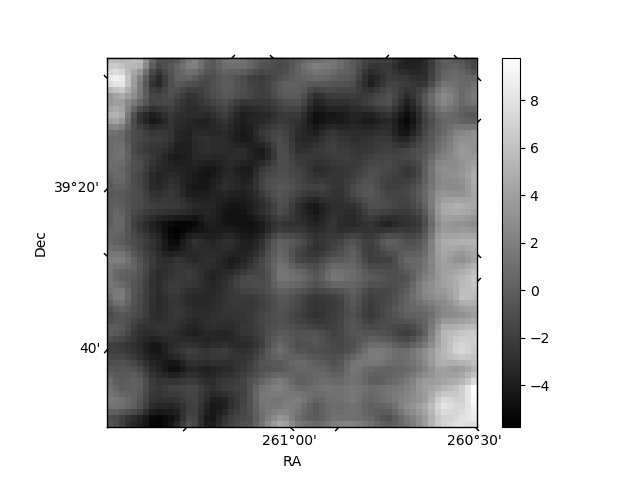
Histogram calculated using DETX and DETY for each event in the final _common_clean file
| Quadrant A | 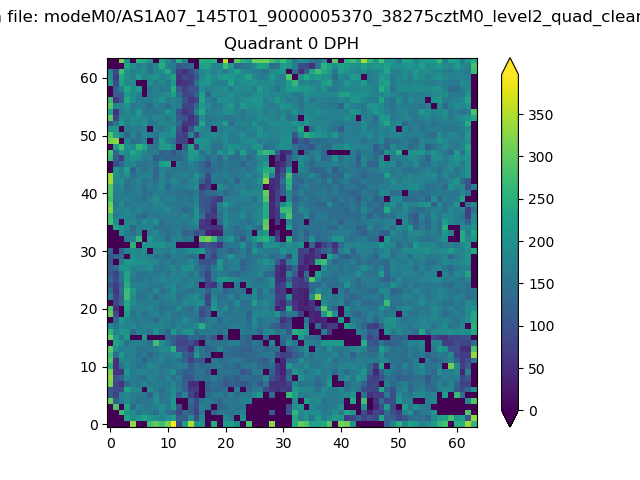 |
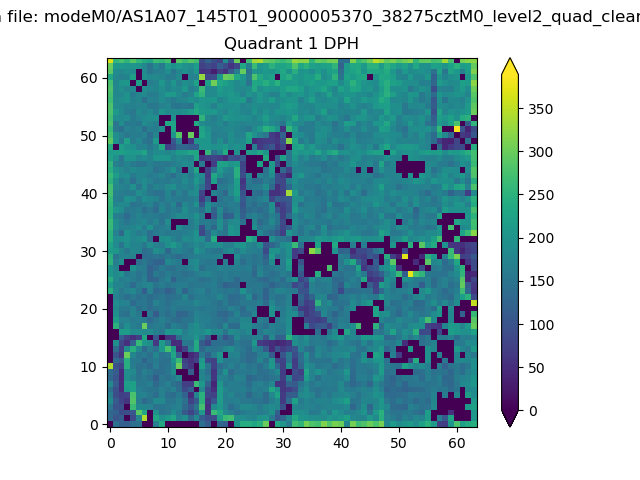 |
Quadrant B |
|---|---|---|---|
| Quadrant D | 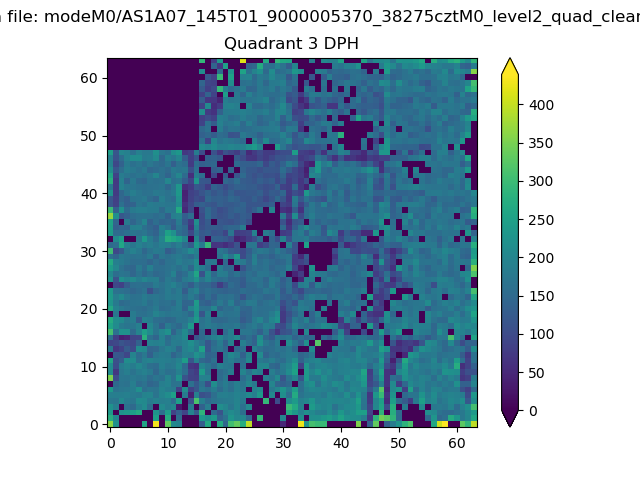 |
 |
Quadrant C |
| Plot type | Count rate plots | Images |
|---|---|---|
| Comparison with Poisson distribution Blue bars denote a histogram of data divided into 1 sec bins. Red curve is a Poisson curve with rate = median count rate of data. |
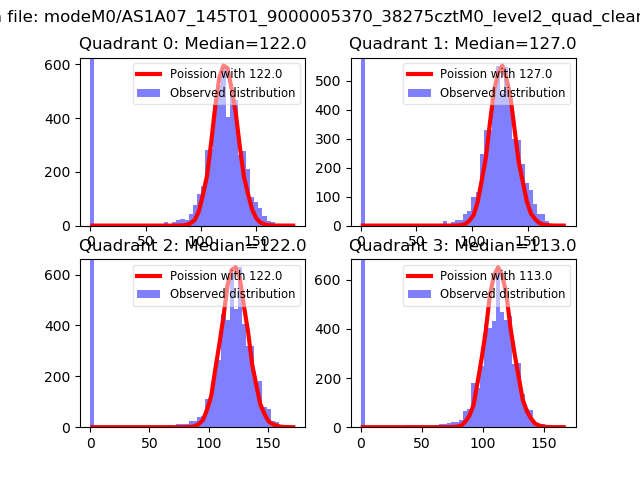 |
 |
| Quadrant-wise count rates Data is divided into 100 sec bins |
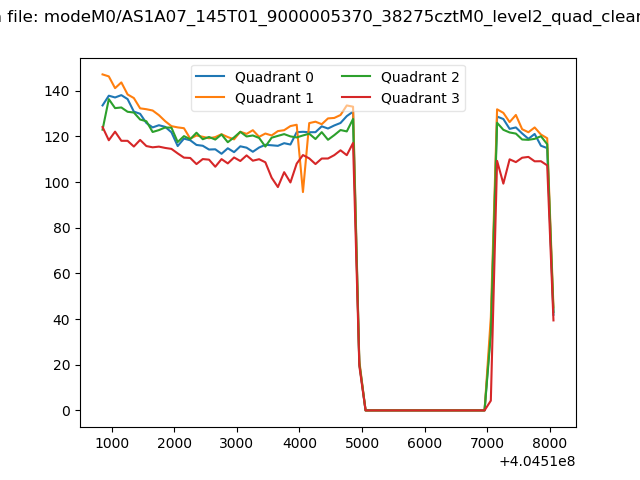 |
|
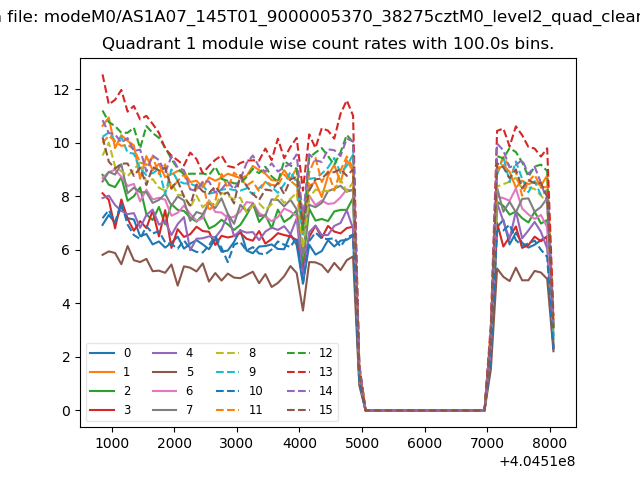
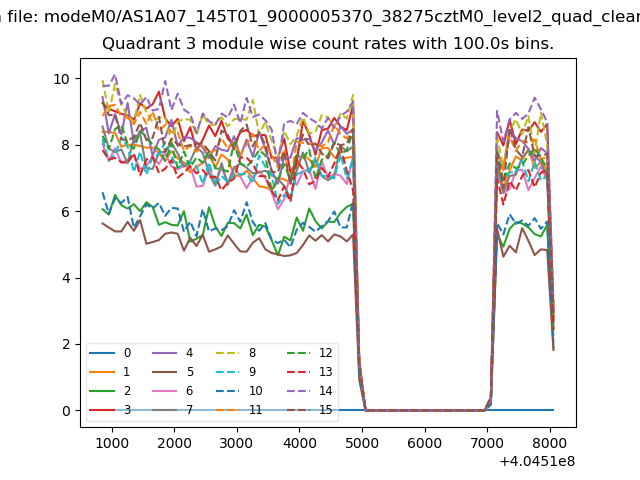
| Module-wise count rates for Quadrant A Data is divided into 100 sec bins |
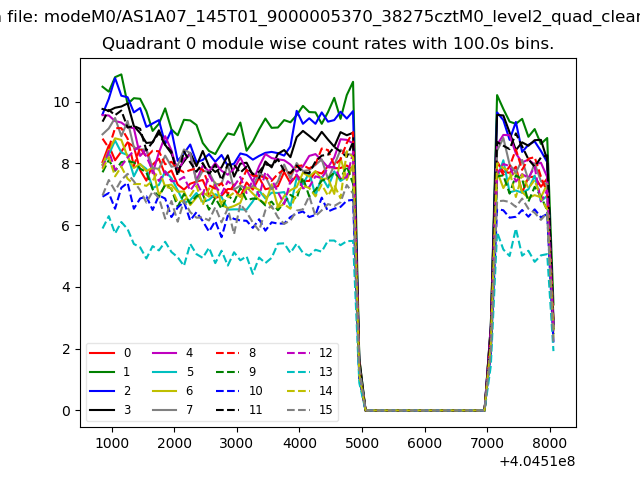 |
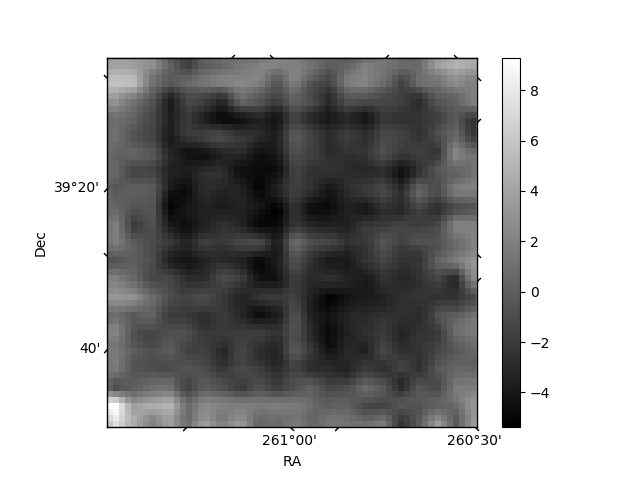 |
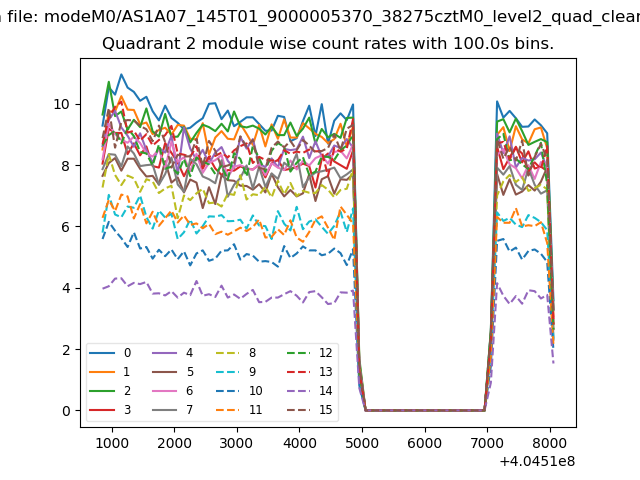
| Module-wise count rates for Quadrant B Data is divided into 100 sec bins |
 |
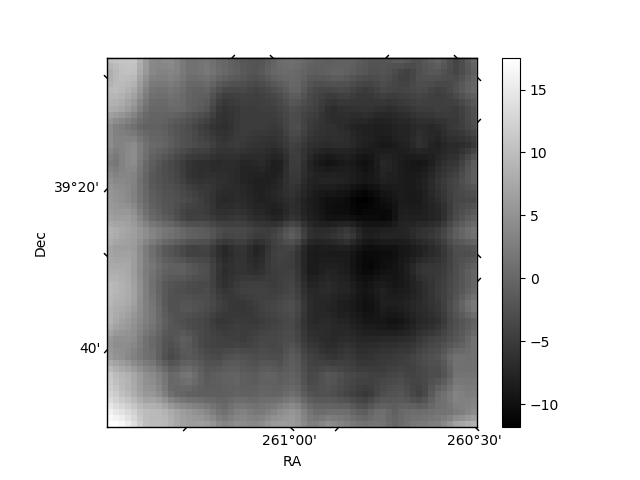 |
| Module-wise count rates for Quadrant C Data is divided into 100 sec bins |
 |
 |
| Module-wise count rates for Quadrant D Data is divided into 100 sec bins |
 |
 |
| Parameter | Plot |
|---|---|
| CZT HV Monitor | 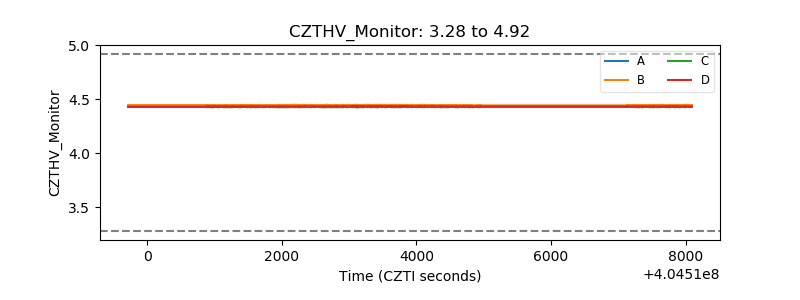 |
| D_VDD | 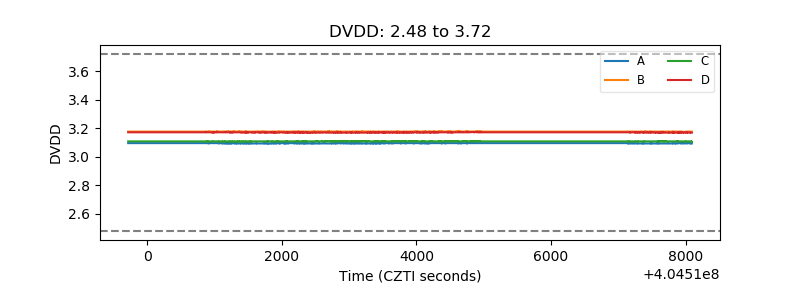 |
| Temperature 1 | 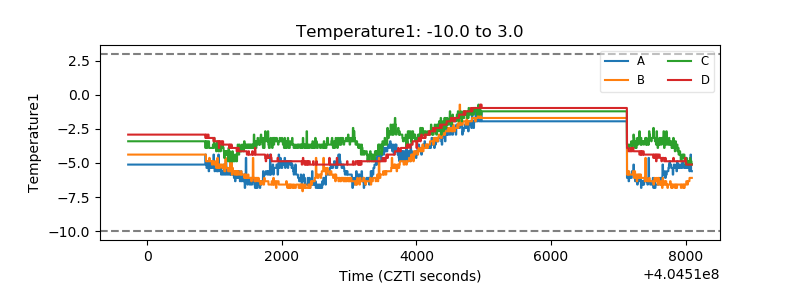 |
| Veto HV Monitor | 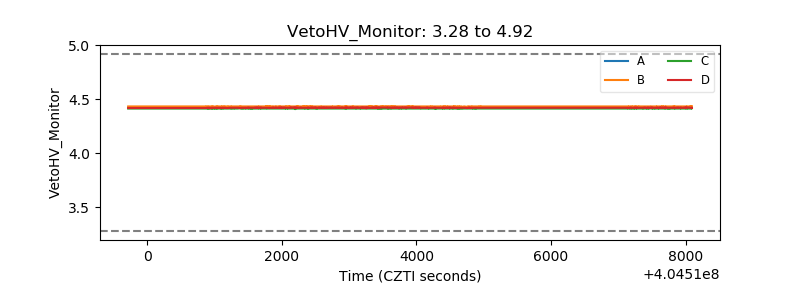 |
| Veto LLD | 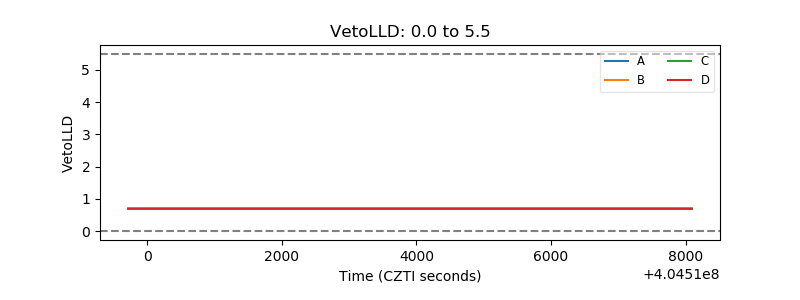 |
| Alpha Counter | 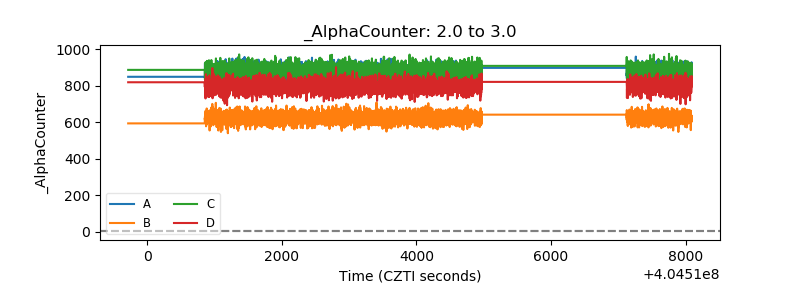 |
| _CPM_Rate | 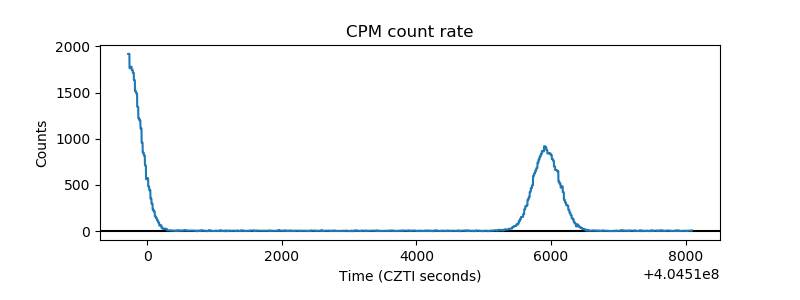 |
| CZT Counter | 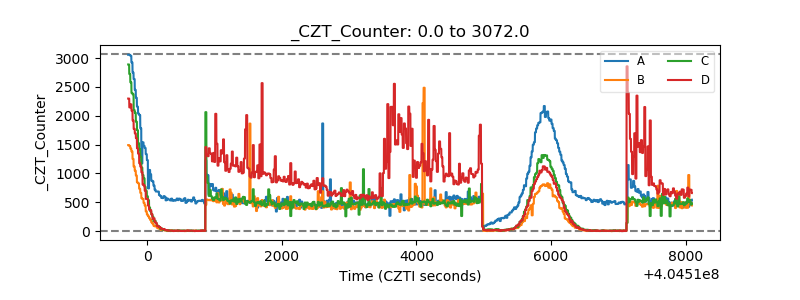 |
| +2.5 Volts monitor | 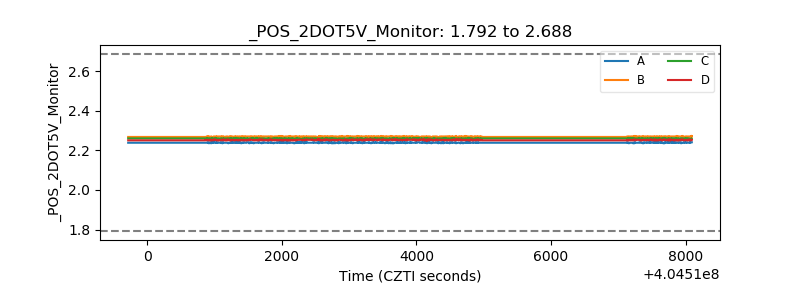 |
| +5 Volts monitor |  |
| _ROLL_ROT | 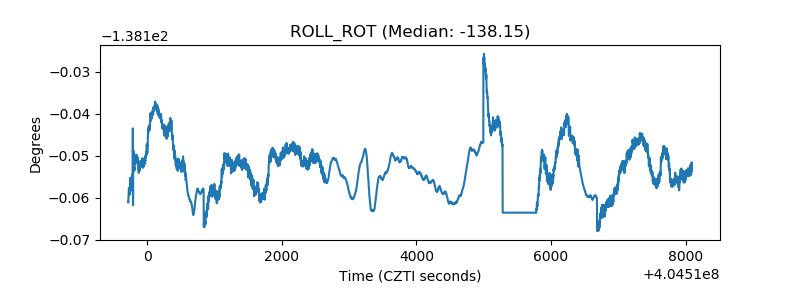 |
| _Roll_DEC | 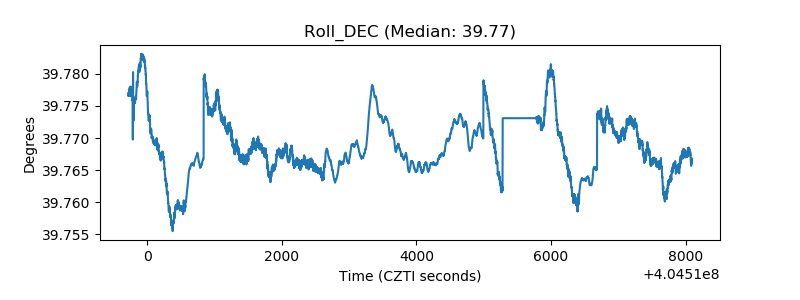 |
| _Roll_RA | 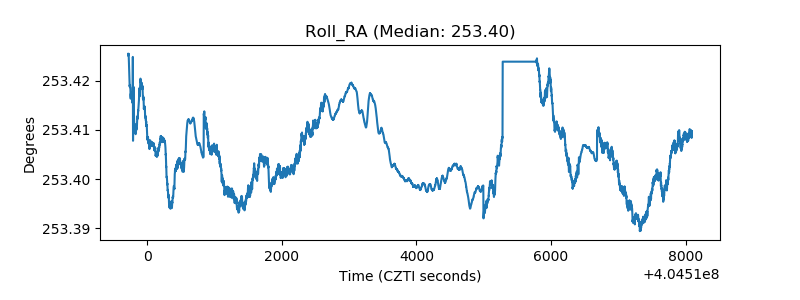 |
| Veto Counter | 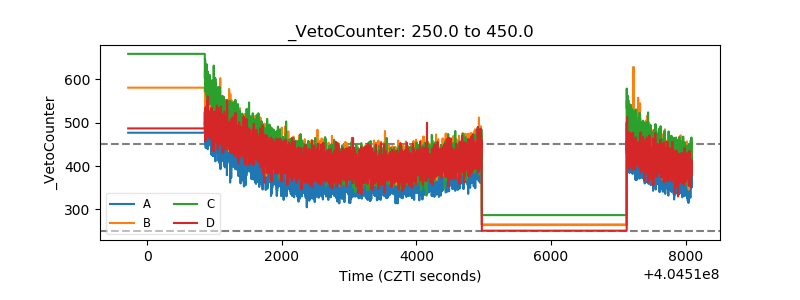 |