| Param | Original file | Final file |
|---|---|---|
| Filename | modeM0/AS1A07_145T01_9000005370_38276cztM0_level2.fits | modeM0/AS1A07_145T01_9000005370_38276cztM0_level2_quad_clean.evt |
| Size (bytes) | 363,839,040 | 89,614,080 |
| Size | 347.0 MB | 85.5 MB |
| Events in quadrant A | 2,704,398 | 605,648 |
| Events in quadrant B | 3,394,603 | 591,758 |
| Events in quadrant C | 2,590,756 | 605,695 |
| Events in quadrant D | 4,370,706 | 543,904 |
| Mode M9 | |||
|---|---|---|---|
| Quadrant | BADHDUFLAG | Total packets | Discarded packets |
| A | 0 | 33 | 0 |
| B | 0 | 33 | 0 |
| C | 0 | 33 | 0 |
| D | 0 | 34 | 0 |
| Mode SS | |||
|---|---|---|---|
| Quadrant | BADHDUFLAG | Total packets | Discarded packets |
| A | 0 | 106 | 0 |
| B | 0 | 106 | 0 |
| C | 0 | 106 | 0 |
| D | 0 | 106 | 0 |
| Mode M0 | |||
|---|---|---|---|
| Quadrant | BADHDUFLAG | Total packets | Discarded packets |
| A | 0 | 11186 | 3 |
| B | 0 | 13605 | 2 |
| C | 0 | 10822 | 2 |
| D | 0 | 16818 | 2 |
| Quadrant | Total seconds | Saturated seconds | Saturation percentage |
|---|---|---|---|
| A | 5236 | 13 | 0.248281% |
| B | 5236 | 314 | 5.996944% |
| C | 5236 | 10 | 0.190985% |
| D | 5236 | 205 | 3.915202% |
Noise dominated data is calculated using 1-second bins in cleaned event files. If a bin has >2000 counts, and if more than 50% of those come from <1% of pixels, then it is considered to be noise-dominated and hence unusable.
| Quadrant | # 1 sec bins | Bins with >0 counts | Bins with >2000 counts | High rate bins dominated by noise | Noise dominated (total time) | Noise dominated (detector-on time) | Marked lightcurve |
|---|---|---|---|---|---|---|---|
| A | 7270 | 5237 | 8 | 8 | 0.11% | 0.15% | 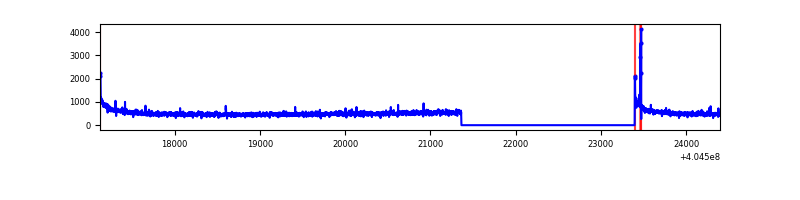 |
| B | 7270 | 5237 | 213 | 213 | 2.93% | 4.07% | 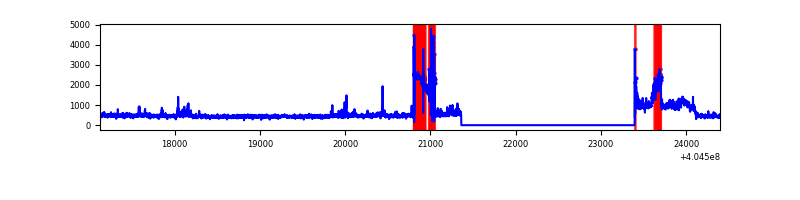 |
| C | 7270 | 5237 | 5 | 5 | 0.07% | 0.10% | 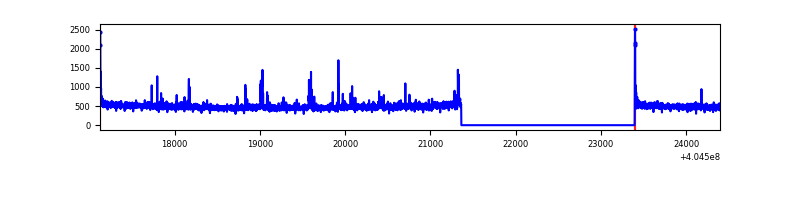 |
| D | 7270 | 5237 | 190 | 190 | 2.61% | 3.63% | 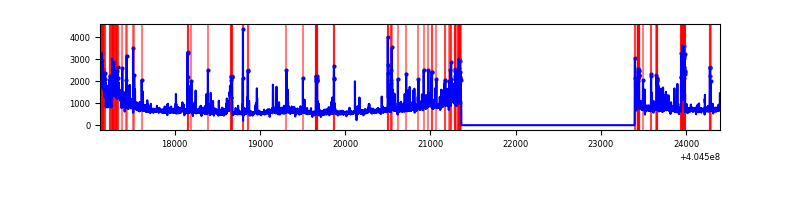 |
Top three noisy pixels from each quadrant. If the there are fewer than three noisy pixels in the level2.evt file, extra rows are filled as -1
| Pixel properties | Quadrant properties | ||||||
|---|---|---|---|---|---|---|---|
| Quadrant | DetID | PixID | Counts | Sigma | Mean | Median | Sigma |
| A | 10 | 83 | 367480 | 3112.64 | 587 | 574 | 117.9 |
| A | 12 | 189 | 26874 | 223.12 | 587 | 574 | 117.9 |
| A | 9 | 143 | 22188 | 183.36 | 587 | 574 | 117.9 |
| B | 5 | 184 | 1010168 | 9452.41 | 561 | 547 | 106.8 |
| B | 0 | 189 | 57639 | 534.51 | 561 | 547 | 106.8 |
| B | 4 | 232 | 57617 | 534.31 | 561 | 547 | 106.8 |
| C | 15 | 214 | 221158 | 1644.31 | 578 | 585 | 134.1 |
| C | 15 | 208 | 74835 | 553.51 | 578 | 585 | 134.1 |
| C | 0 | 10 | 25459 | 185.43 | 578 | 585 | 134.1 |
| D | 10 | 203 | 1096413 | 7958.01 | 567 | 551 | 137.7 |
| D | 12 | 235 | 318831 | 2311.31 | 567 | 551 | 137.7 |
| D | 2 | 250 | 207394 | 1502.07 | 567 | 551 | 137.7 |
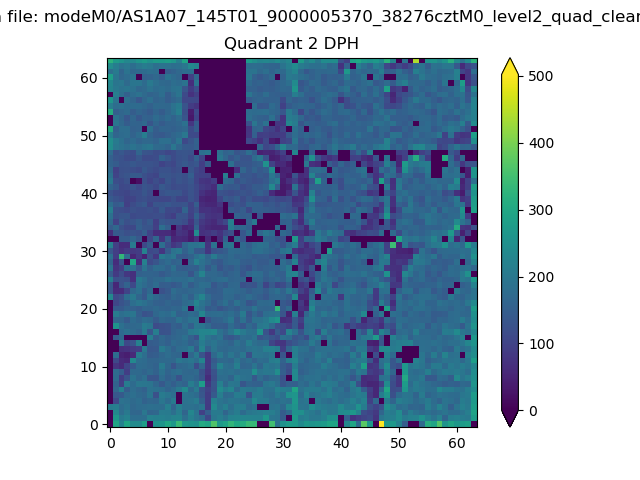
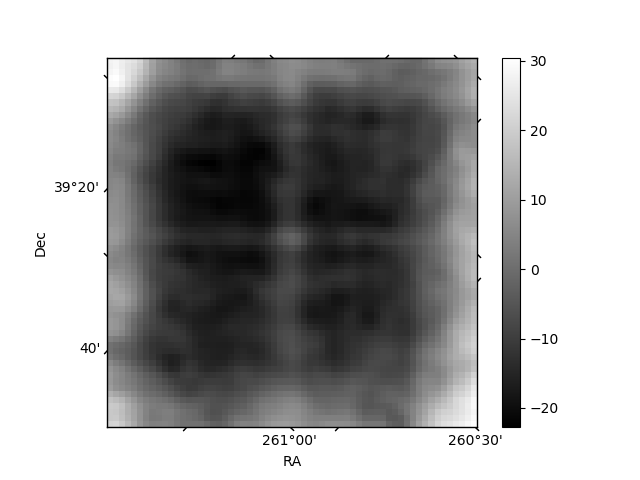
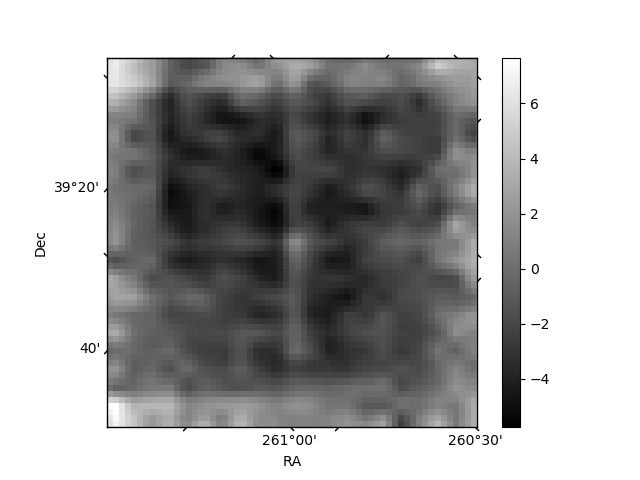
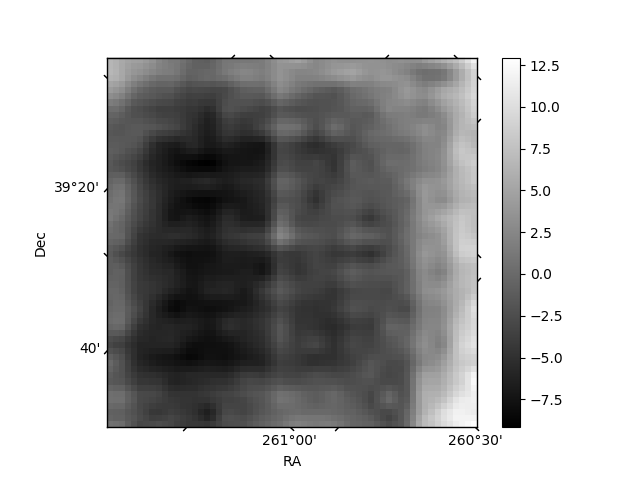
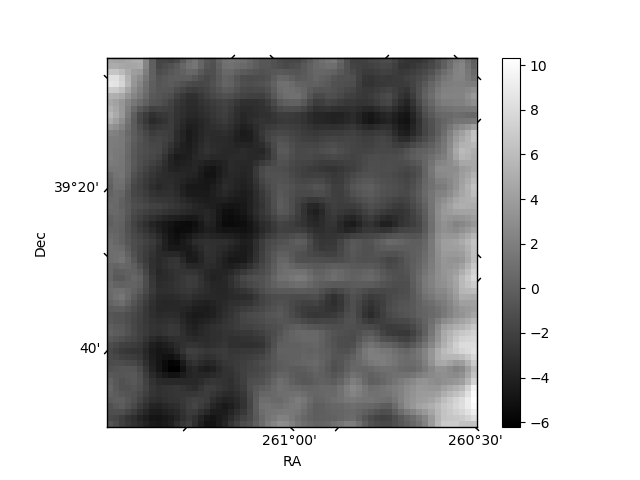
Histogram calculated using DETX and DETY for each event in the final _common_clean file
| Quadrant A | 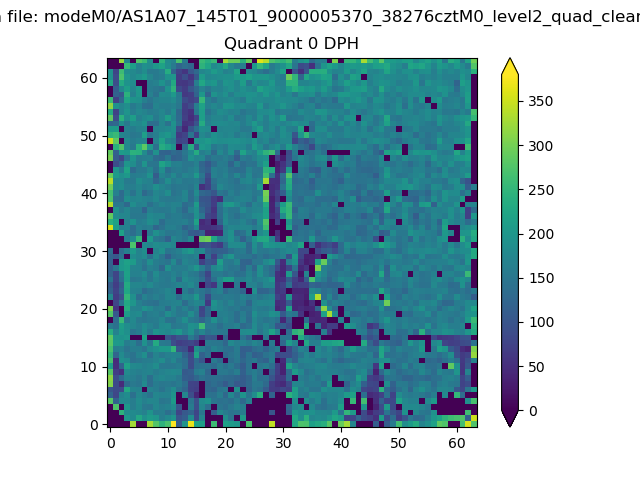 |
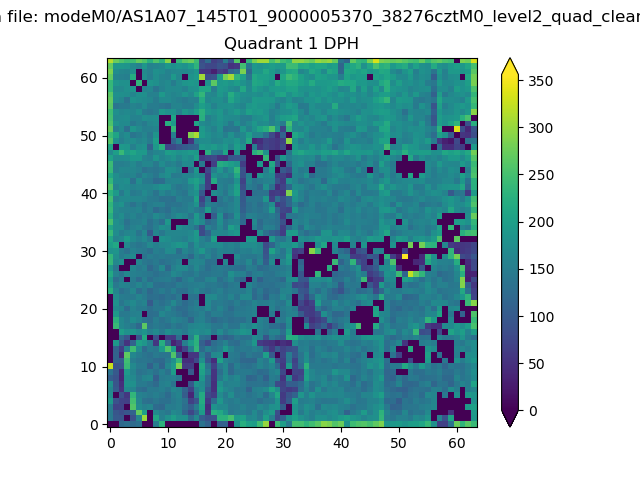 |
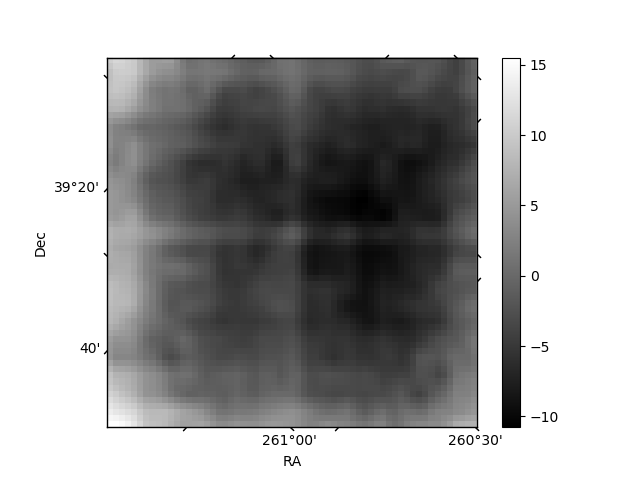
Quadrant B |
|---|---|---|---|
| Quadrant D | 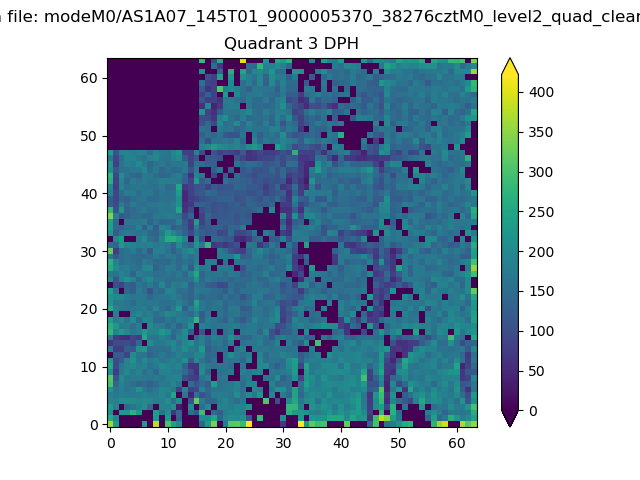 |
 |
Quadrant C |
| Plot type | Count rate plots | Images |
|---|---|---|
| Comparison with Poisson distribution Blue bars denote a histogram of data divided into 1 sec bins. Red curve is a Poisson curve with rate = median count rate of data. |
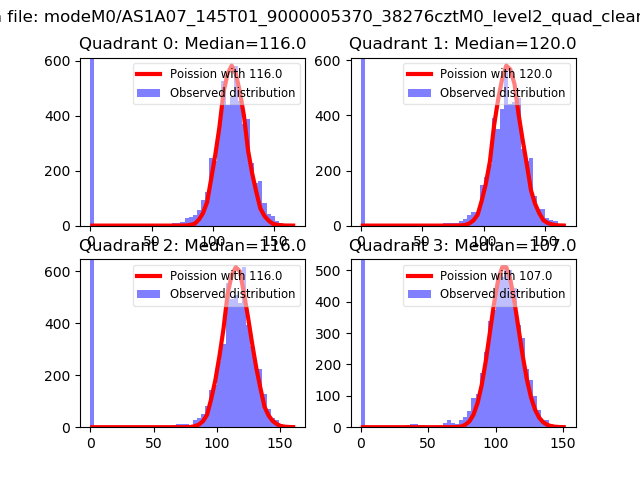 |
 |
| Quadrant-wise count rates Data is divided into 100 sec bins |
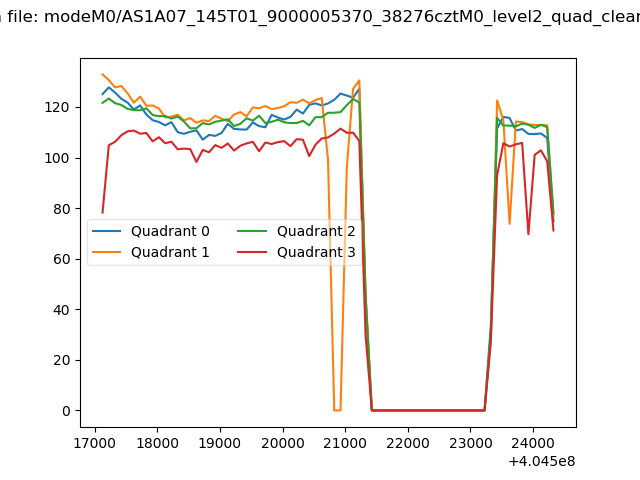 |
|
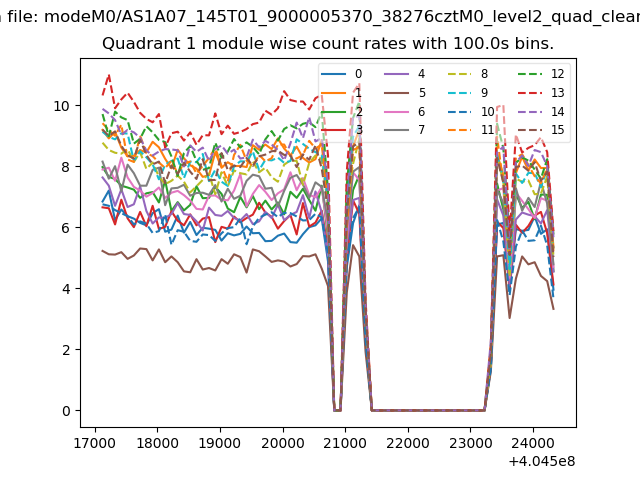
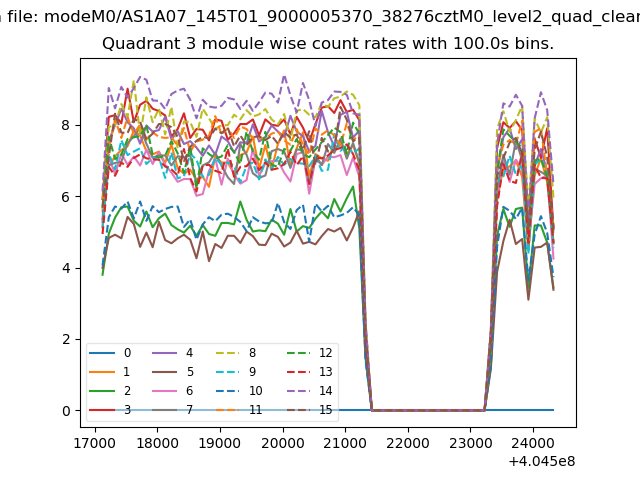
| Module-wise count rates for Quadrant A Data is divided into 100 sec bins |
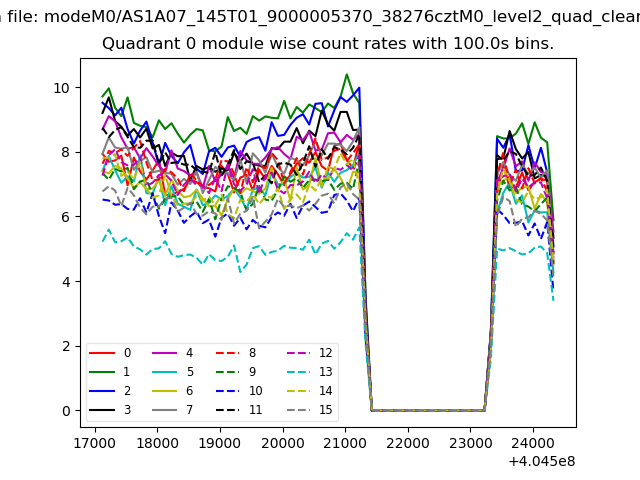 |
 |
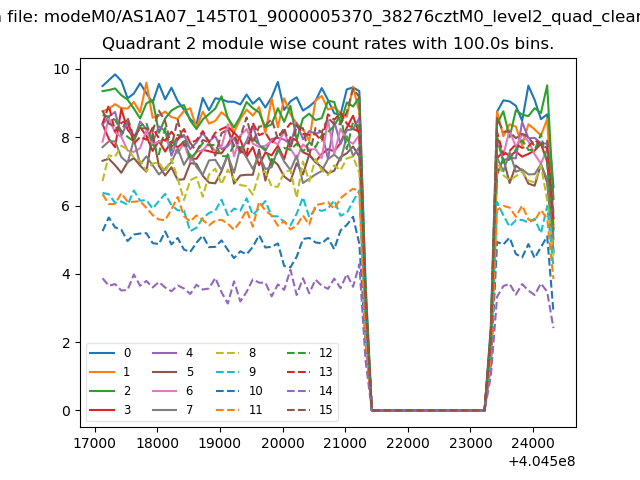
| Module-wise count rates for Quadrant B Data is divided into 100 sec bins |
 |
 |
| Module-wise count rates for Quadrant C Data is divided into 100 sec bins |
 |
 |
| Module-wise count rates for Quadrant D Data is divided into 100 sec bins |
 |
 |
| Parameter | Plot |
|---|---|
| CZT HV Monitor | 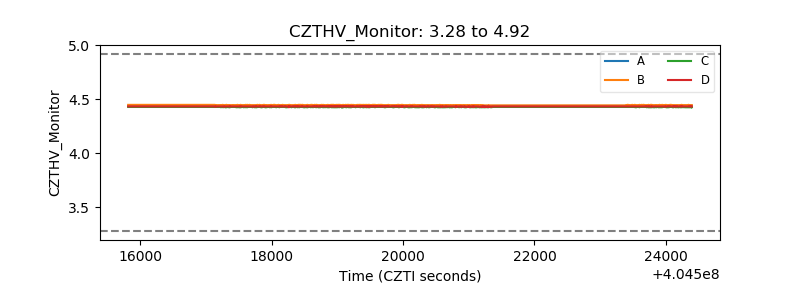 |
| D_VDD | 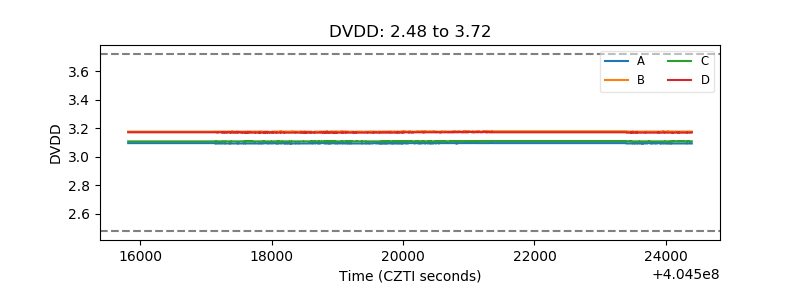 |
| Temperature 1 | 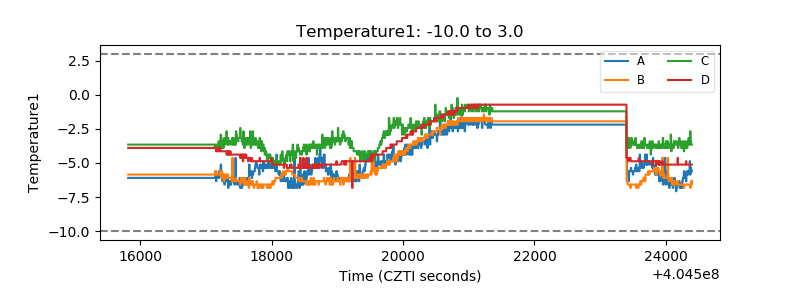 |
| Veto HV Monitor |  |
| Veto LLD | 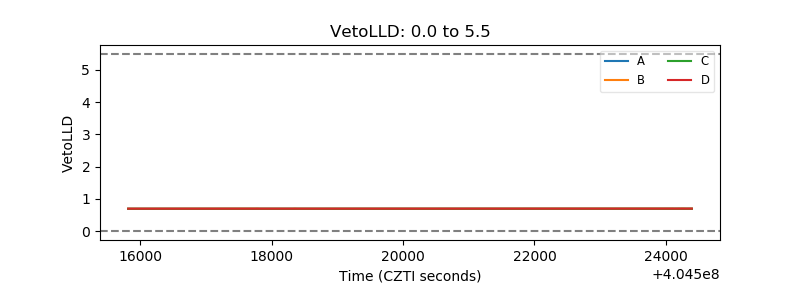 |
| Alpha Counter | 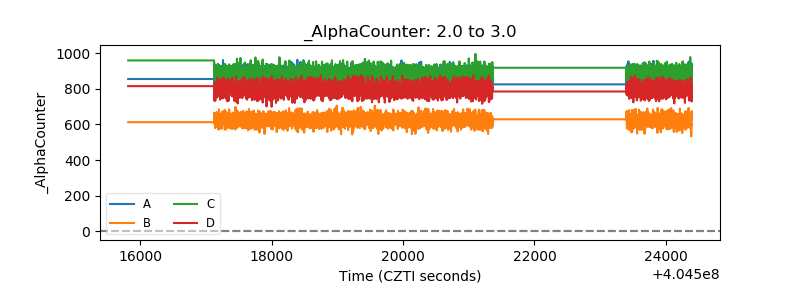 |
| _CPM_Rate | 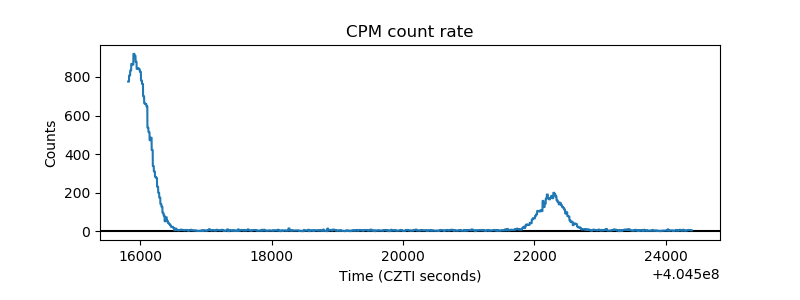 |
| CZT Counter | 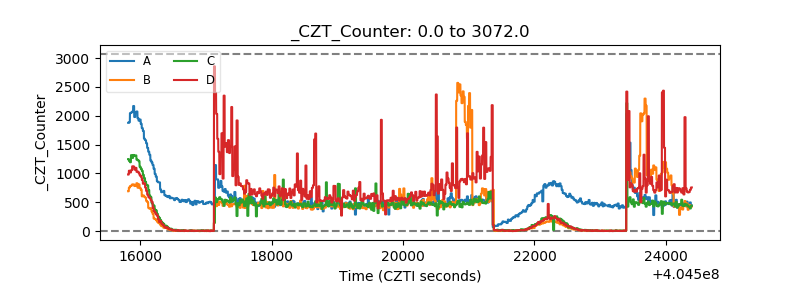 |
| +2.5 Volts monitor | 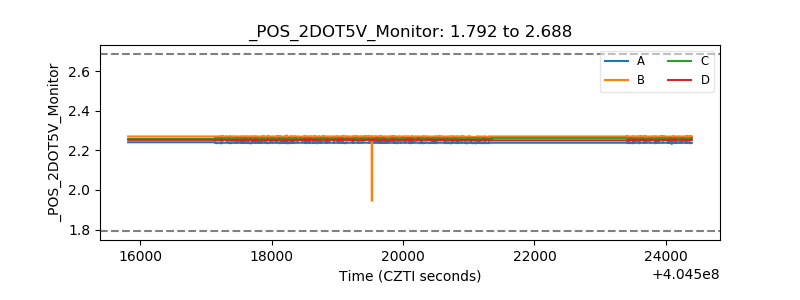 |
| +5 Volts monitor | 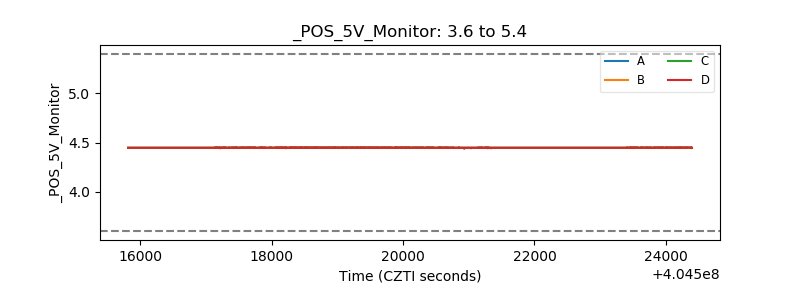 |
| _ROLL_ROT | 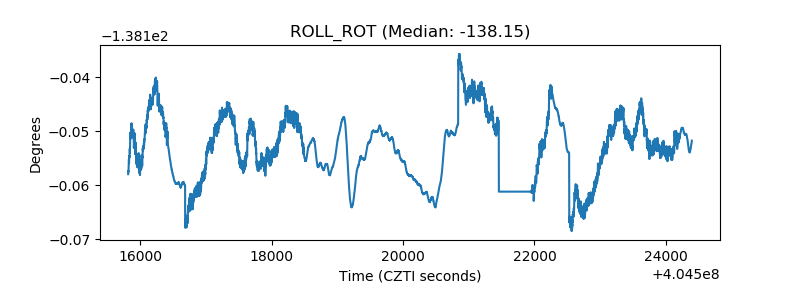 |
| _Roll_DEC | 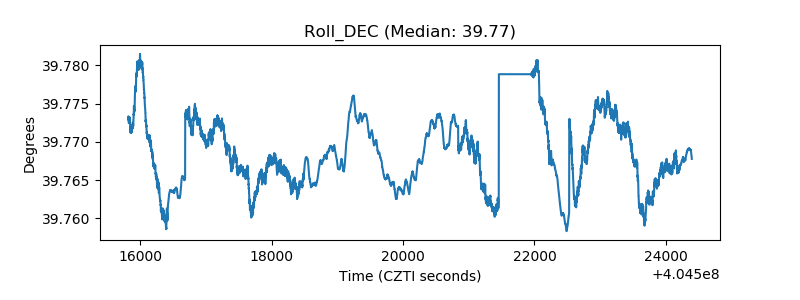 |
| _Roll_RA | 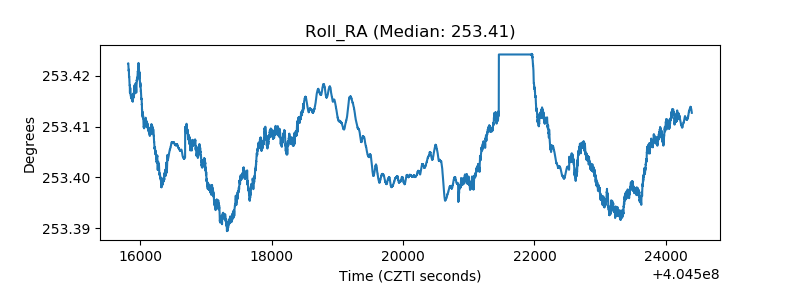 |
| Veto Counter | 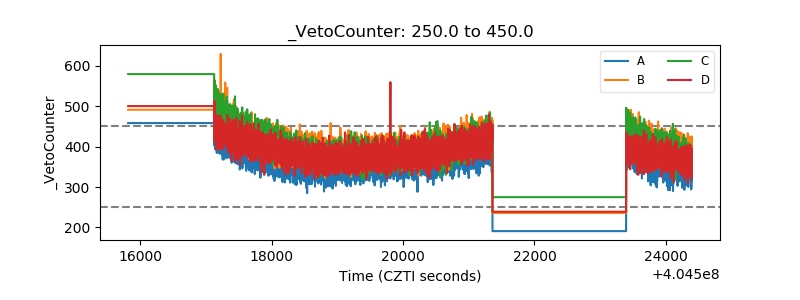 |