| Param | Original file | Final file |
|---|---|---|
| Filename | modeM0/AS1A07_145T01_9000005370_38277cztM0_level2.fits | modeM0/AS1A07_145T01_9000005370_38277cztM0_level2_quad_clean.evt |
| Size (bytes) | 371,370,240 | 92,286,720 |
| Size | 354.2 MB | 88.0 MB |
| Events in quadrant A | 2,802,954 | 615,441 |
| Events in quadrant B | 3,103,733 | 626,940 |
| Events in quadrant C | 2,609,259 | 614,186 |
| Events in quadrant D | 4,805,404 | 554,655 |
| Mode M9 | |||
|---|---|---|---|
| Quadrant | BADHDUFLAG | Total packets | Discarded packets |
| A | 0 | 30 | 0 |
| B | 0 | 30 | 0 |
| C | 0 | 30 | 0 |
| D | 0 | 31 | 0 |
| Mode SS | |||
|---|---|---|---|
| Quadrant | BADHDUFLAG | Total packets | Discarded packets |
| A | 0 | 112 | 0 |
| B | 0 | 112 | 0 |
| C | 0 | 112 | 0 |
| D | 0 | 112 | 0 |
| Mode M0 | |||
|---|---|---|---|
| Quadrant | BADHDUFLAG | Total packets | Discarded packets |
| A | 0 | 11621 | 3 |
| B | 0 | 13024 | 2 |
| C | 0 | 11096 | 2 |
| D | 0 | 18749 | 2 |
| Quadrant | Total seconds | Saturated seconds | Saturation percentage |
|---|---|---|---|
| A | 5474 | 15 | 0.274023% |
| B | 5474 | 85 | 1.552795% |
| C | 5474 | 9 | 0.164414% |
| D | 5474 | 174 | 3.178663% |
Noise dominated data is calculated using 1-second bins in cleaned event files. If a bin has >2000 counts, and if more than 50% of those come from <1% of pixels, then it is considered to be noise-dominated and hence unusable.
| Quadrant | # 1 sec bins | Bins with >0 counts | Bins with >2000 counts | High rate bins dominated by noise | Noise dominated (total time) | Noise dominated (detector-on time) | Marked lightcurve |
|---|---|---|---|---|---|---|---|
| A | 7176 | 5475 | 10 | 10 | 0.14% | 0.18% | 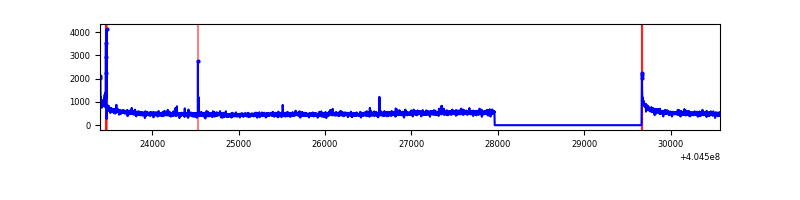 |
| B | 7176 | 5475 | 47 | 47 | 0.65% | 0.86% | 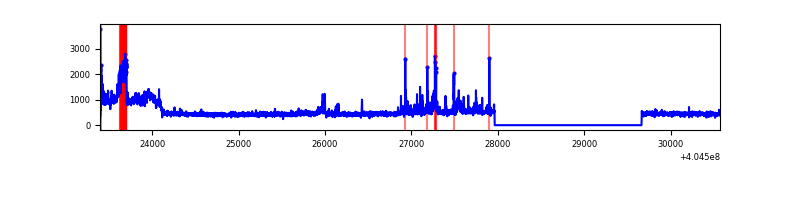 |
| C | 7176 | 5475 | 5 | 5 | 0.07% | 0.09% | 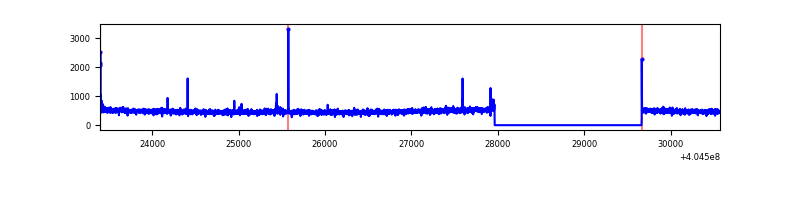 |
| D | 7176 | 5475 | 171 | 171 | 2.38% | 3.12% | 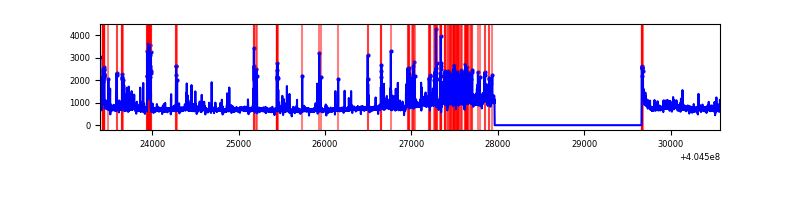 |
Top three noisy pixels from each quadrant. If the there are fewer than three noisy pixels in the level2.evt file, extra rows are filled as -1
| Pixel properties | Quadrant properties | ||||||
|---|---|---|---|---|---|---|---|
| Quadrant | DetID | PixID | Counts | Sigma | Mean | Median | Sigma |
| A | 10 | 83 | 374666 | 3023.78 | 607 | 595 | 123.7 |
| A | 12 | 189 | 34812 | 276.59 | 607 | 595 | 123.7 |
| A | 9 | 143 | 28626 | 226.59 | 607 | 595 | 123.7 |
| B | 5 | 184 | 472700 | 4021.49 | 605 | 589 | 117.4 |
| B | 0 | 229 | 73595 | 621.87 | 605 | 589 | 117.4 |
| B | 5 | 172 | 55360 | 466.54 | 605 | 589 | 117.4 |
| C | 15 | 214 | 229758 | 1654.77 | 596 | 601 | 138.5 |
| C | 15 | 208 | 23818 | 167.65 | 596 | 601 | 138.5 |
| C | 0 | 10 | 17919 | 125.06 | 596 | 601 | 138.5 |
| D | 10 | 203 | 1548016 | 10749.37 | 588 | 570 | 144.0 |
| D | 2 | 16 | 305903 | 2121.0 | 588 | 570 | 144.0 |
| D | 12 | 235 | 202728 | 1404.3 | 588 | 570 | 144.0 |
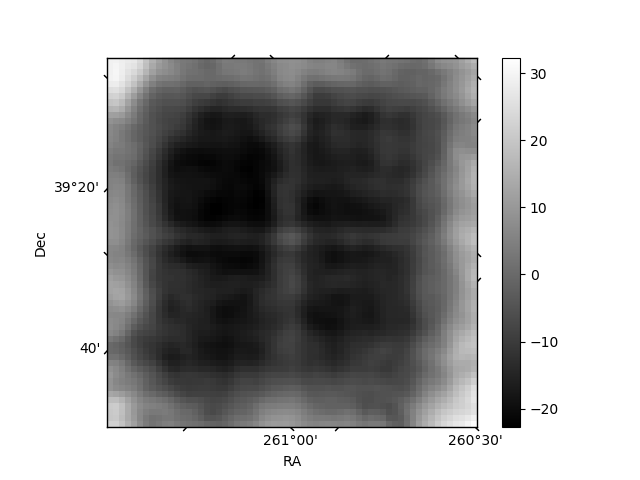
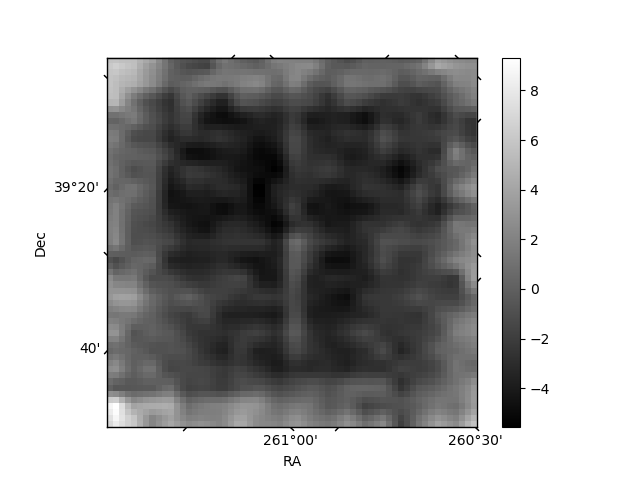
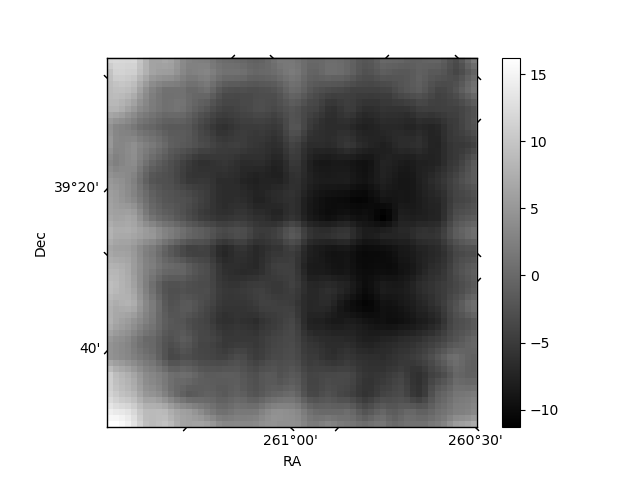
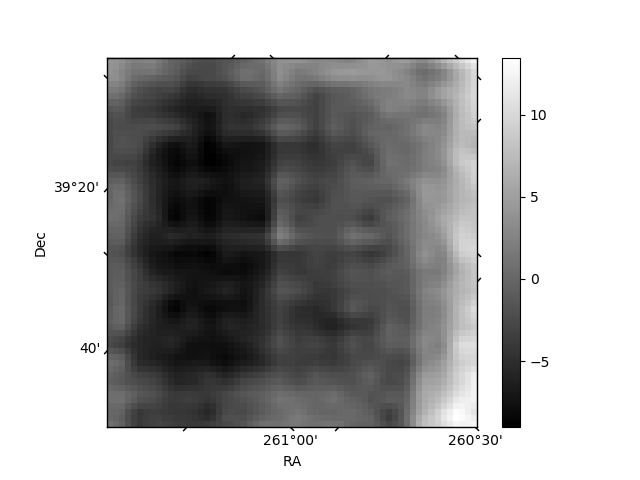
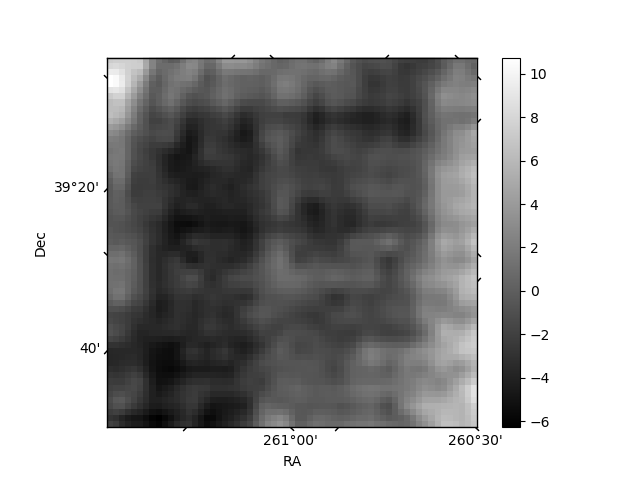
Histogram calculated using DETX and DETY for each event in the final _common_clean file
| Quadrant A | 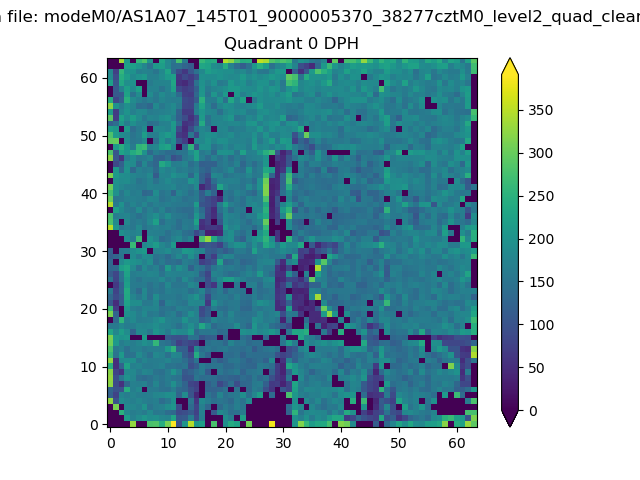 |
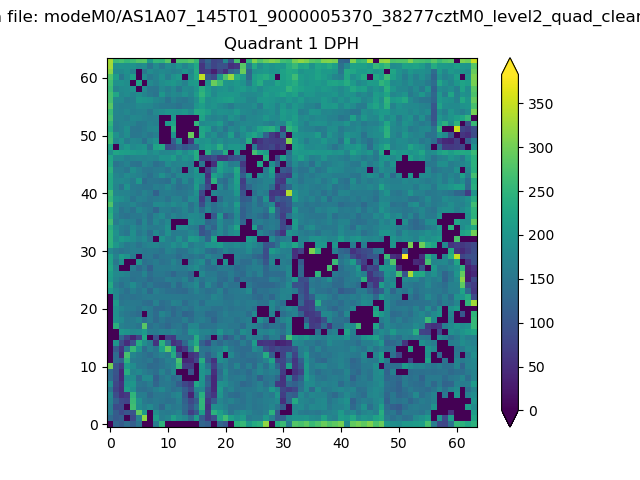 |
Quadrant B |
|---|---|---|---|
| Quadrant D |  |
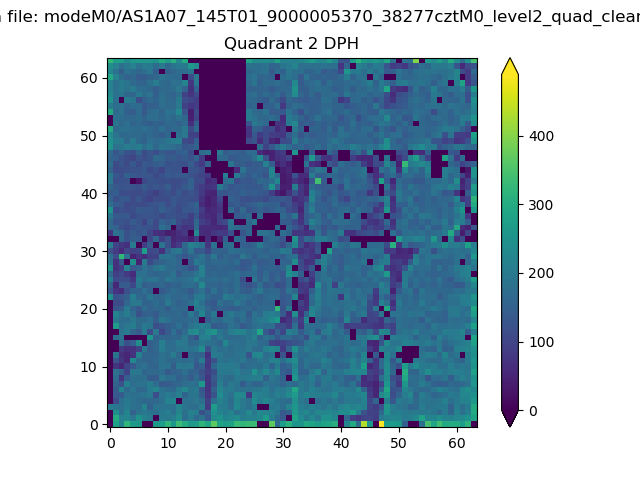 |
Quadrant C |
| Plot type | Count rate plots | Images |
|---|---|---|
| Comparison with Poisson distribution Blue bars denote a histogram of data divided into 1 sec bins. Red curve is a Poisson curve with rate = median count rate of data. |
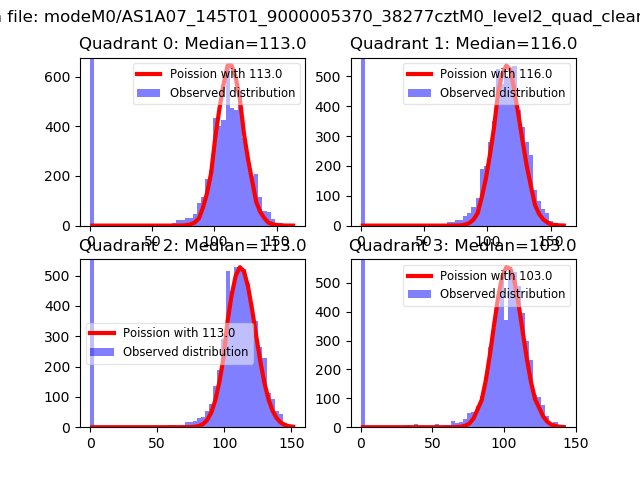 |
 |
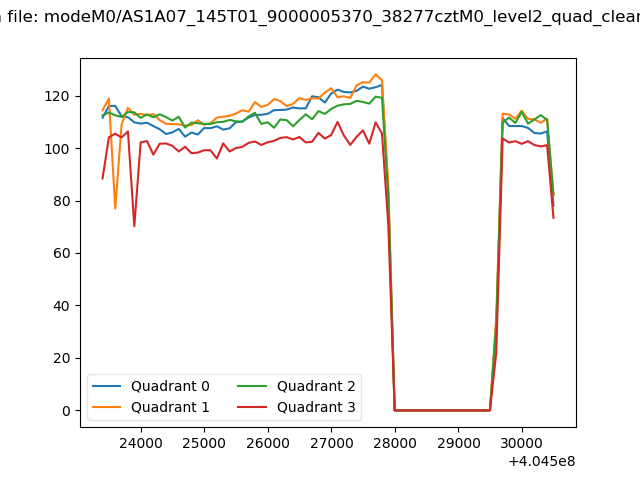
| Quadrant-wise count rates Data is divided into 100 sec bins |
 |
|
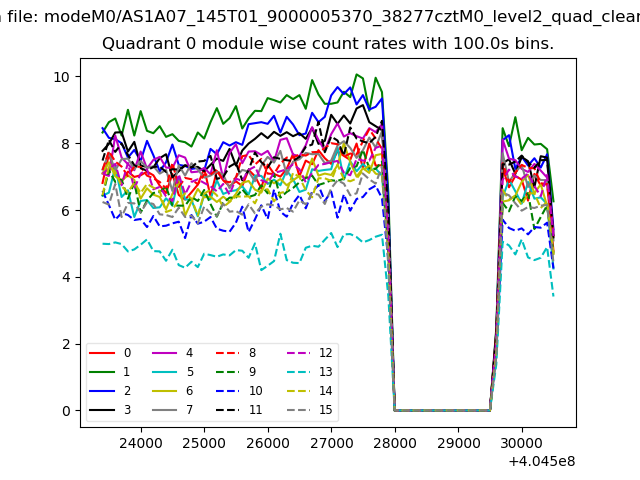
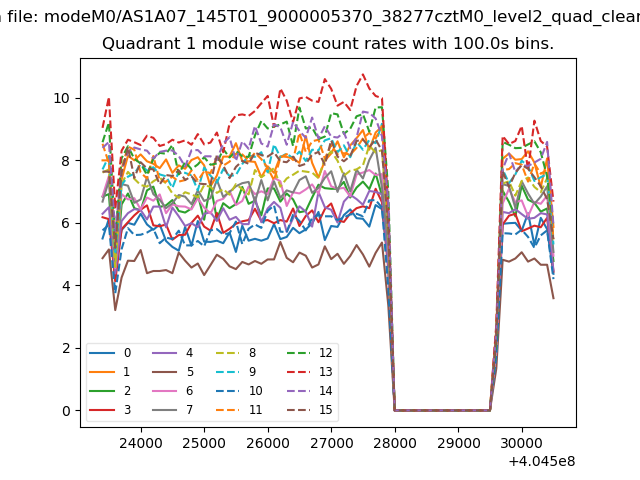
| Module-wise count rates for Quadrant A Data is divided into 100 sec bins |
 |
 |
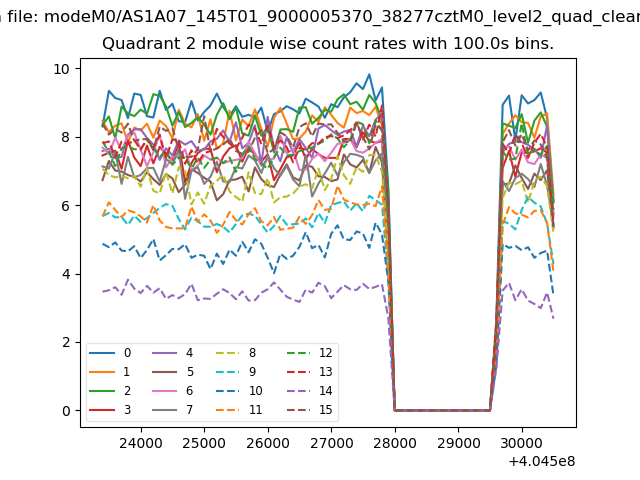
| Module-wise count rates for Quadrant B Data is divided into 100 sec bins |
 |
 |
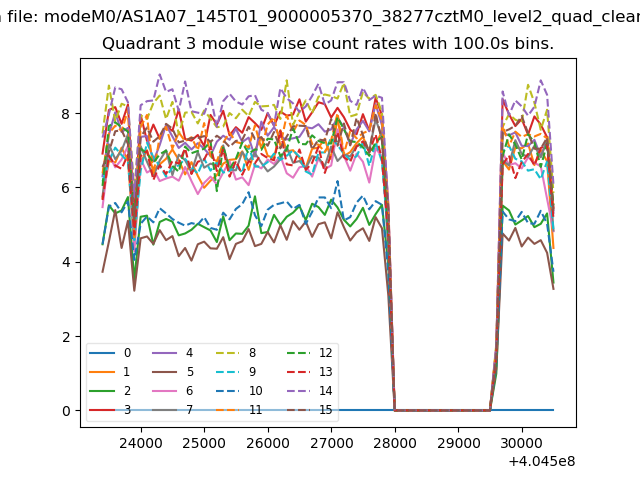
| Module-wise count rates for Quadrant C Data is divided into 100 sec bins |
 |
 |
| Module-wise count rates for Quadrant D Data is divided into 100 sec bins |
 |
 |
| Parameter | Plot |
|---|---|
| CZT HV Monitor | 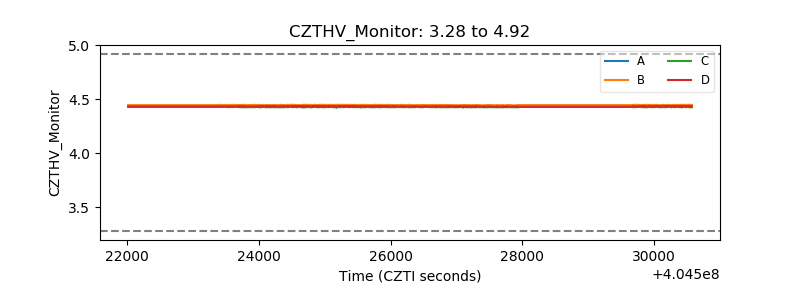 |
| D_VDD | 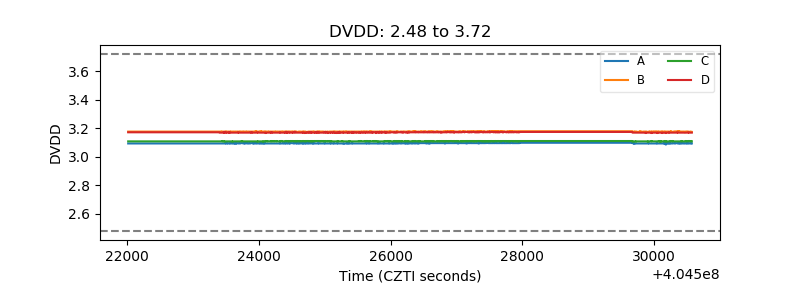 |
| Temperature 1 | 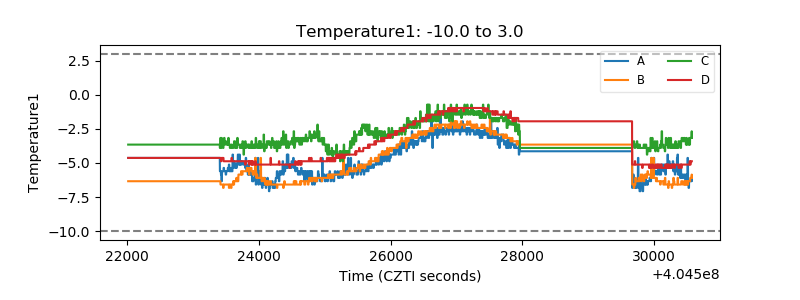 |
| Veto HV Monitor | 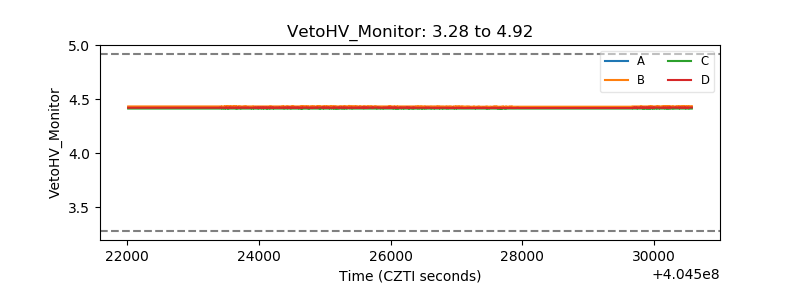 |
| Veto LLD | 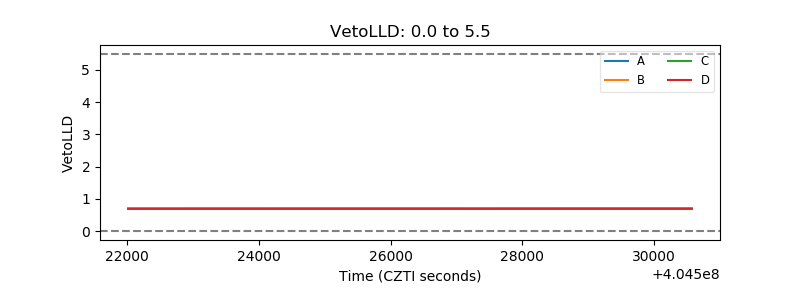 |
| Alpha Counter | 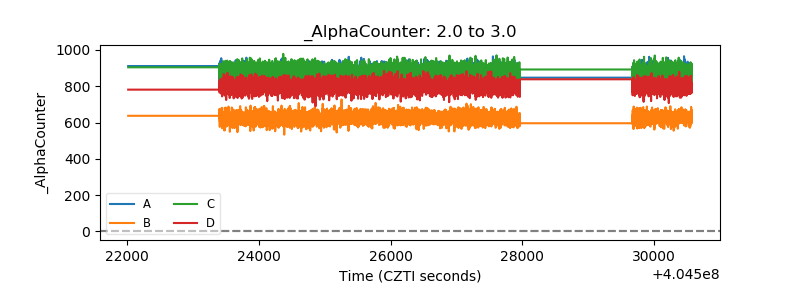 |
| _CPM_Rate | 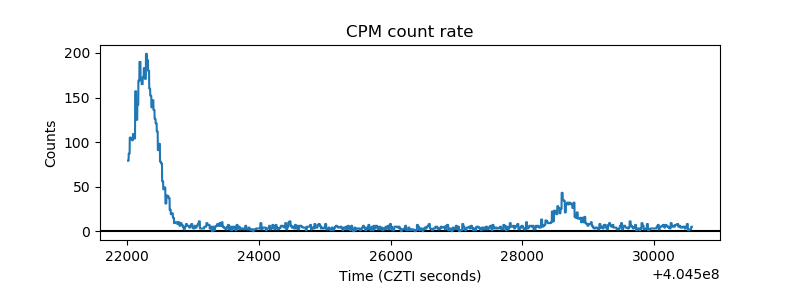 |
| CZT Counter | 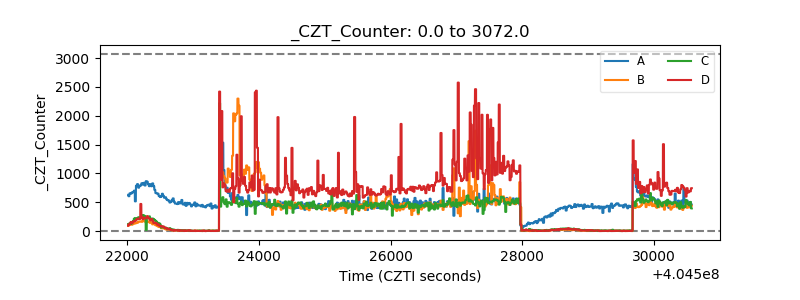 |
| +2.5 Volts monitor | 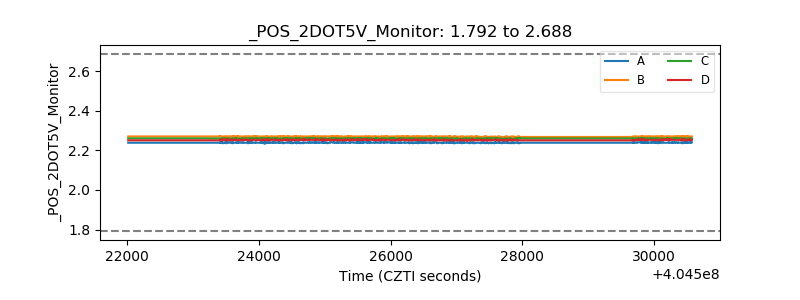 |
| +5 Volts monitor | 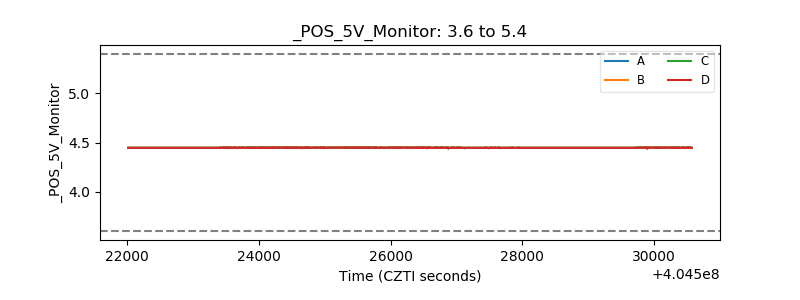 |
| _ROLL_ROT | 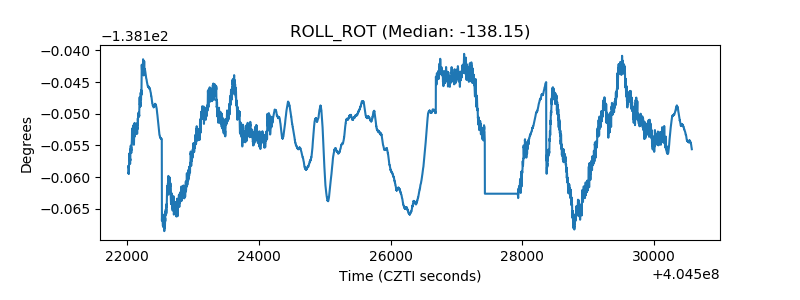 |
| _Roll_DEC | 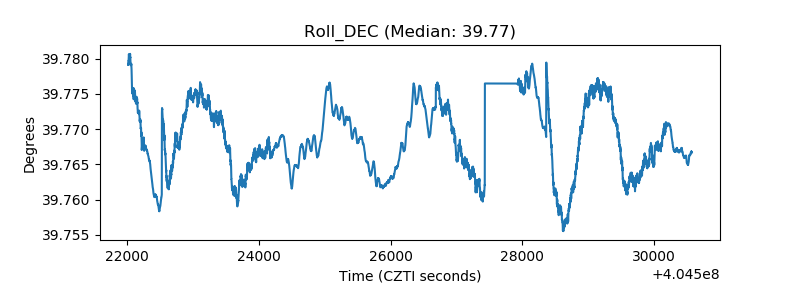 |
| _Roll_RA | 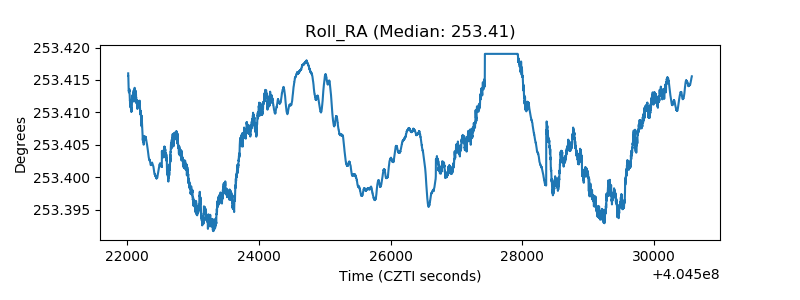 |
| Veto Counter | 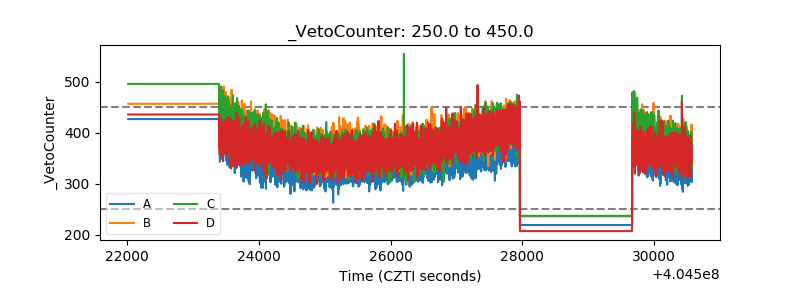 |