| Param | Original file | Final file |
|---|---|---|
| Filename | modeM0/AS1A07_145T01_9000005370_38278cztM0_level2.fits | modeM0/AS1A07_145T01_9000005370_38278cztM0_level2_quad_clean.evt |
| Size (bytes) | 410,284,800 | 97,038,720 |
| Size | 391.3 MB | 92.5 MB |
| Events in quadrant A | 2,986,331 | 644,597 |
| Events in quadrant B | 2,691,847 | 665,206 |
| Events in quadrant C | 3,825,086 | 633,707 |
| Events in quadrant D | 5,232,620 | 588,375 |
| Mode M9 | |||
|---|---|---|---|
| Quadrant | BADHDUFLAG | Total packets | Discarded packets |
| A | 0 | 31 | 0 |
| B | 0 | 31 | 0 |
| C | 0 | 31 | 0 |
| D | 0 | 31 | 0 |
| Mode SS | |||
|---|---|---|---|
| Quadrant | BADHDUFLAG | Total packets | Discarded packets |
| A | 0 | 120 | 0 |
| B | 0 | 120 | 0 |
| C | 0 | 120 | 0 |
| D | 0 | 120 | 0 |
| Mode M0 | |||
|---|---|---|---|
| Quadrant | BADHDUFLAG | Total packets | Discarded packets |
| A | 0 | 12328 | 3 |
| B | 0 | 11927 | 2 |
| C | 0 | 14958 | 2 |
| D | 0 | 20098 | 2 |
| Quadrant | Total seconds | Saturated seconds | Saturation percentage |
|---|---|---|---|
| A | 5814 | 10 | 0.171999% |
| B | 5814 | 13 | 0.223598% |
| C | 5814 | 135 | 2.321981% |
| D | 5814 | 97 | 1.668387% |
Noise dominated data is calculated using 1-second bins in cleaned event files. If a bin has >2000 counts, and if more than 50% of those come from <1% of pixels, then it is considered to be noise-dominated and hence unusable.
| Quadrant | # 1 sec bins | Bins with >0 counts | Bins with >2000 counts | High rate bins dominated by noise | Noise dominated (total time) | Noise dominated (detector-on time) | Marked lightcurve |
|---|---|---|---|---|---|---|---|
| A | 8918 | 5816 | 6 | 6 | 0.07% | 0.10% | 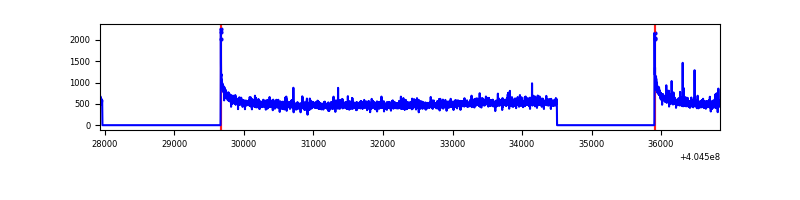 |
| B | 8918 | 5816 | 3 | 3 | 0.03% | 0.05% | 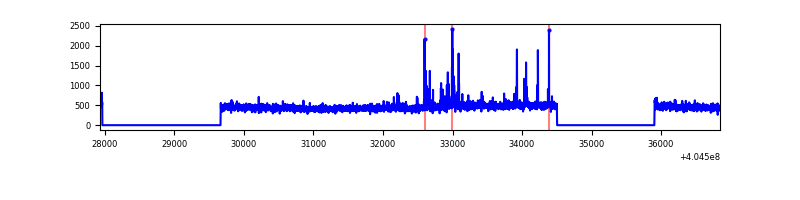 |
| C | 8918 | 5816 | 136 | 136 | 1.53% | 2.34% | 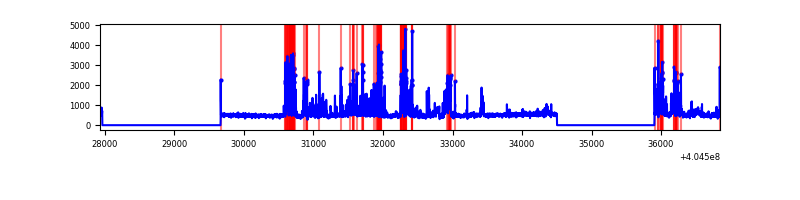 |
| D | 8918 | 5816 | 74 | 74 | 0.83% | 1.27% | 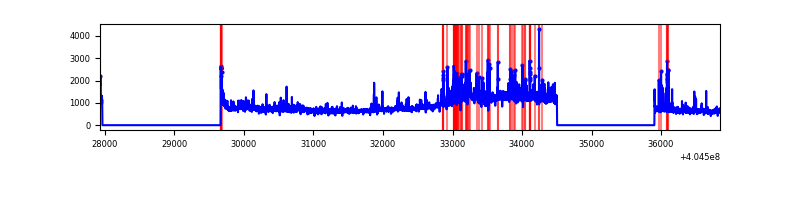 |
Top three noisy pixels from each quadrant. If the there are fewer than three noisy pixels in the level2.evt file, extra rows are filled as -1
| Pixel properties | Quadrant properties | ||||||
|---|---|---|---|---|---|---|---|
| Quadrant | DetID | PixID | Counts | Sigma | Mean | Median | Sigma |
| A | 10 | 83 | 409504 | 3101.43 | 647 | 633 | 131.8 |
| A | 12 | 189 | 37658 | 280.85 | 647 | 633 | 131.8 |
| A | 13 | 6 | 16259 | 118.53 | 647 | 633 | 131.8 |
| B | 5 | 172 | 77789 | 615.53 | 647 | 629 | 125.4 |
| B | 0 | 230 | 19925 | 153.93 | 647 | 629 | 125.4 |
| B | 12 | 111 | 15812 | 121.12 | 647 | 629 | 125.4 |
| C | 9 | 236 | 554842 | 3772.5 | 629 | 633 | 146.9 |
| C | 2 | 16 | 489276 | 3326.19 | 629 | 633 | 146.9 |
| C | 15 | 214 | 243836 | 1655.48 | 629 | 633 | 146.9 |
| D | 10 | 203 | 1920238 | 12467.62 | 628 | 611 | 154.0 |
| D | 12 | 235 | 467435 | 3031.93 | 628 | 611 | 154.0 |
| D | 1 | 20 | 87654 | 565.33 | 628 | 611 | 154.0 |
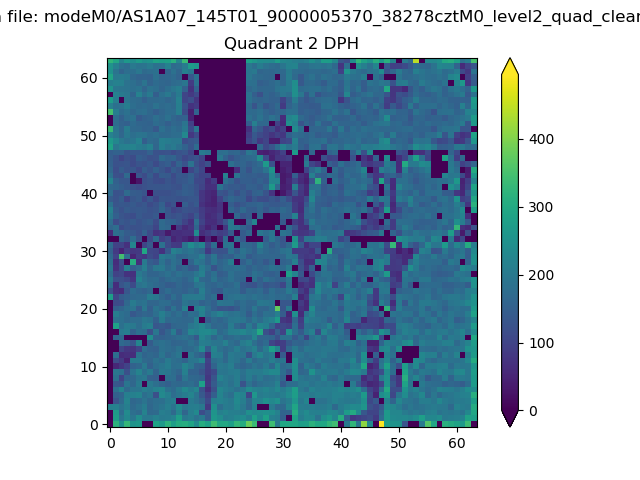
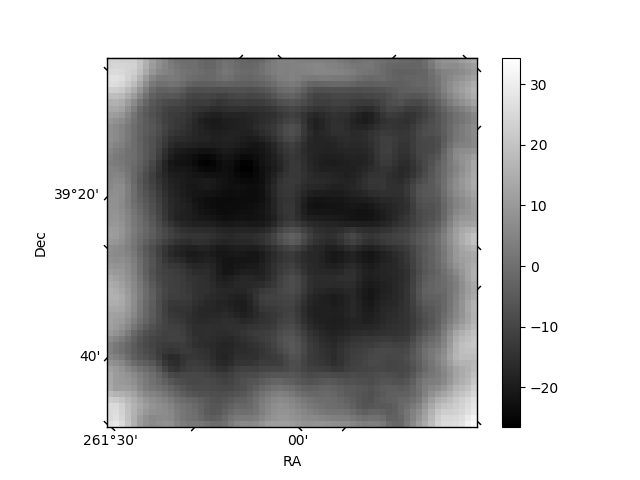
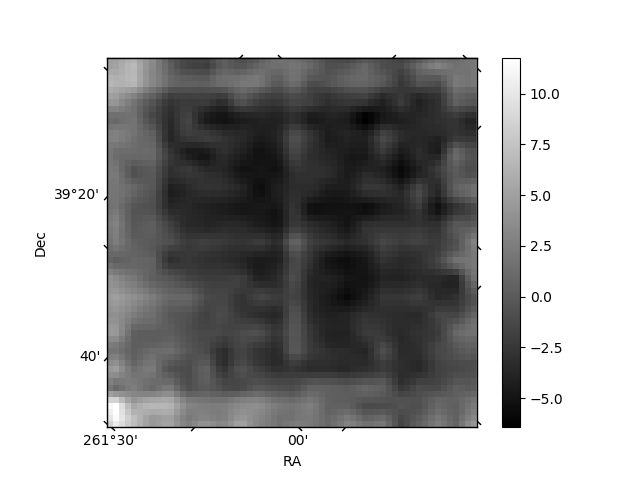
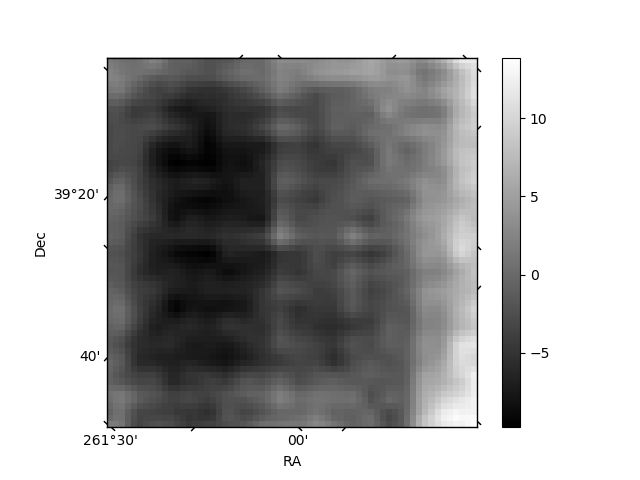
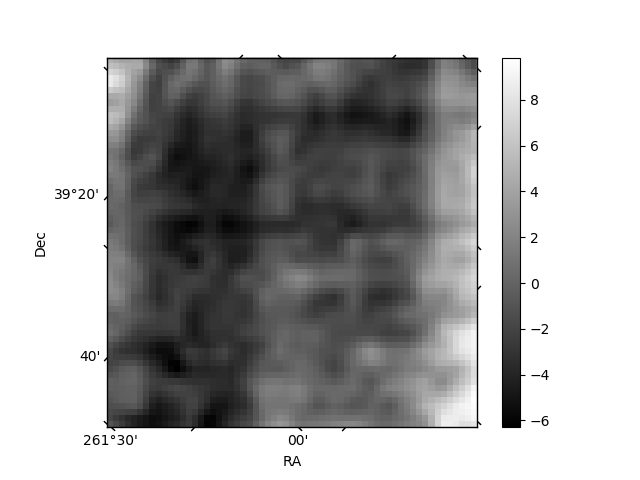
Histogram calculated using DETX and DETY for each event in the final _common_clean file
| Quadrant A | 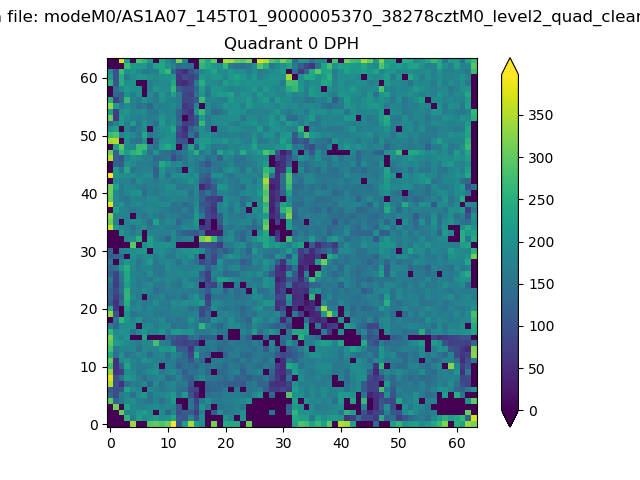 |
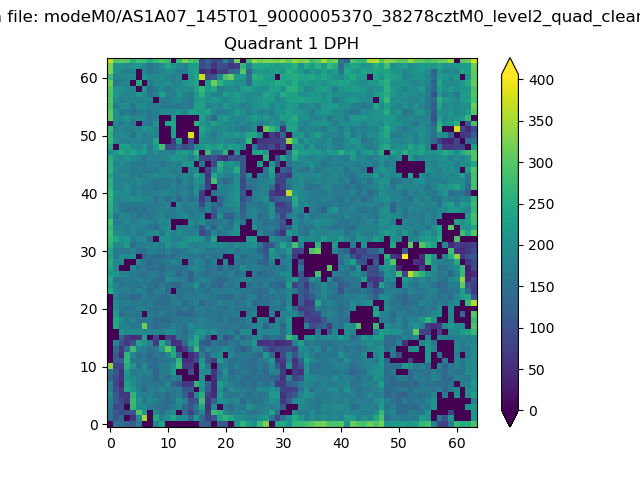 |
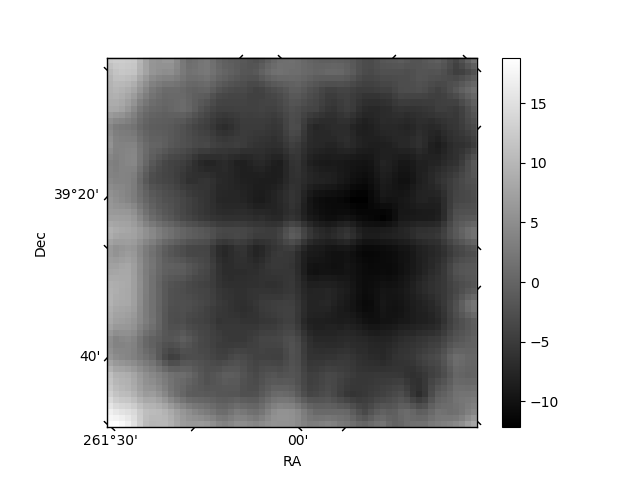
Quadrant B |
|---|---|---|---|
| Quadrant D | 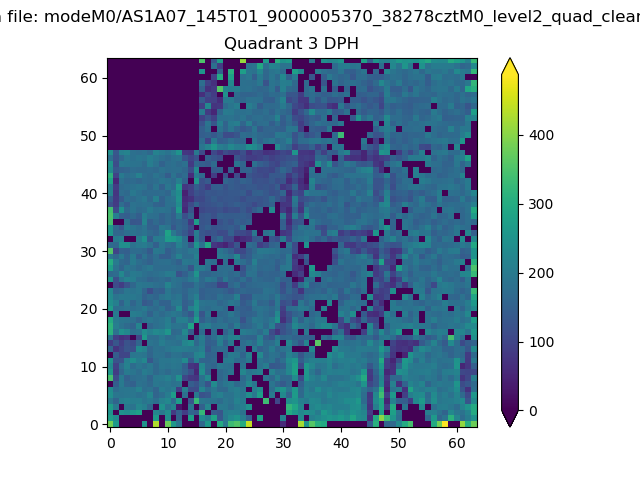 |
 |
Quadrant C |
| Plot type | Count rate plots | Images |
|---|---|---|
| Comparison with Poisson distribution Blue bars denote a histogram of data divided into 1 sec bins. Red curve is a Poisson curve with rate = median count rate of data. |
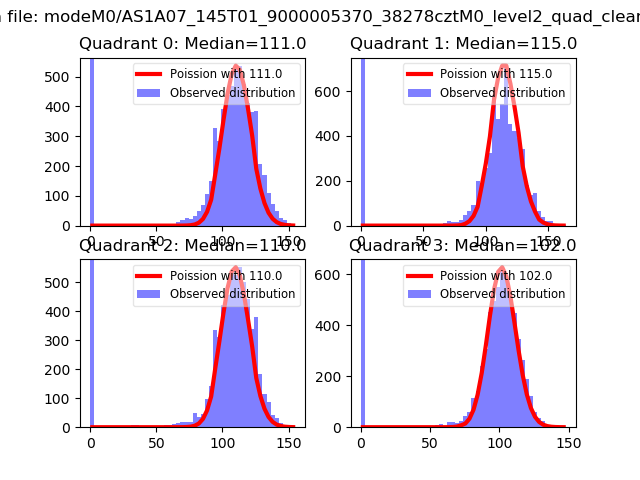 |
 |
| Quadrant-wise count rates Data is divided into 100 sec bins |
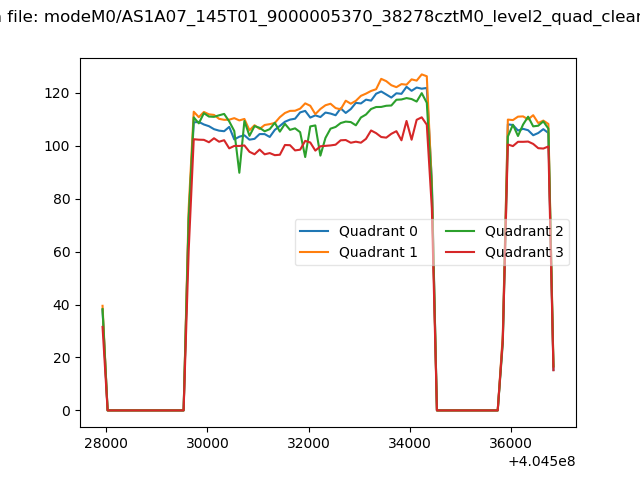 |
|
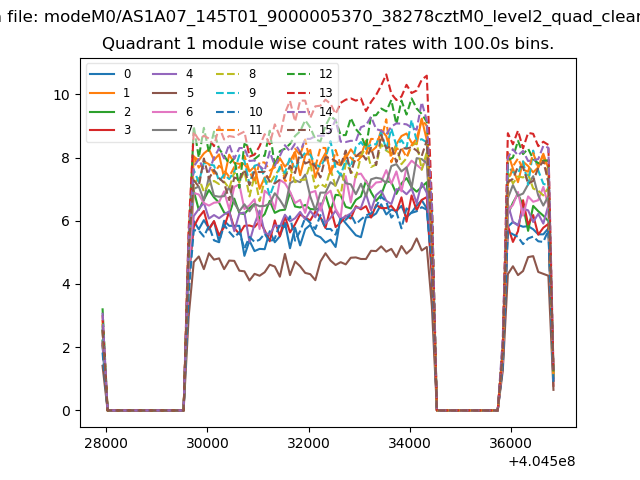
| Module-wise count rates for Quadrant A Data is divided into 100 sec bins |
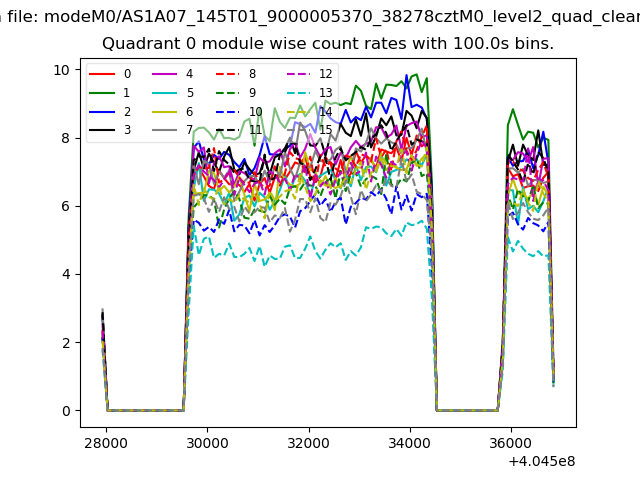 |
 |
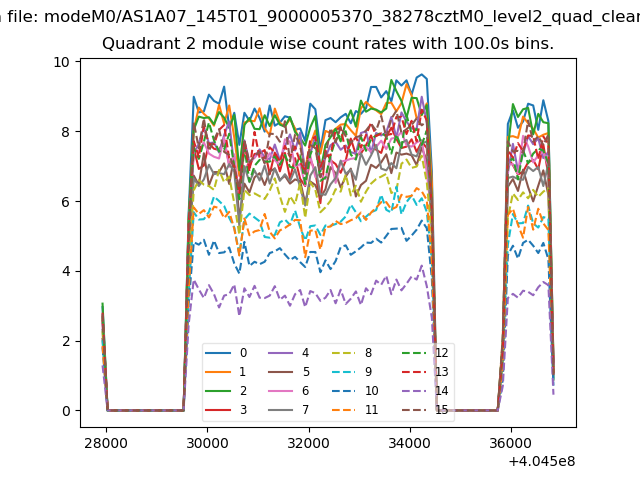
| Module-wise count rates for Quadrant B Data is divided into 100 sec bins |
 |
 |
| Module-wise count rates for Quadrant C Data is divided into 100 sec bins |
 |
 |
| Module-wise count rates for Quadrant D Data is divided into 100 sec bins |
 |
 |
| Parameter | Plot |
|---|---|
| CZT HV Monitor | 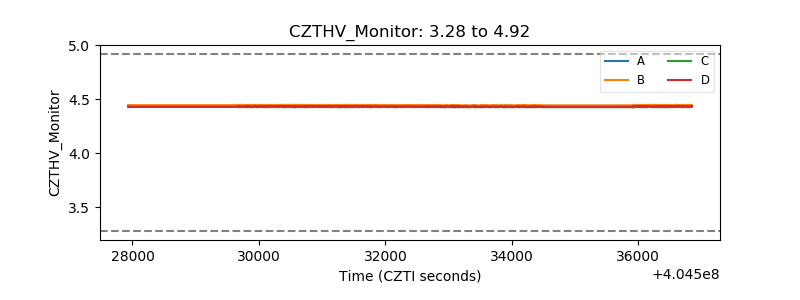 |
| D_VDD | 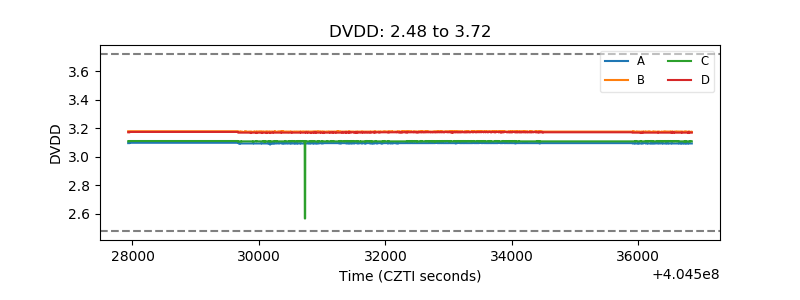 |
| Temperature 1 | 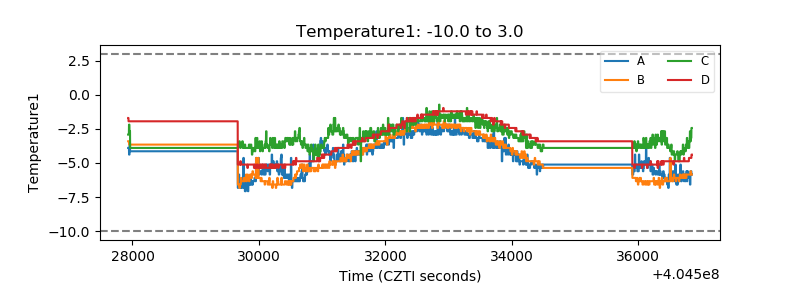 |
| Veto HV Monitor | 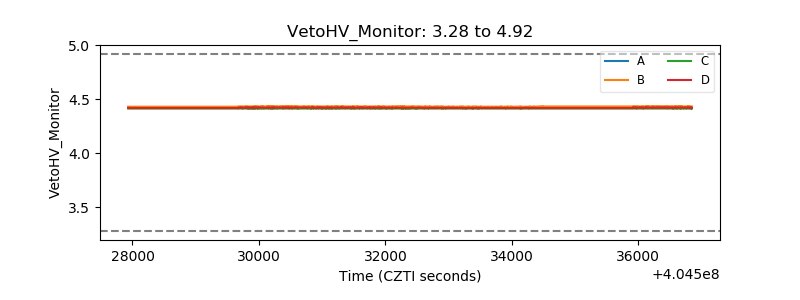 |
| Veto LLD | 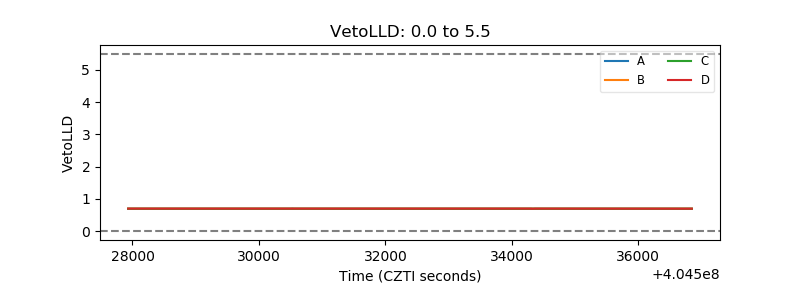 |
| Alpha Counter | 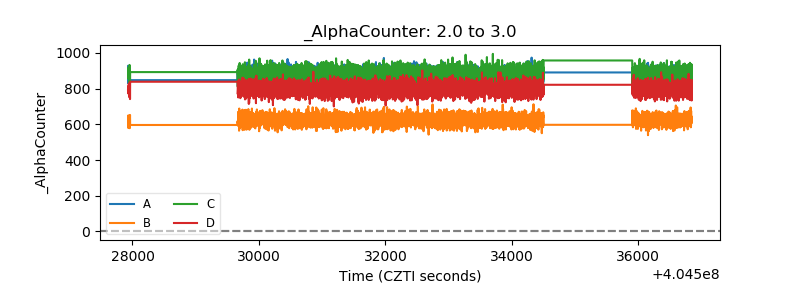 |
| _CPM_Rate | 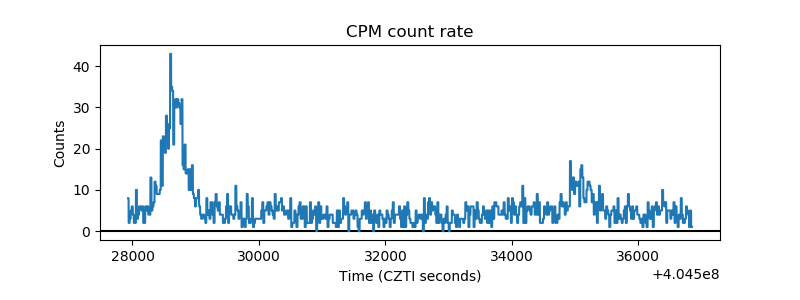 |
| CZT Counter | 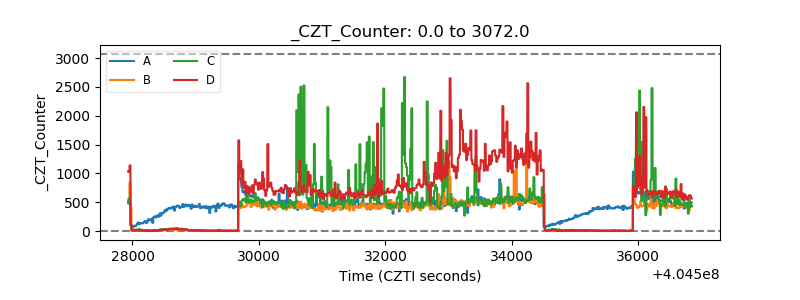 |
| +2.5 Volts monitor | 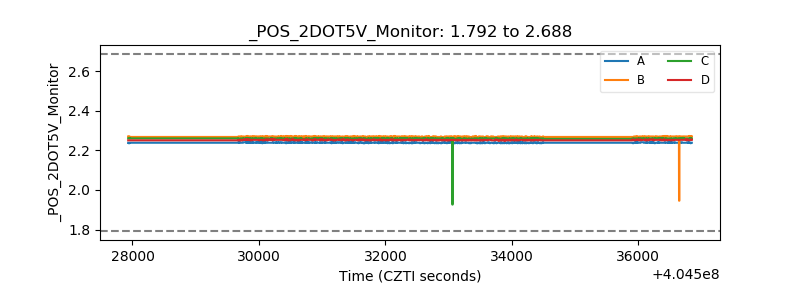 |
| +5 Volts monitor | 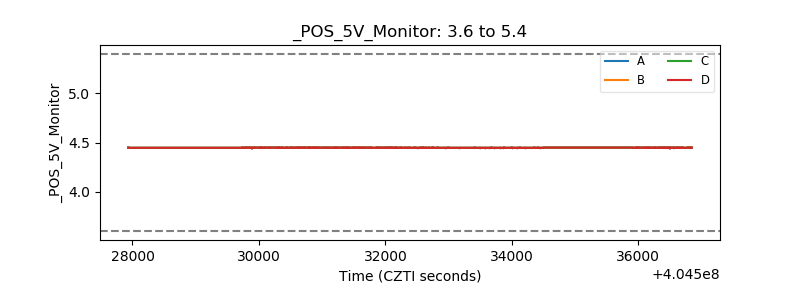 |
| _ROLL_ROT | 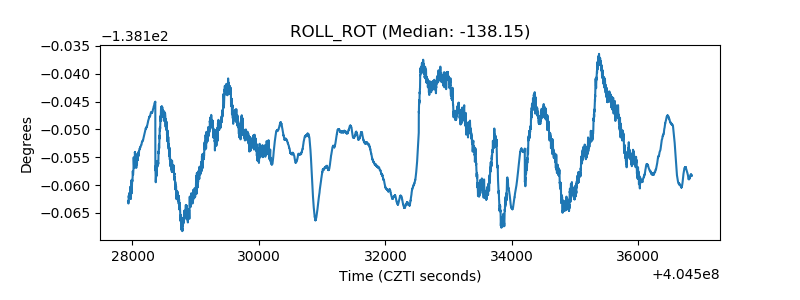 |
| _Roll_DEC | 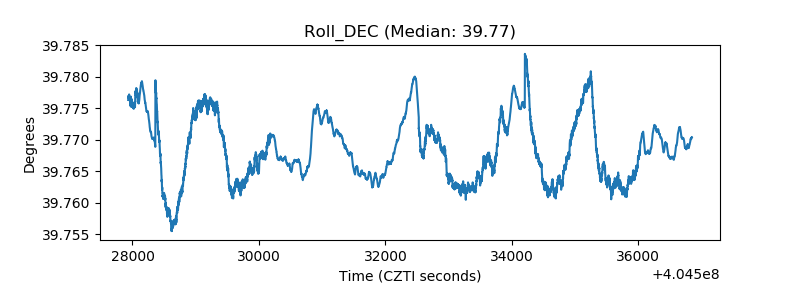 |
| _Roll_RA | 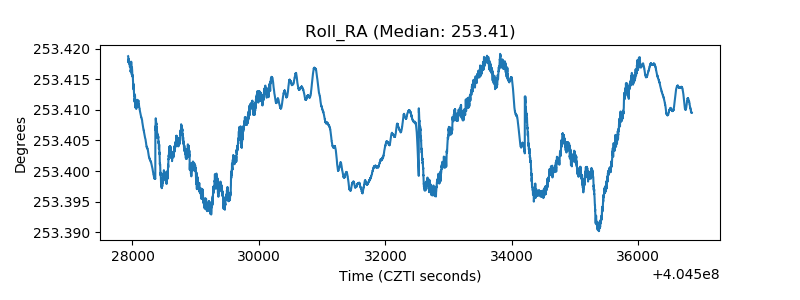 |
| Veto Counter |  |