| Param | Original file | Final file |
|---|---|---|
| Filename | modeM0/AS1A07_145T01_9000005370_38279cztM0_level2.fits | modeM0/AS1A07_145T01_9000005370_38279cztM0_level2_quad_clean.evt |
| Size (bytes) | 467,193,600 | 106,698,240 |
| Size | 445.6 MB | 101.8 MB |
| Events in quadrant A | 3,375,176 | 718,928 |
| Events in quadrant B | 2,987,156 | 739,005 |
| Events in quadrant C | 3,587,898 | 704,025 |
| Events in quadrant D | 6,844,447 | 620,091 |
| Mode M9 | |||
|---|---|---|---|
| Quadrant | BADHDUFLAG | Total packets | Discarded packets |
| A | 0 | 27 | 0 |
| B | 0 | 27 | 0 |
| C | 0 | 27 | 0 |
| D | 0 | 27 | 0 |
| Mode SS | |||
|---|---|---|---|
| Quadrant | BADHDUFLAG | Total packets | Discarded packets |
| A | 0 | 132 | 0 |
| B | 0 | 132 | 0 |
| C | 0 | 132 | 0 |
| D | 0 | 132 | 0 |
| Mode M0 | |||
|---|---|---|---|
| Quadrant | BADHDUFLAG | Total packets | Discarded packets |
| A | 0 | 13849 | 3 |
| B | 0 | 13174 | 2 |
| C | 0 | 14679 | 2 |
| D | 0 | 25241 | 2 |
| Quadrant | Total seconds | Saturated seconds | Saturation percentage |
|---|---|---|---|
| A | 6433 | 17 | 0.264262% |
| B | 6433 | 16 | 0.248718% |
| C | 6433 | 62 | 0.963781% |
| D | 6433 | 501 | 7.787968% |
Noise dominated data is calculated using 1-second bins in cleaned event files. If a bin has >2000 counts, and if more than 50% of those come from <1% of pixels, then it is considered to be noise-dominated and hence unusable.
| Quadrant | # 1 sec bins | Bins with >0 counts | Bins with >2000 counts | High rate bins dominated by noise | Noise dominated (total time) | Noise dominated (detector-on time) | Marked lightcurve |
|---|---|---|---|---|---|---|---|
| A | 9118 | 6435 | 15 | 15 | 0.16% | 0.23% | 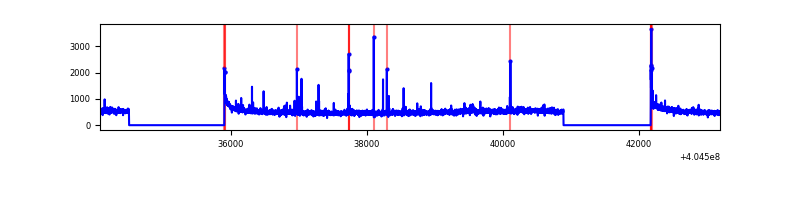 |
| B | 9118 | 6435 | 3 | 3 | 0.03% | 0.05% | 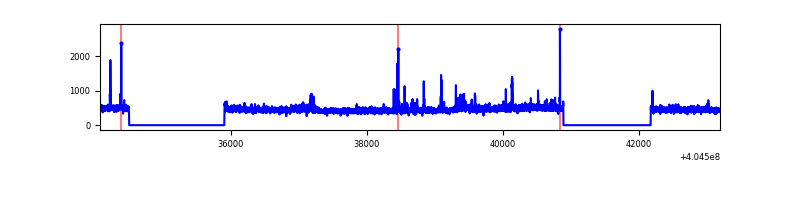 |
| C | 9118 | 6435 | 60 | 60 | 0.66% | 0.93% | 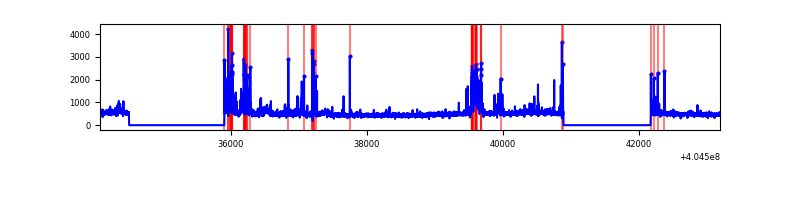 |
| D | 9118 | 6435 | 466 | 466 | 5.11% | 7.24% | 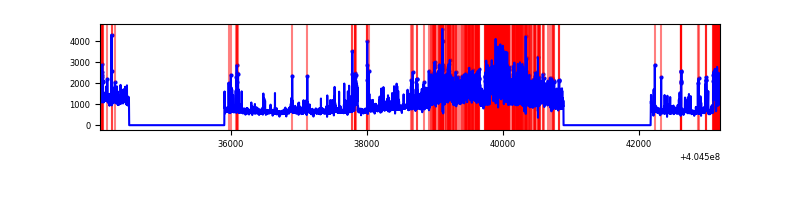 |
Top three noisy pixels from each quadrant. If the there are fewer than three noisy pixels in the level2.evt file, extra rows are filled as -1
| Pixel properties | Quadrant properties | ||||||
|---|---|---|---|---|---|---|---|
| Quadrant | DetID | PixID | Counts | Sigma | Mean | Median | Sigma |
| A | 10 | 83 | 425779 | 2901.35 | 725 | 710 | 146.5 |
| A | 12 | 189 | 54545 | 367.46 | 725 | 710 | 146.5 |
| A | 9 | 143 | 51356 | 345.69 | 725 | 710 | 146.5 |
| B | 5 | 172 | 72774 | 510.78 | 720 | 699 | 141.1 |
| B | 0 | 189 | 31498 | 218.27 | 720 | 699 | 141.1 |
| B | 12 | 111 | 17870 | 121.69 | 720 | 699 | 141.1 |
| C | 9 | 236 | 409089 | 2481.09 | 705 | 708 | 164.6 |
| C | 15 | 214 | 268950 | 1629.68 | 705 | 708 | 164.6 |
| C | 2 | 16 | 95721 | 577.24 | 705 | 708 | 164.6 |
| D | 10 | 203 | 2081908 | 12418.17 | 689 | 671 | 167.6 |
| D | 1 | 20 | 555561 | 3310.88 | 689 | 671 | 167.6 |
| D | 12 | 235 | 465858 | 2775.64 | 689 | 671 | 167.6 |
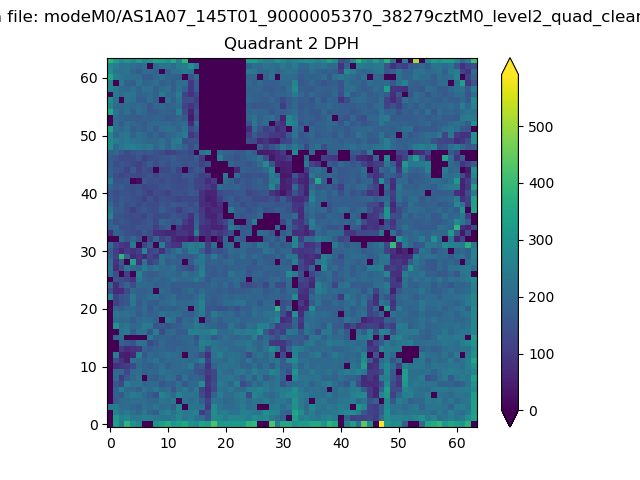
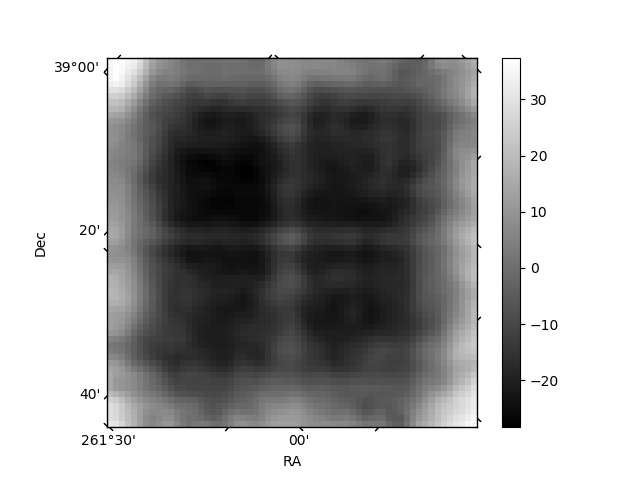
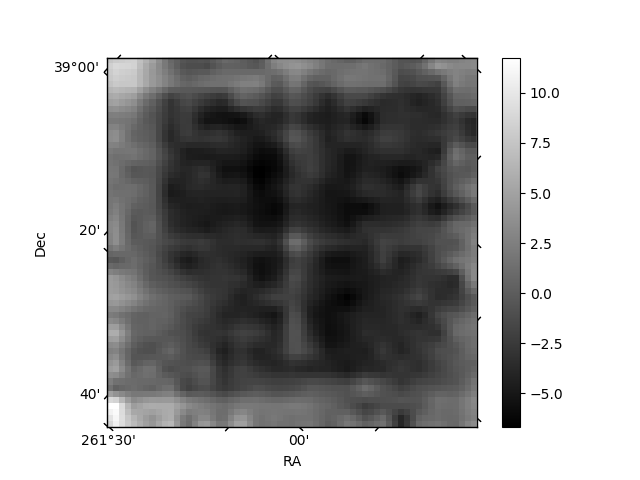
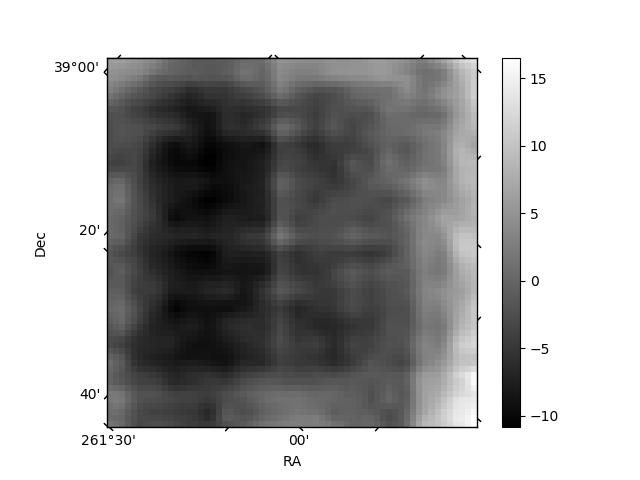
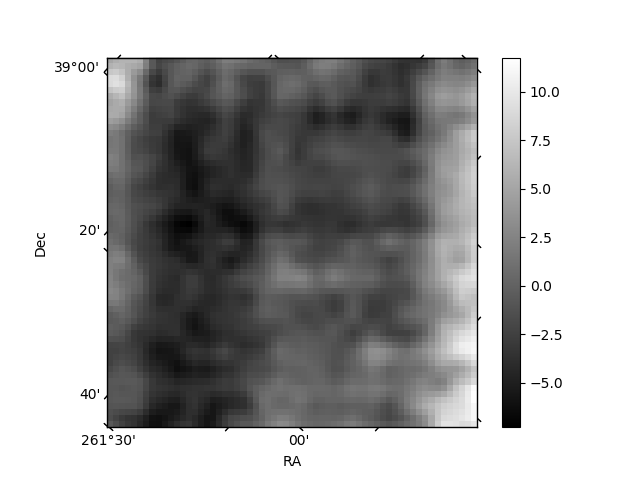
Histogram calculated using DETX and DETY for each event in the final _common_clean file
| Quadrant A | 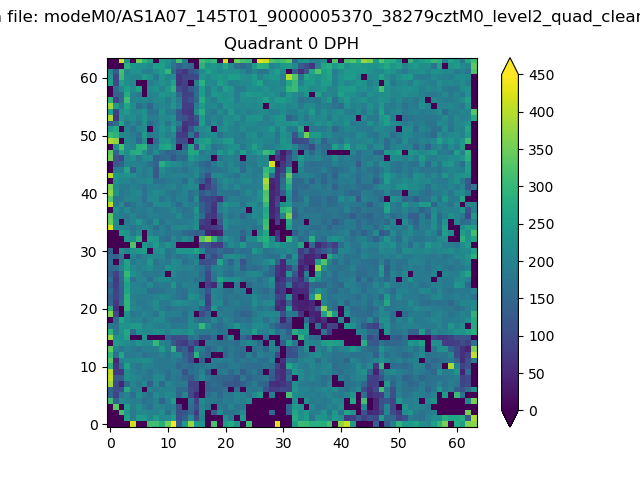 |
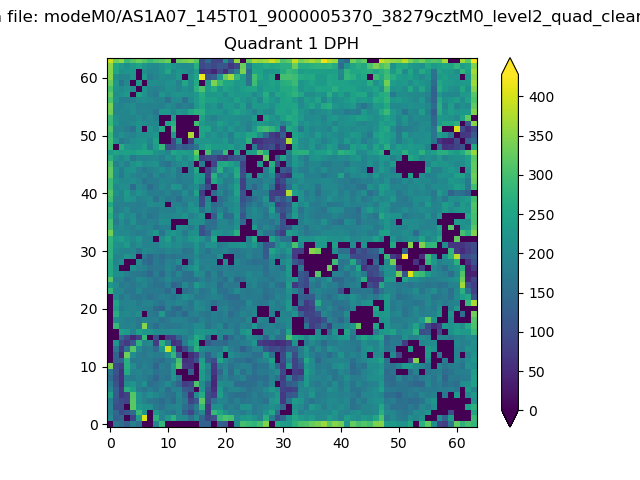 |
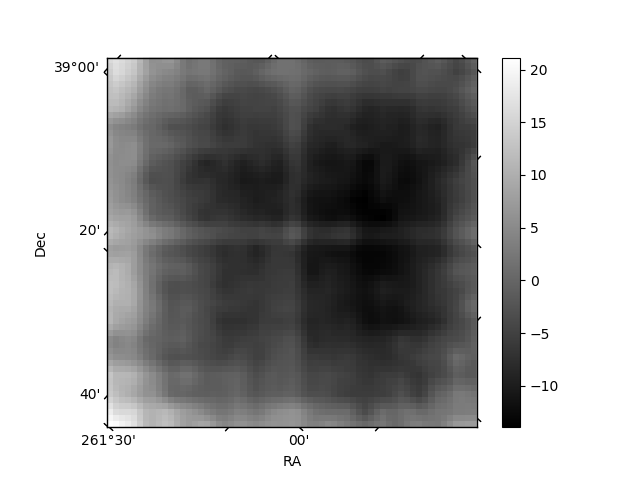
Quadrant B |
|---|---|---|---|
| Quadrant D | 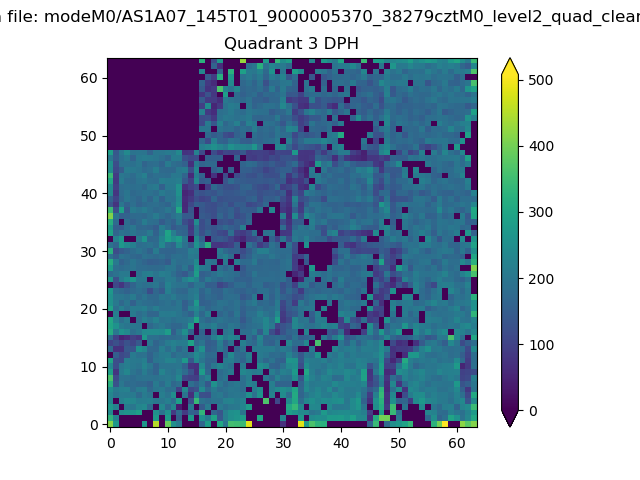 |
 |
Quadrant C |
| Plot type | Count rate plots | Images |
|---|---|---|
| Comparison with Poisson distribution Blue bars denote a histogram of data divided into 1 sec bins. Red curve is a Poisson curve with rate = median count rate of data. |
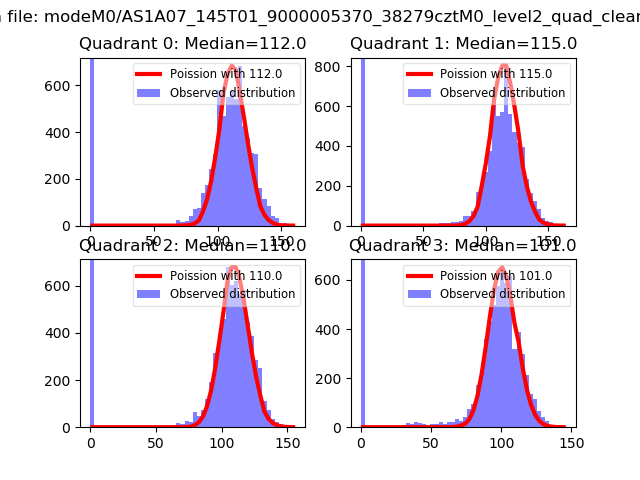 |
 |
| Quadrant-wise count rates Data is divided into 100 sec bins |
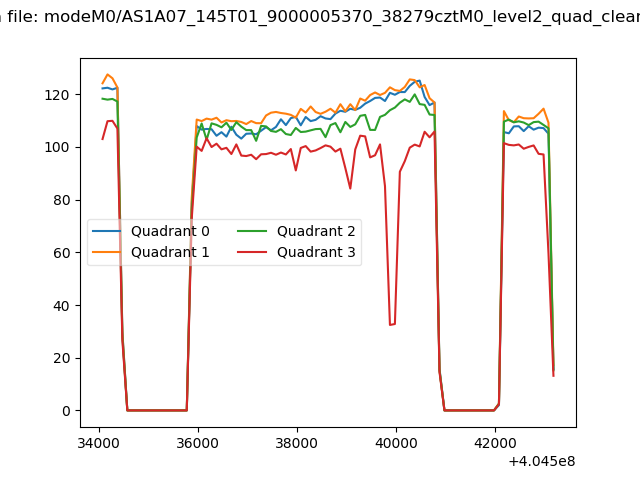 |
|
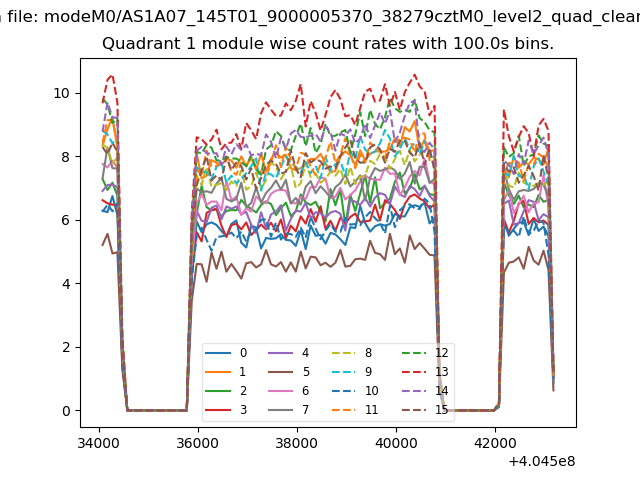
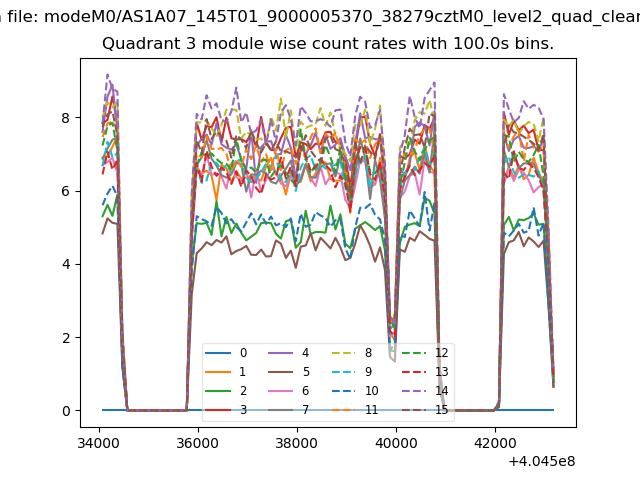
| Module-wise count rates for Quadrant A Data is divided into 100 sec bins |
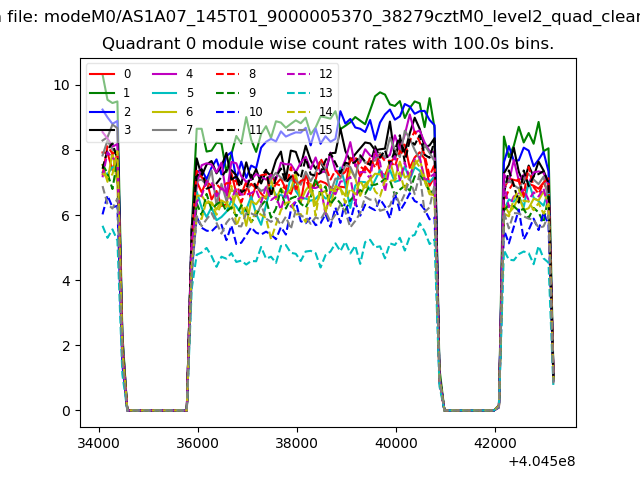 |
 |
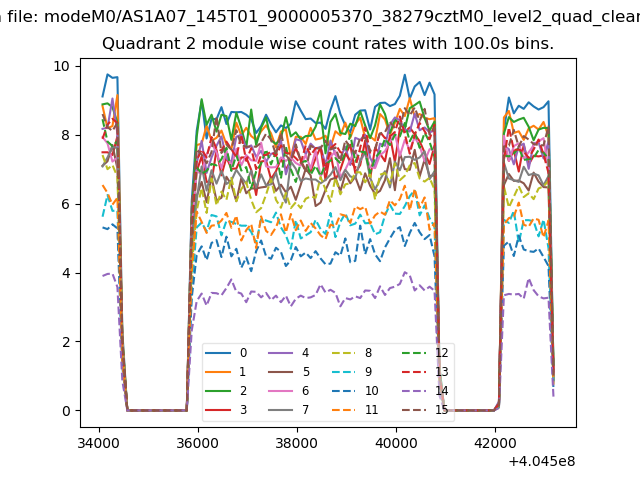
| Module-wise count rates for Quadrant B Data is divided into 100 sec bins |
 |
 |
| Module-wise count rates for Quadrant C Data is divided into 100 sec bins |
 |
 |
| Module-wise count rates for Quadrant D Data is divided into 100 sec bins |
 |
 |
| Parameter | Plot |
|---|---|
| CZT HV Monitor | 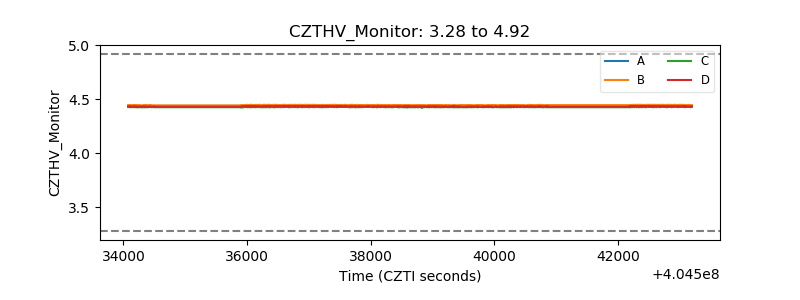 |
| D_VDD | 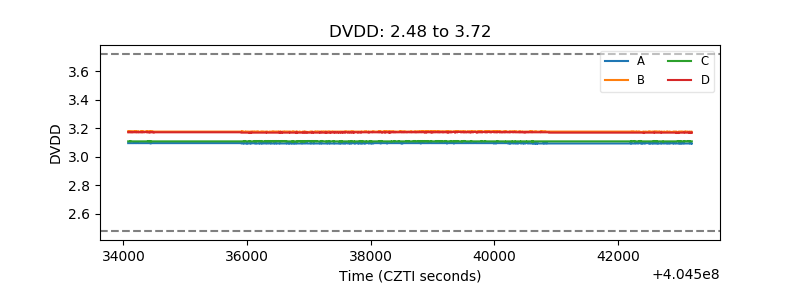 |
| Temperature 1 | 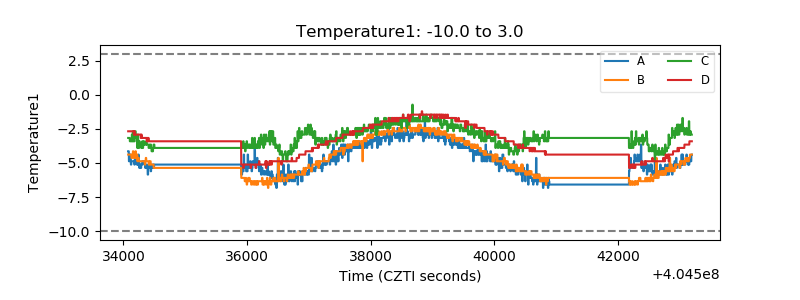 |
| Veto HV Monitor | 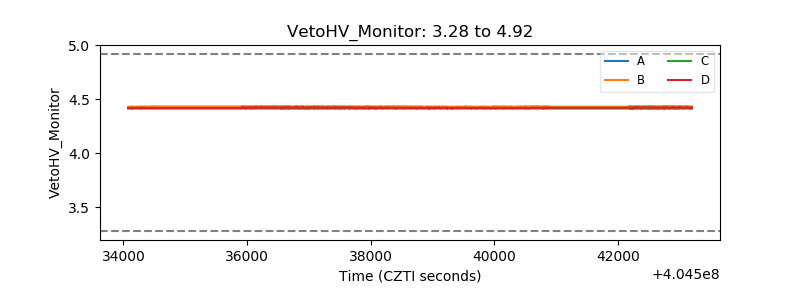 |
| Veto LLD | 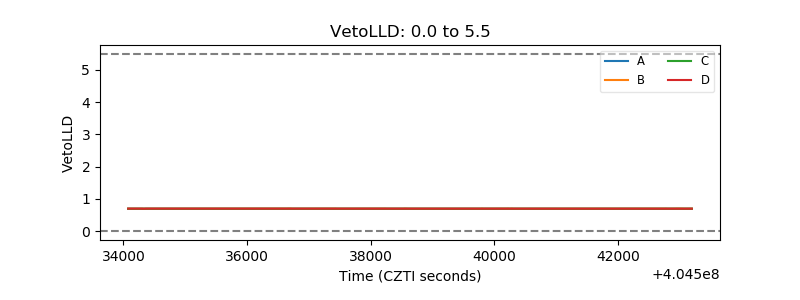 |
| Alpha Counter | 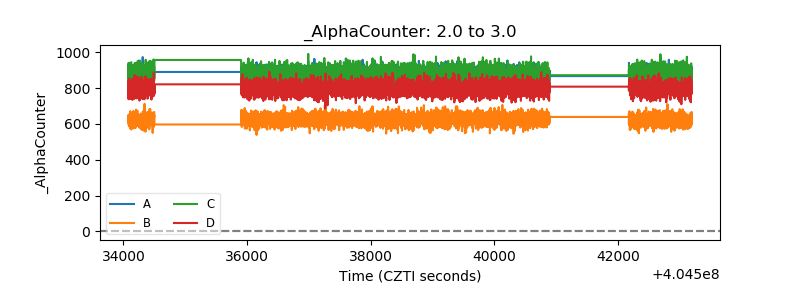 |
| _CPM_Rate | 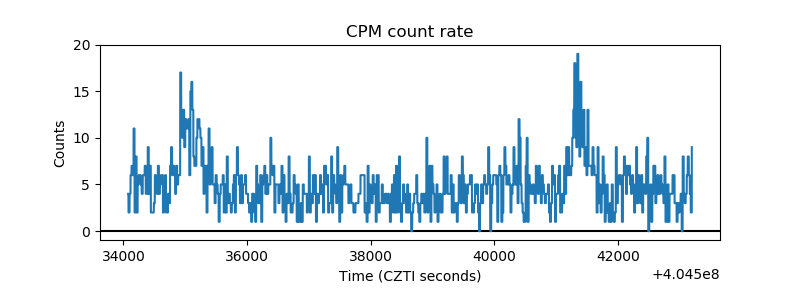 |
| CZT Counter | 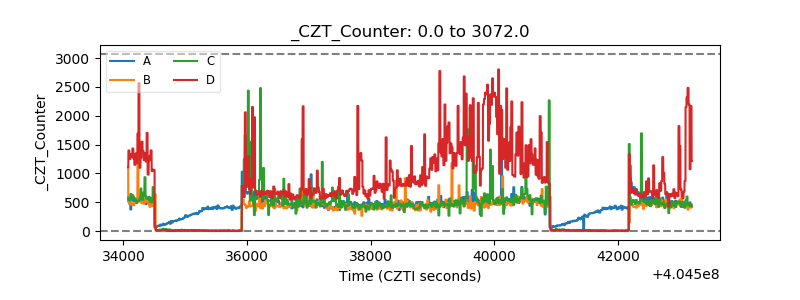 |
| +2.5 Volts monitor | 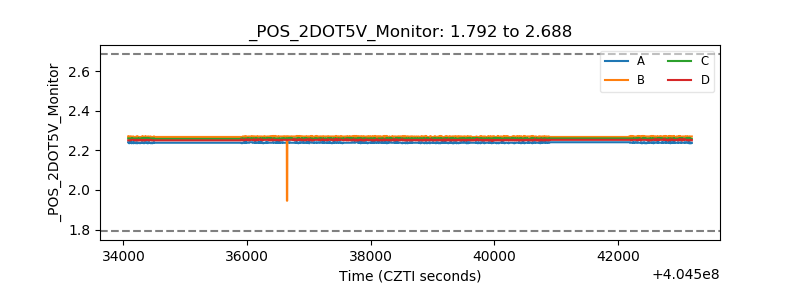 |
| +5 Volts monitor | 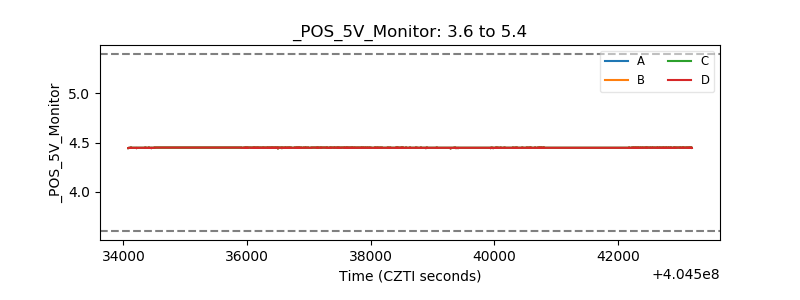 |
| _ROLL_ROT | 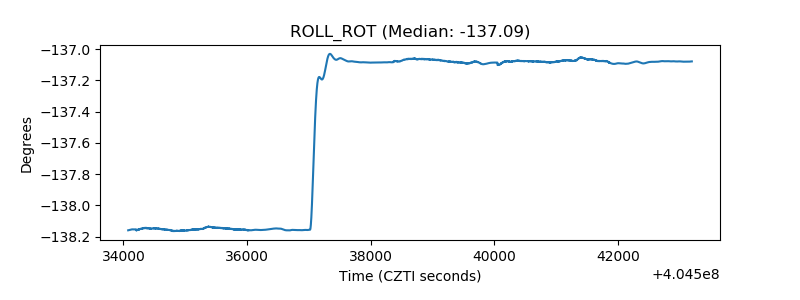 |
| _Roll_DEC | 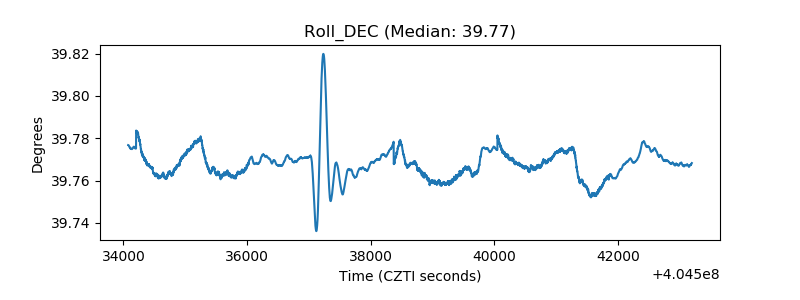 |
| _Roll_RA | 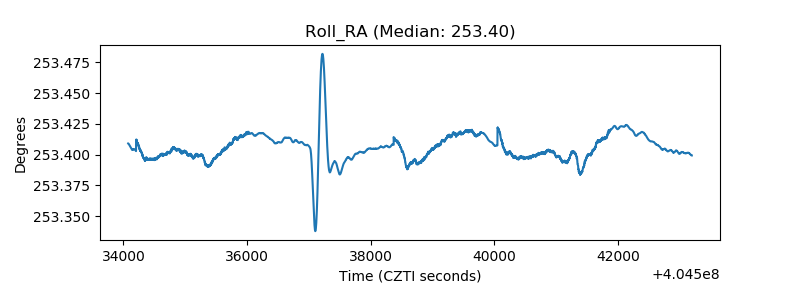 |
| Veto Counter | 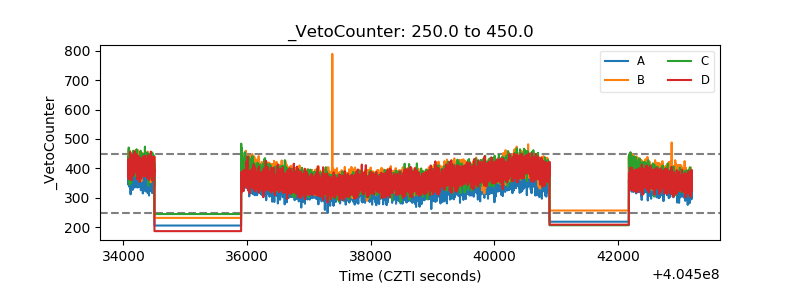 |