| Param | Original file | Final file |
|---|---|---|
| Filename | modeM0/AS1A07_145T01_9000005370_38282cztM0_level2.fits | modeM0/AS1A07_145T01_9000005370_38282cztM0_level2_quad_clean.evt |
| Size (bytes) | 1,266,468,480 | 249,742,080 |
| Size | 1.2 GB | 238.2 MB |
| Events in quadrant A | 8,265,839 | 1,731,144 |
| Events in quadrant B | 9,111,756 | 1,768,167 |
| Events in quadrant C | 7,407,228 | 1,693,954 |
| Events in quadrant D | 20,889,234 | 1,289,656 |
| Mode M9 | |||
|---|---|---|---|
| Quadrant | BADHDUFLAG | Total packets | Discarded packets |
| A | 0 | 43 | 0 |
| B | 0 | 43 | 0 |
| C | 0 | 43 | 0 |
| D | 0 | 44 | 0 |
| Mode SS | |||
|---|---|---|---|
| Quadrant | BADHDUFLAG | Total packets | Discarded packets |
| A | 0 | 320 | 0 |
| B | 0 | 320 | 0 |
| C | 0 | 320 | 0 |
| D | 0 | 320 | 0 |
| Mode M0 | |||
|---|---|---|---|
| Quadrant | BADHDUFLAG | Total packets | Discarded packets |
| A | 0 | 33754 | 5 |
| B | 0 | 37517 | 4 |
| C | 0 | 31768 | 4 |
| D | 0 | 73370 | 4 |
| Quadrant | Total seconds | Saturated seconds | Saturation percentage |
|---|---|---|---|
| A | 15623 | 36 | 0.230429% |
| B | 15623 | 283 | 1.811432% |
| C | 15623 | 18 | 0.115215% |
| D | 15623 | 2819 | 18.043910% |
Noise dominated data is calculated using 1-second bins in cleaned event files. If a bin has >2000 counts, and if more than 50% of those come from <1% of pixels, then it is considered to be noise-dominated and hence unusable.
| Quadrant | # 1 sec bins | Bins with >0 counts | Bins with >2000 counts | High rate bins dominated by noise | Noise dominated (total time) | Noise dominated (detector-on time) | Marked lightcurve |
|---|---|---|---|---|---|---|---|
| A | 19804 | 15626 | 7 | 7 | 0.04% | 0.04% | 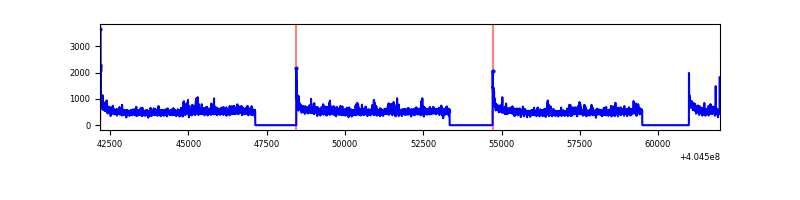 |
| B | 19804 | 15626 | 186 | 186 | 0.94% | 1.19% | 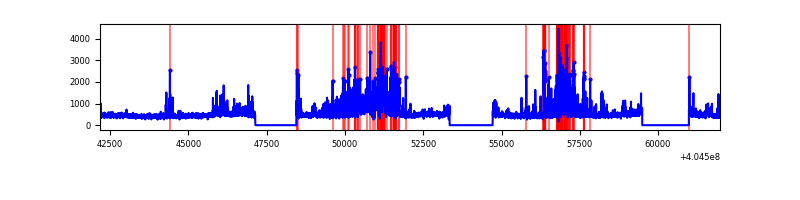 |
| C | 19804 | 15626 | 6 | 6 | 0.03% | 0.04% | 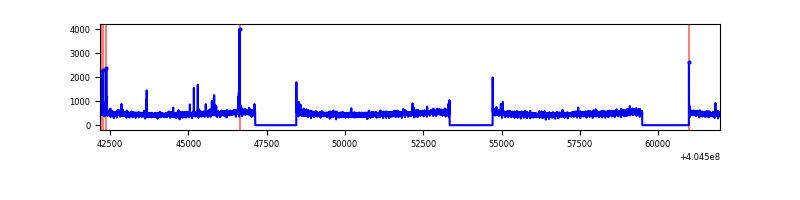 |
| D | 19804 | 15626 | 2897 | 2897 | 14.63% | 18.54% | 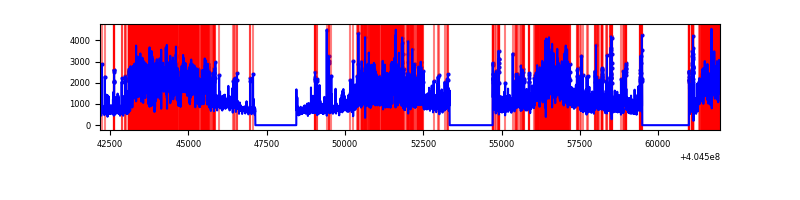 |
Top three noisy pixels from each quadrant. If the there are fewer than three noisy pixels in the level2.evt file, extra rows are filled as -1
| Pixel properties | Quadrant properties | ||||||
|---|---|---|---|---|---|---|---|
| Quadrant | DetID | PixID | Counts | Sigma | Mean | Median | Sigma |
| A | 10 | 83 | 1013914 | 2886.14 | 1742 | 1705 | 350.7 |
| A | 12 | 16 | 235054 | 665.36 | 1742 | 1705 | 350.7 |
| A | 12 | 189 | 221796 | 627.55 | 1742 | 1705 | 350.7 |
| B | 0 | 183 | 1140645 | 3473.04 | 1723 | 1675 | 327.9 |
| B | 5 | 172 | 774353 | 2356.11 | 1723 | 1675 | 327.9 |
| B | 0 | 229 | 133697 | 402.57 | 1723 | 1675 | 327.9 |
| C | 15 | 214 | 651500 | 1662.0 | 1695 | 1712 | 391.0 |
| C | 15 | 208 | 65114 | 162.17 | 1695 | 1712 | 391.0 |
| C | 9 | 236 | 35032 | 85.22 | 1695 | 1712 | 391.0 |
| D | 2 | 16 | 4768559 | 12055.04 | 1616 | 1573 | 395.4 |
| D | 10 | 203 | 4048143 | 10233.2 | 1616 | 1573 | 395.4 |
| D | 12 | 235 | 3168259 | 8008.1 | 1616 | 1573 | 395.4 |
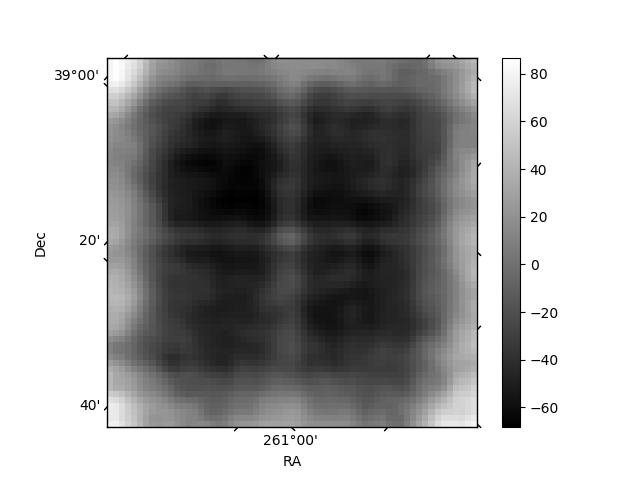
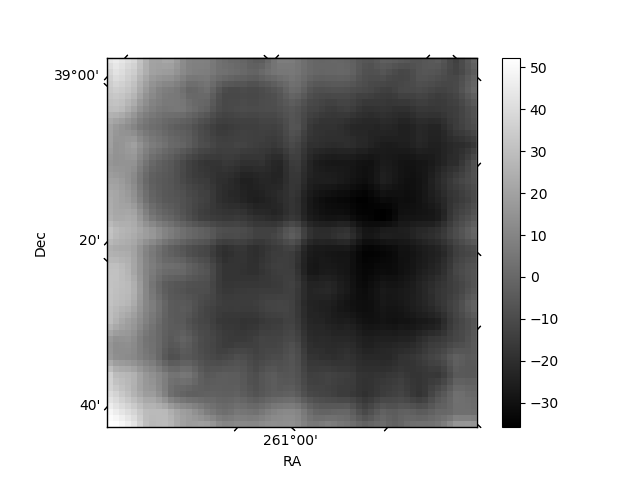
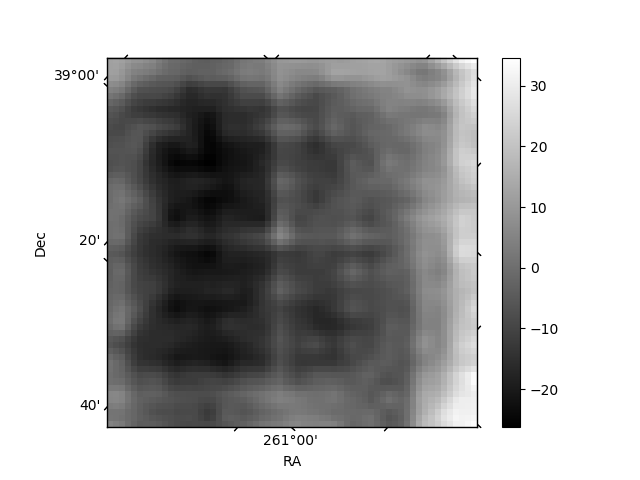
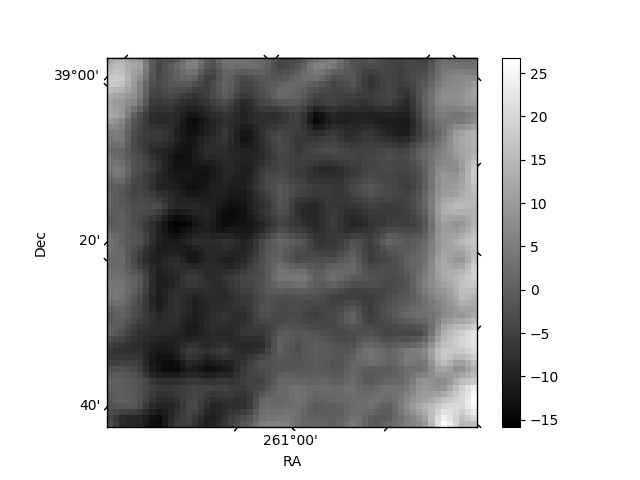
Histogram calculated using DETX and DETY for each event in the final _common_clean file
| Quadrant A | 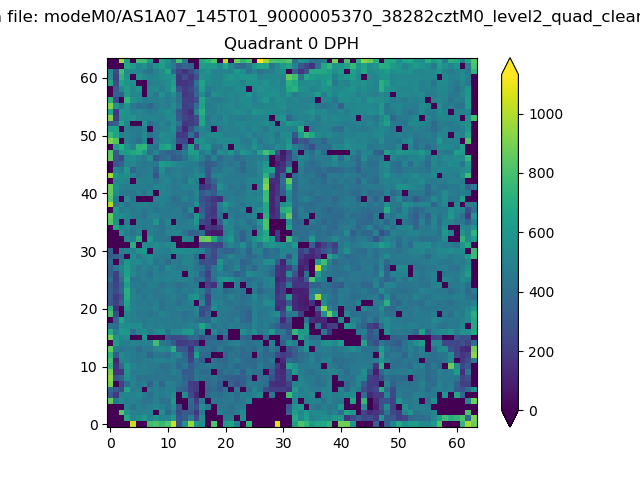 |
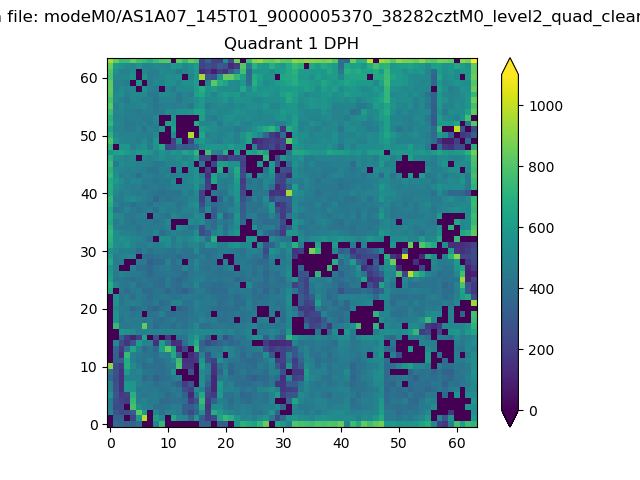 |
Quadrant B |
|---|---|---|---|
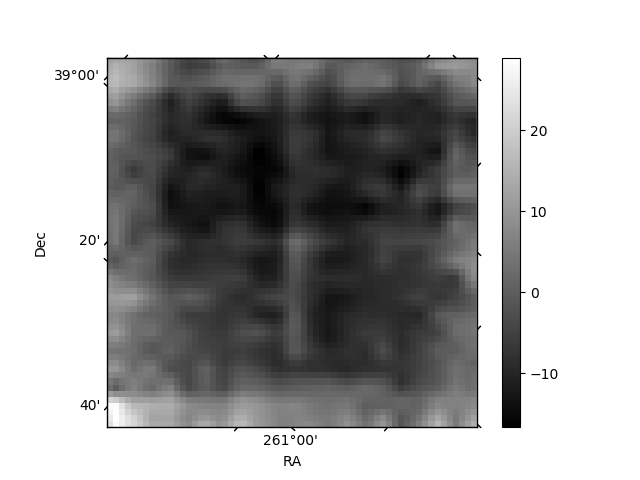
| Quadrant D | 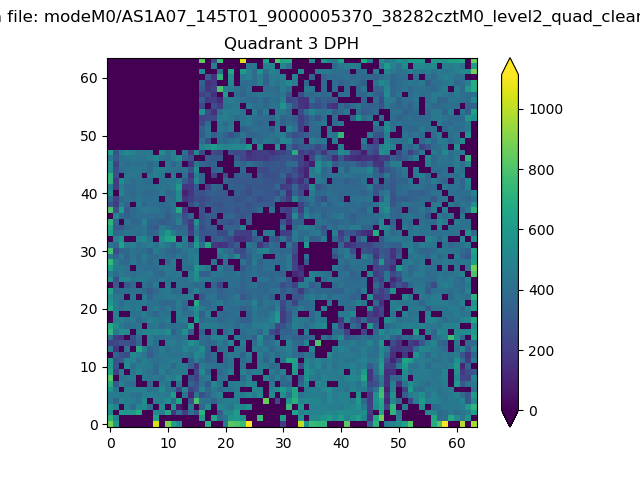 |
 |
Quadrant C |
| Plot type | Count rate plots | Images |
|---|---|---|
| Comparison with Poisson distribution Blue bars denote a histogram of data divided into 1 sec bins. Red curve is a Poisson curve with rate = median count rate of data. |
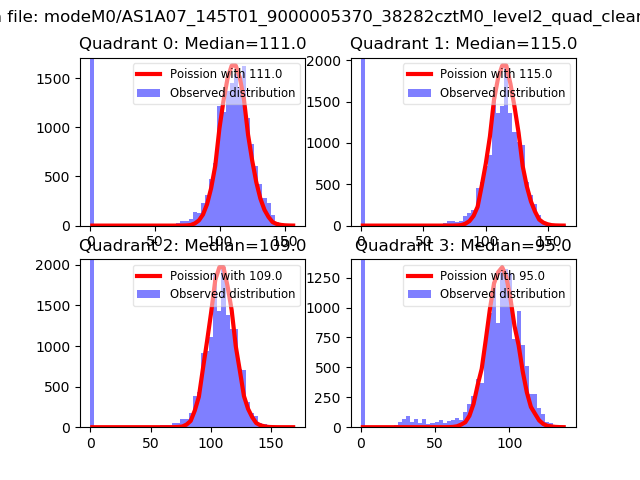 |
 |
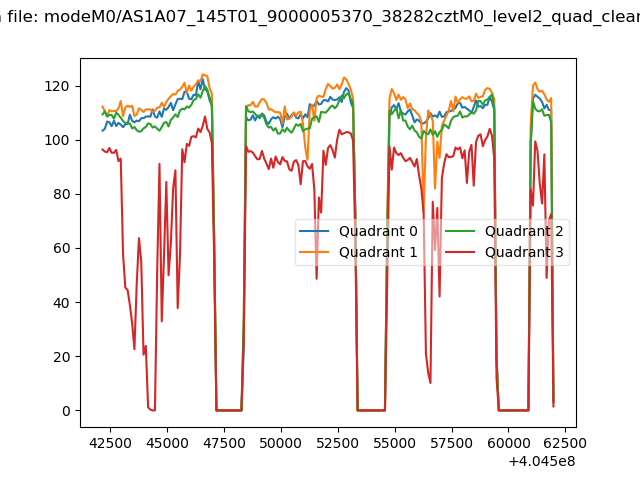
| Quadrant-wise count rates Data is divided into 100 sec bins |
 |
|
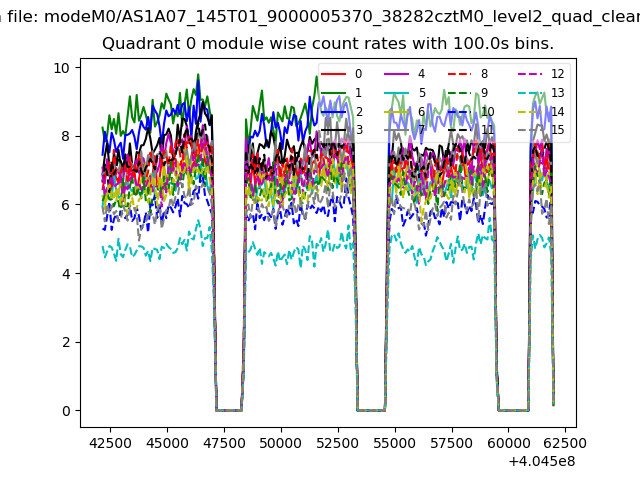
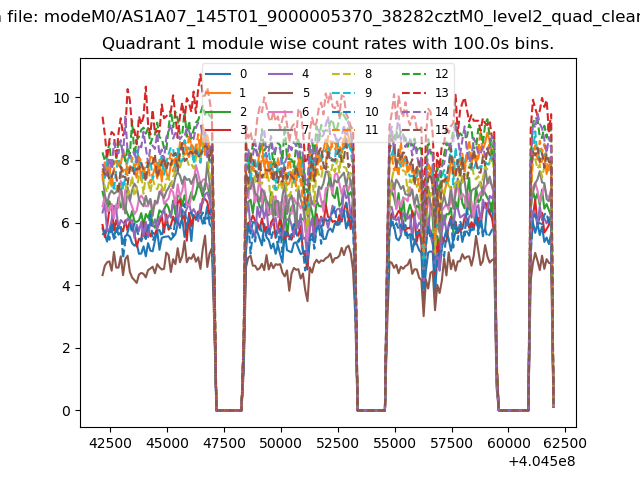
| Module-wise count rates for Quadrant A Data is divided into 100 sec bins |
 |
 |
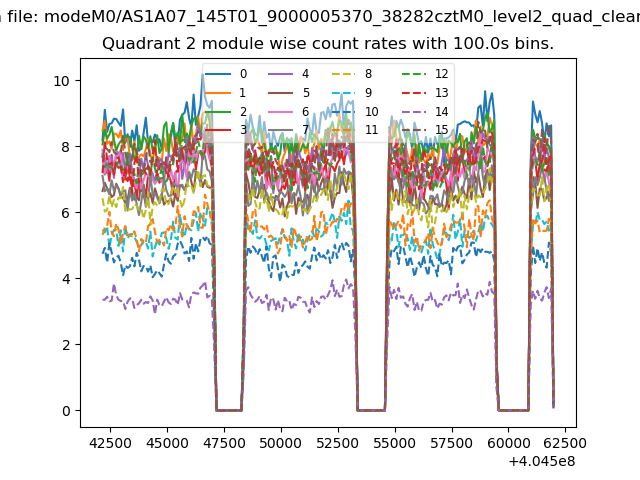
| Module-wise count rates for Quadrant B Data is divided into 100 sec bins |
 |
 |
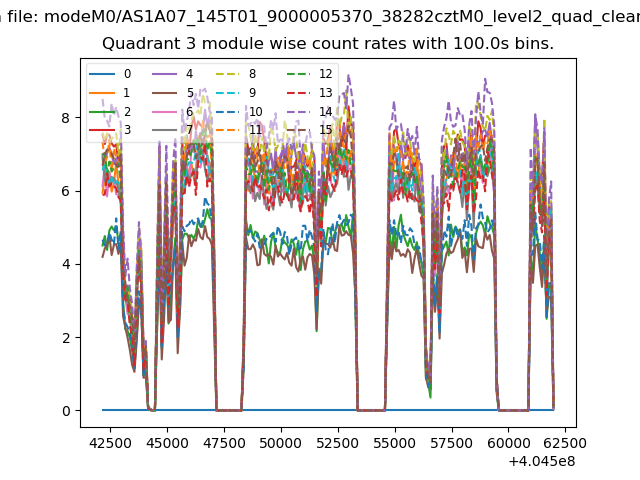
| Module-wise count rates for Quadrant C Data is divided into 100 sec bins |
 |
 |
| Module-wise count rates for Quadrant D Data is divided into 100 sec bins |
 |
 |
| Parameter | Plot |
|---|---|
| CZT HV Monitor | 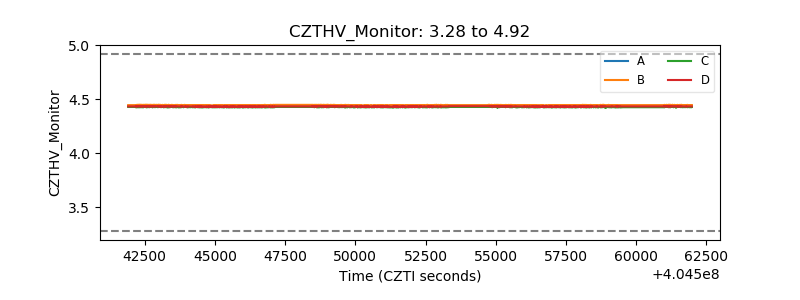 |
| D_VDD | 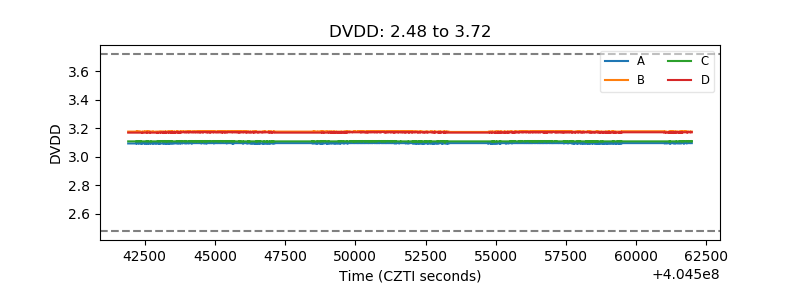 |
| Temperature 1 | 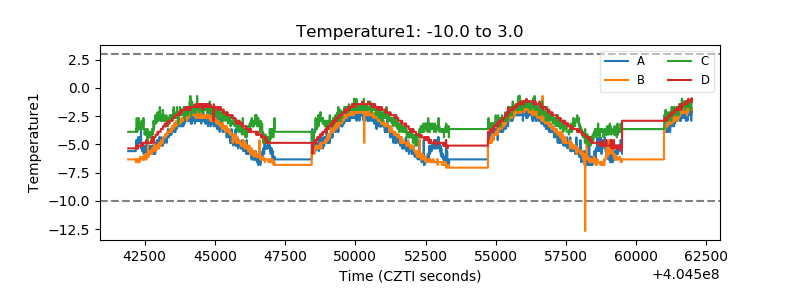 |
| Veto HV Monitor | 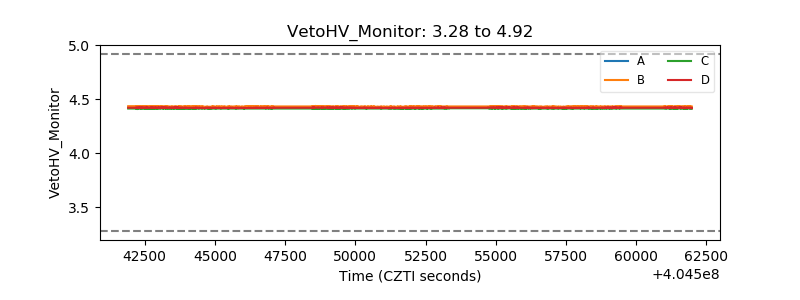 |
| Veto LLD | 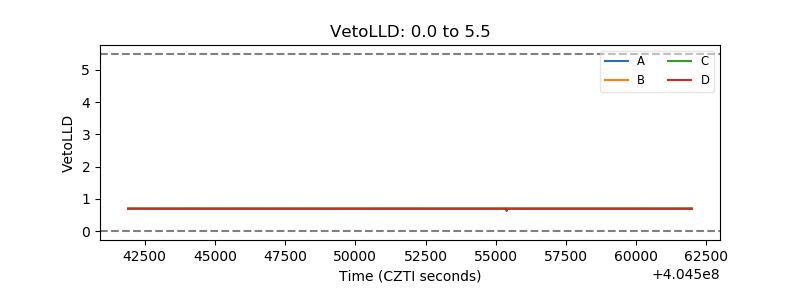 |
| Alpha Counter | 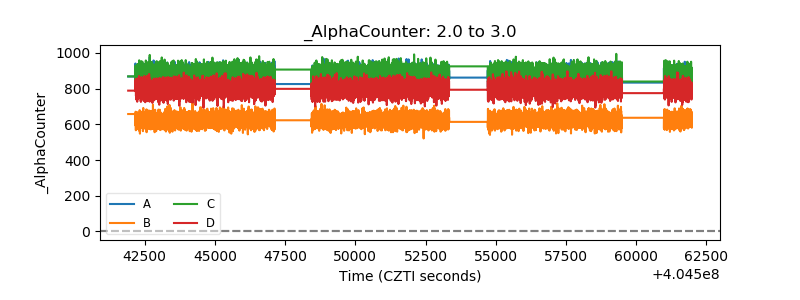 |
| _CPM_Rate | 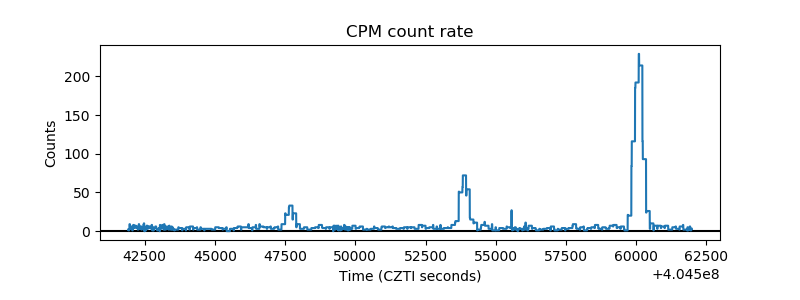 |
| CZT Counter | 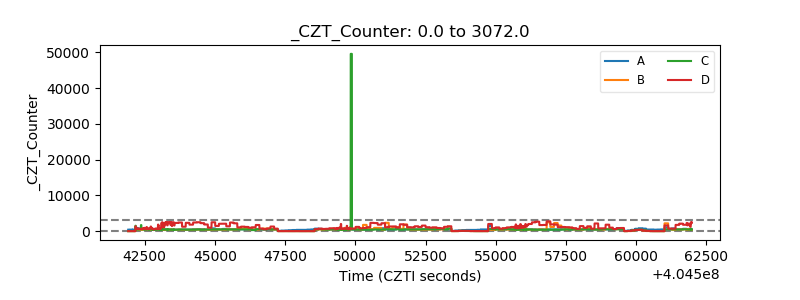 |
| +2.5 Volts monitor | 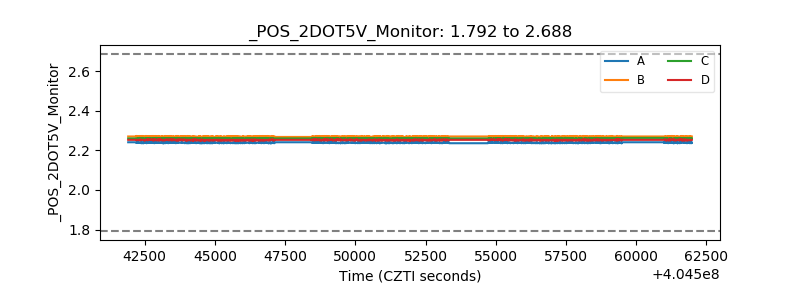 |
| +5 Volts monitor | 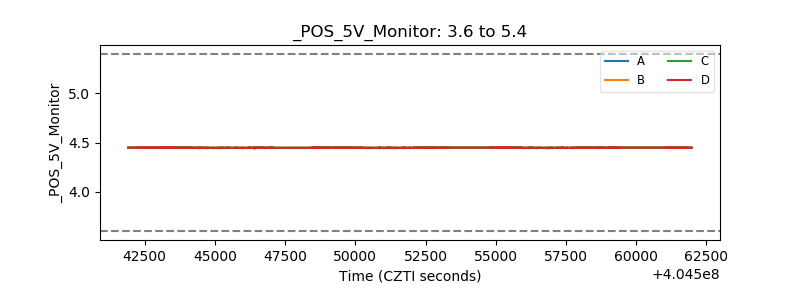 |
| _ROLL_ROT | 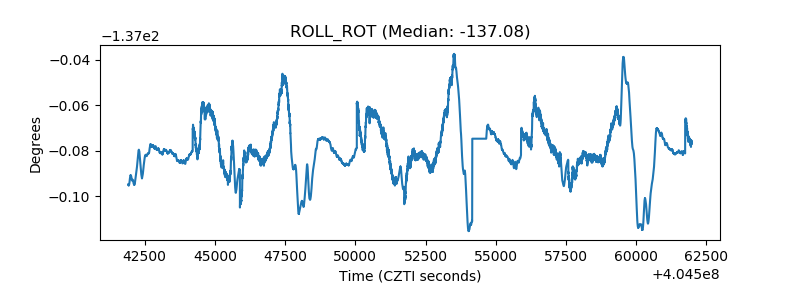 |
| _Roll_DEC | 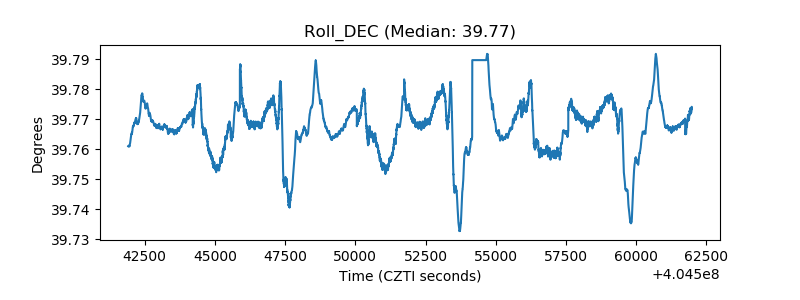 |
| _Roll_RA | 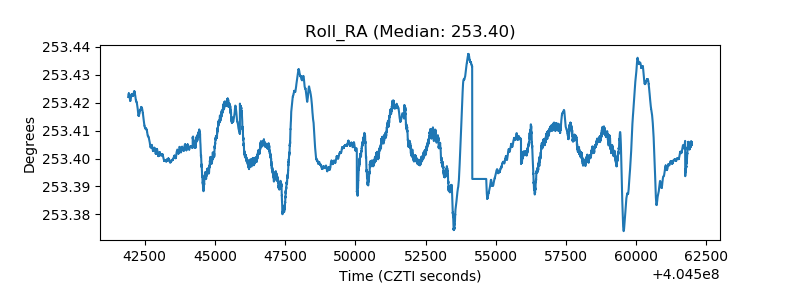 |
| Veto Counter | 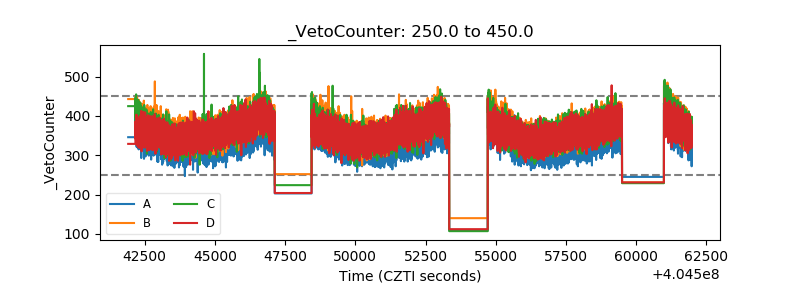 |