| Param | Original file | Final file |
|---|---|---|
| Filename | modeM0/AS1A07_145T01_9000005370_38283cztM0_level2.fits | modeM0/AS1A07_145T01_9000005370_38283cztM0_level2_quad_clean.evt |
| Size (bytes) | 436,749,120 | 90,878,400 |
| Size | 416.5 MB | 86.7 MB |
| Events in quadrant A | 2,946,251 | 626,287 |
| Events in quadrant B | 2,710,946 | 640,055 |
| Events in quadrant C | 2,631,992 | 604,941 |
| Events in quadrant D | 7,448,296 | 493,236 |
| Mode M9 | |||
|---|---|---|---|
| Quadrant | BADHDUFLAG | Total packets | Discarded packets |
| A | 0 | 16 | 0 |
| B | 0 | 16 | 0 |
| C | 0 | 16 | 0 |
| D | 0 | 16 | 0 |
| Mode SS | |||
|---|---|---|---|
| Quadrant | BADHDUFLAG | Total packets | Discarded packets |
| A | 0 | 114 | 0 |
| B | 0 | 114 | 0 |
| C | 0 | 114 | 0 |
| D | 0 | 114 | 0 |
| Mode M0 | |||
|---|---|---|---|
| Quadrant | BADHDUFLAG | Total packets | Discarded packets |
| A | 0 | 12021 | 2 |
| B | 0 | 11692 | 1 |
| C | 0 | 11264 | 1 |
| D | 0 | 26098 | 1 |
| Quadrant | Total seconds | Saturated seconds | Saturation percentage |
|---|---|---|---|
| A | 5529 | 9 | 0.162778% |
| B | 5529 | 22 | 0.397902% |
| C | 5529 | 10 | 0.180865% |
| D | 5529 | 914 | 16.531018% |
Noise dominated data is calculated using 1-second bins in cleaned event files. If a bin has >2000 counts, and if more than 50% of those come from <1% of pixels, then it is considered to be noise-dominated and hence unusable.
| Quadrant | # 1 sec bins | Bins with >0 counts | Bins with >2000 counts | High rate bins dominated by noise | Noise dominated (total time) | Noise dominated (detector-on time) | Marked lightcurve |
|---|---|---|---|---|---|---|---|
| A | 7142 | 5530 | 2 | 2 | 0.03% | 0.04% | 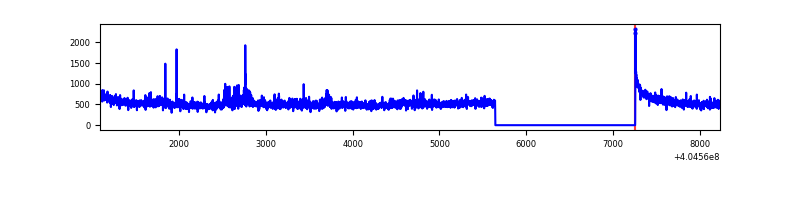 |
| B | 7142 | 5530 | 9 | 9 | 0.13% | 0.16% | 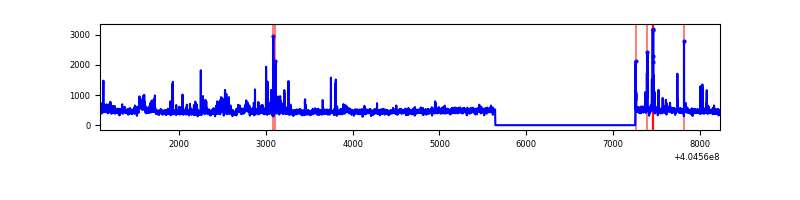 |
| C | 7142 | 5530 | 7 | 7 | 0.10% | 0.13% | 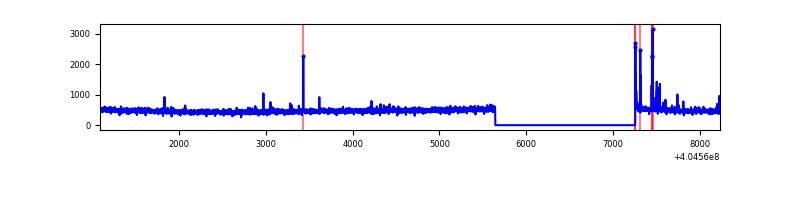 |
| D | 7142 | 5530 | 891 | 891 | 12.48% | 16.11% | 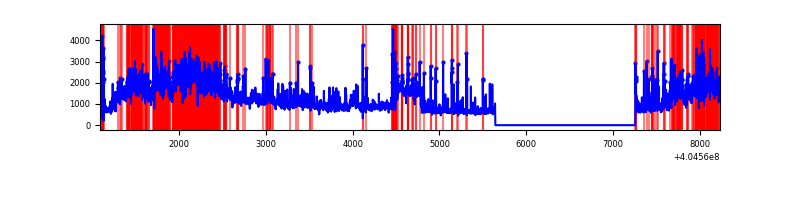 |
Top three noisy pixels from each quadrant. If the there are fewer than three noisy pixels in the level2.evt file, extra rows are filled as -1
| Pixel properties | Quadrant properties | ||||||
|---|---|---|---|---|---|---|---|
| Quadrant | DetID | PixID | Counts | Sigma | Mean | Median | Sigma |
| A | 10 | 83 | 370228 | 2974.42 | 613 | 600 | 124.3 |
| A | 12 | 16 | 102801 | 822.42 | 613 | 600 | 124.3 |
| A | 12 | 189 | 68478 | 546.22 | 613 | 600 | 124.3 |
| B | 5 | 172 | 102249 | 869.6 | 609 | 593 | 116.9 |
| B | 0 | 229 | 82139 | 697.57 | 609 | 593 | 116.9 |
| B | 0 | 183 | 44457 | 375.23 | 609 | 593 | 116.9 |
| C | 15 | 214 | 230977 | 1655.12 | 597 | 600 | 139.2 |
| C | 9 | 236 | 38052 | 269.07 | 597 | 600 | 139.2 |
| C | 15 | 208 | 13843 | 95.14 | 597 | 600 | 139.2 |
| D | 12 | 235 | 2194715 | 15805.58 | 572 | 556 | 138.8 |
| D | 10 | 203 | 1663673 | 11980.23 | 572 | 556 | 138.8 |
| D | 2 | 16 | 828031 | 5960.7 | 572 | 556 | 138.8 |
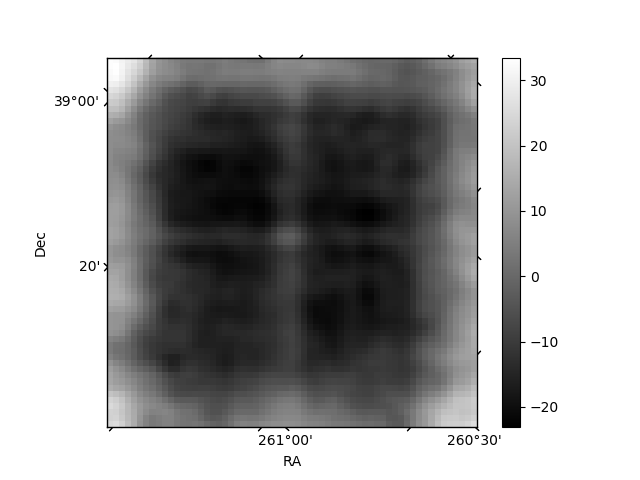
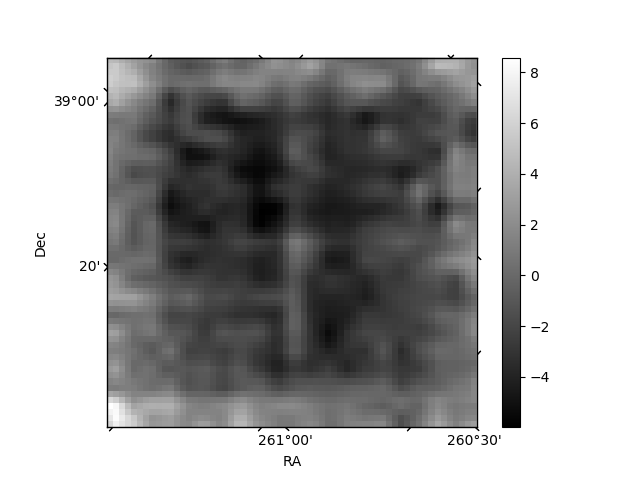
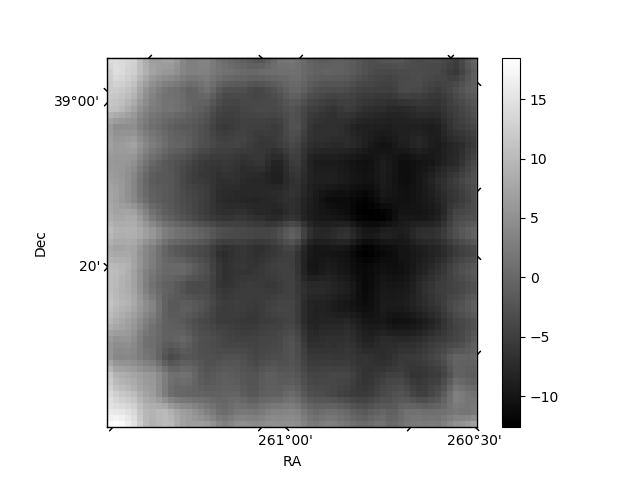
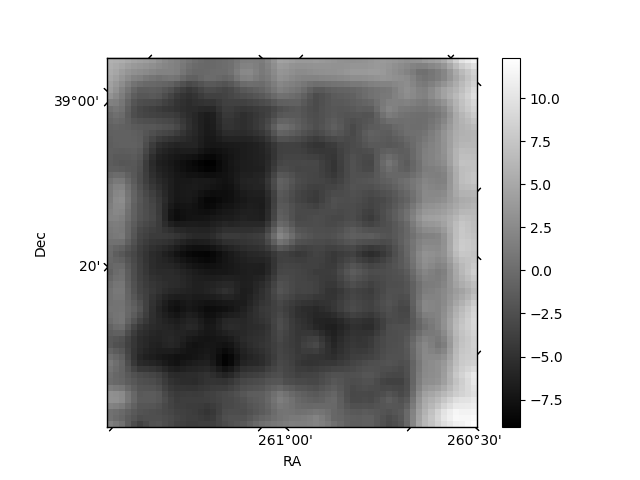
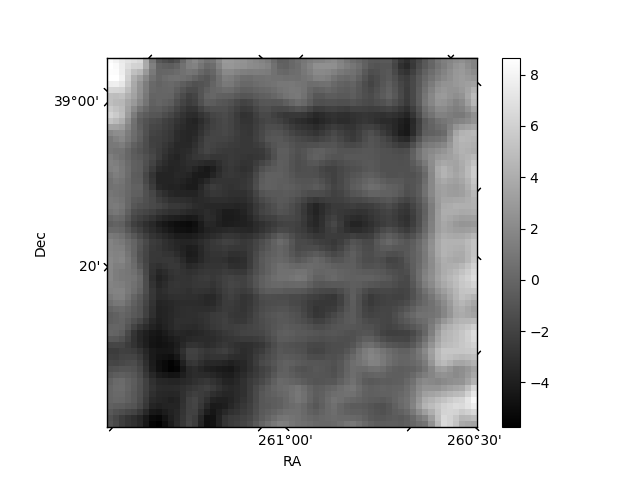
Histogram calculated using DETX and DETY for each event in the final _common_clean file
| Quadrant A | 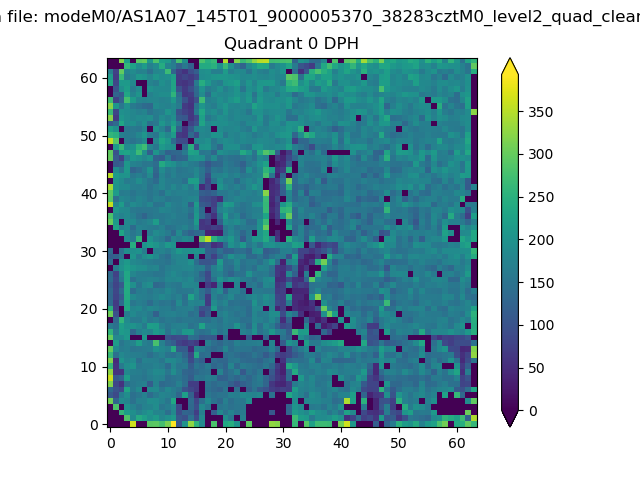 |
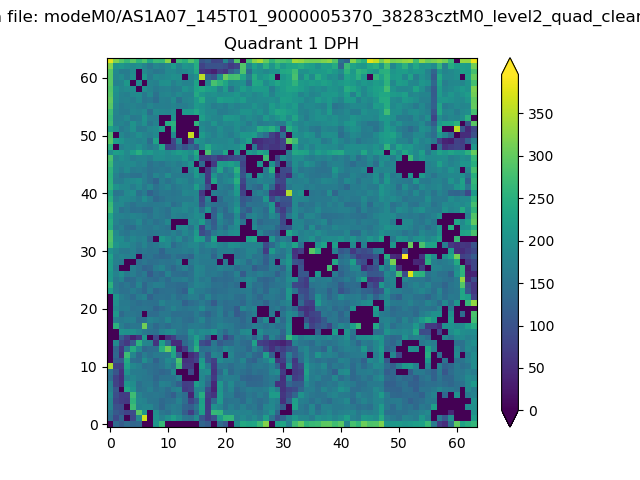 |
Quadrant B |
|---|---|---|---|
| Quadrant D | 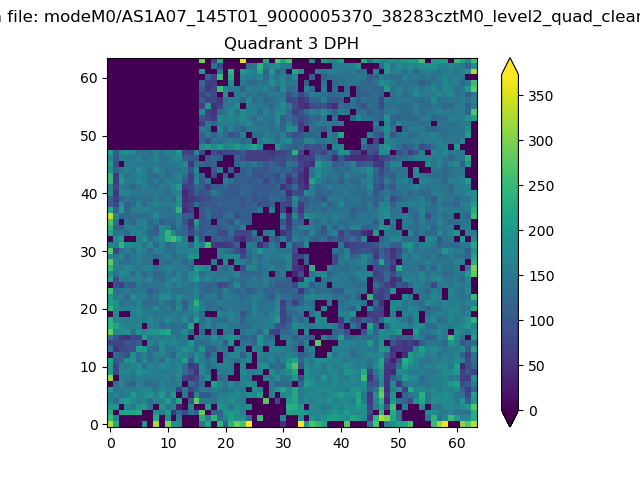 |
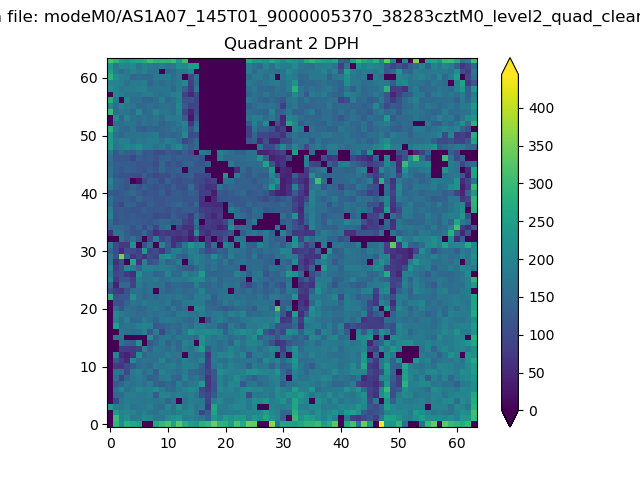 |
Quadrant C |
| Plot type | Count rate plots | Images |
|---|---|---|
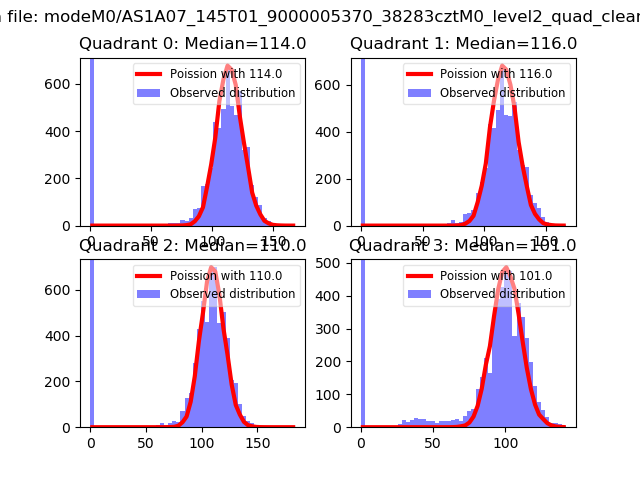
| Comparison with Poisson distribution Blue bars denote a histogram of data divided into 1 sec bins. Red curve is a Poisson curve with rate = median count rate of data. |
 |
 |
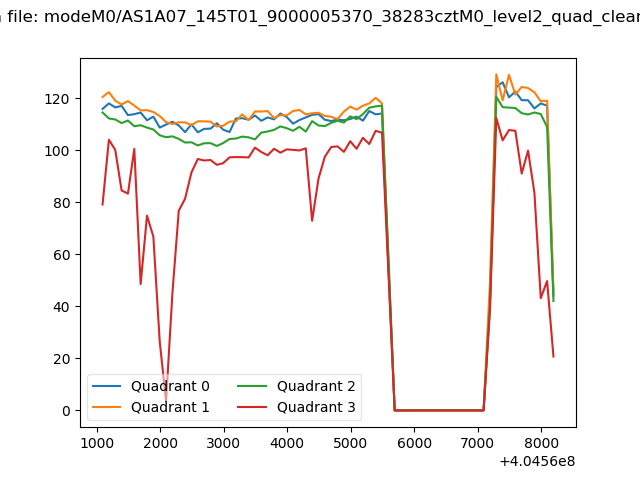
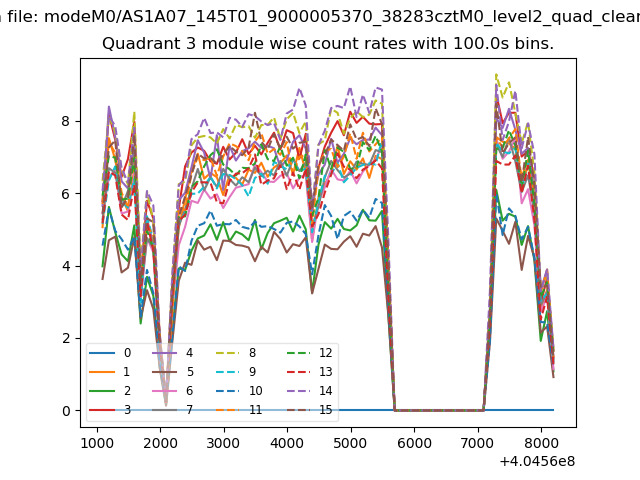
| Quadrant-wise count rates Data is divided into 100 sec bins |
 |
|
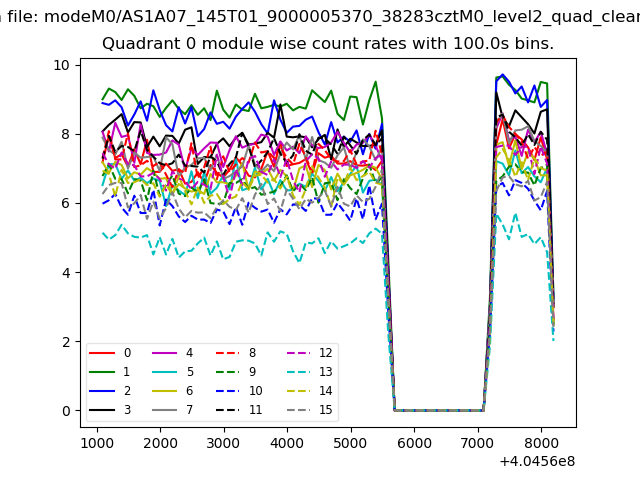
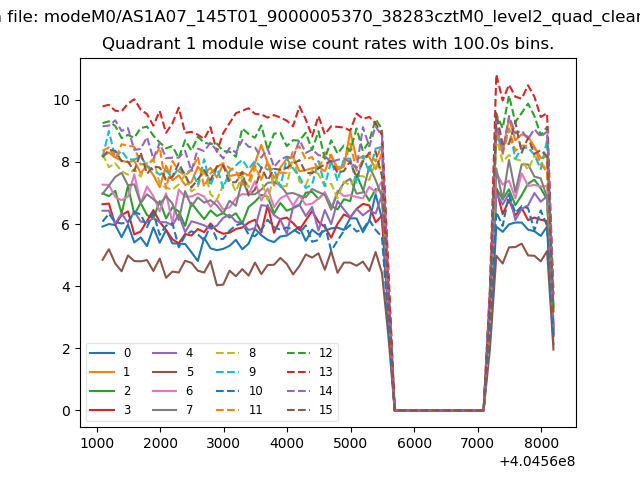
| Module-wise count rates for Quadrant A Data is divided into 100 sec bins |
 |
 |
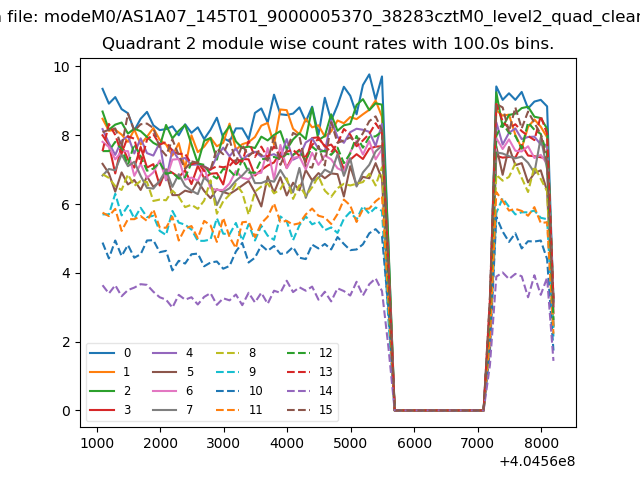
| Module-wise count rates for Quadrant B Data is divided into 100 sec bins |
 |
 |
| Module-wise count rates for Quadrant C Data is divided into 100 sec bins |
 |
 |
| Module-wise count rates for Quadrant D Data is divided into 100 sec bins |
 |
 |
| Parameter | Plot |
|---|---|
| CZT HV Monitor |  |
| D_VDD | 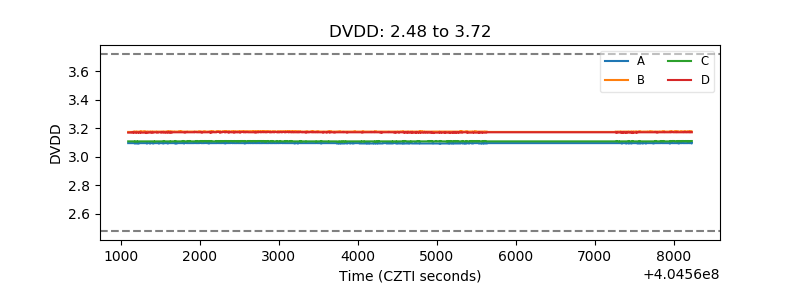 |
| Temperature 1 | 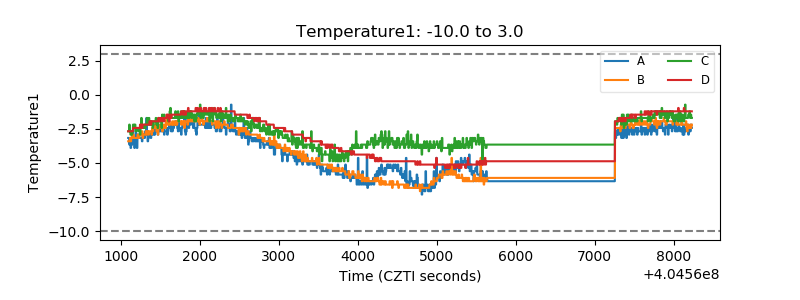 |
| Veto HV Monitor | 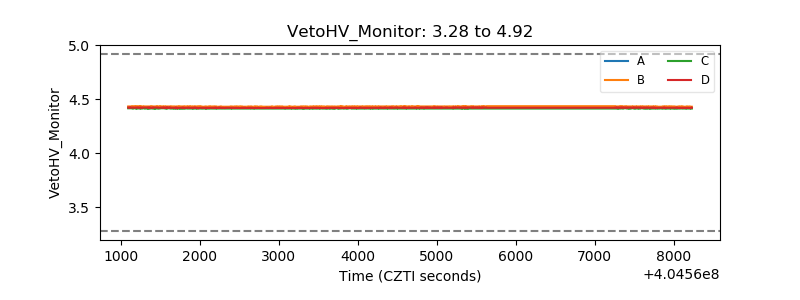 |
| Veto LLD | 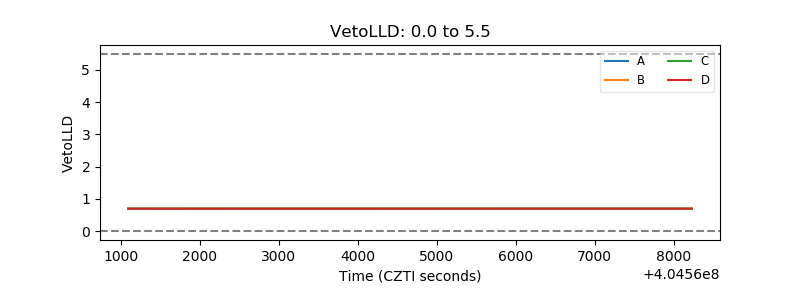 |
| Alpha Counter | 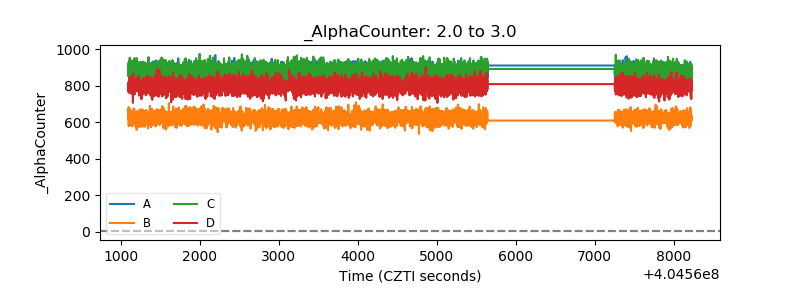 |
| _CPM_Rate | 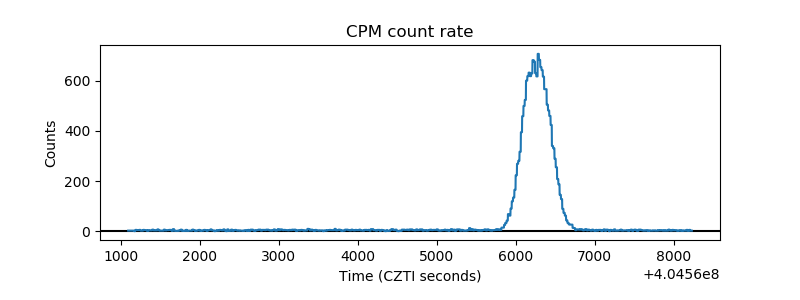 |
| CZT Counter | 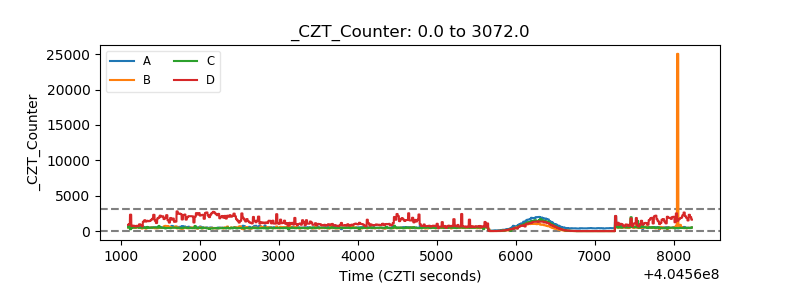 |
| +2.5 Volts monitor | 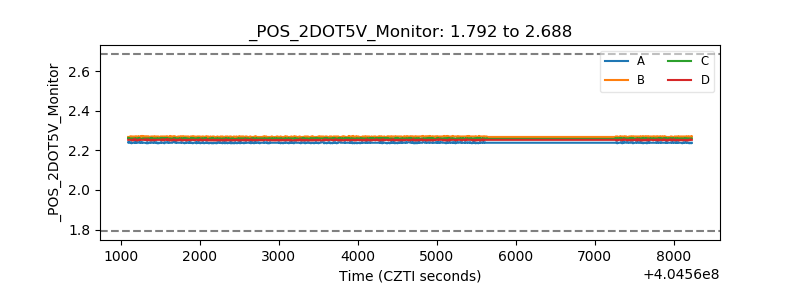 |
| +5 Volts monitor | 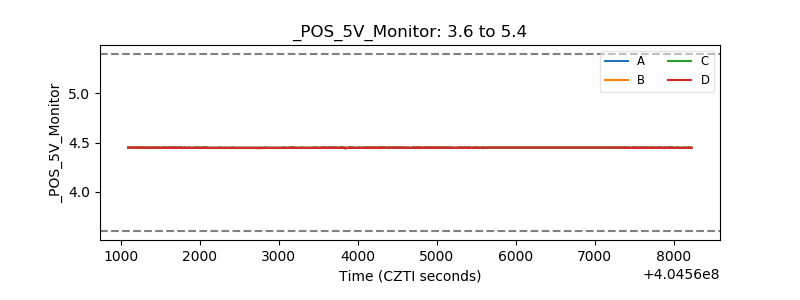 |
| _ROLL_ROT | 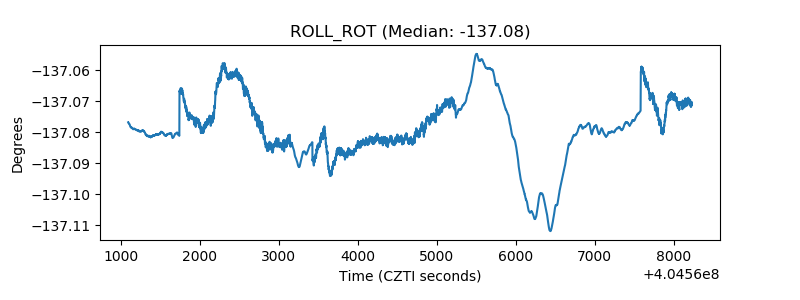 |
| _Roll_DEC | 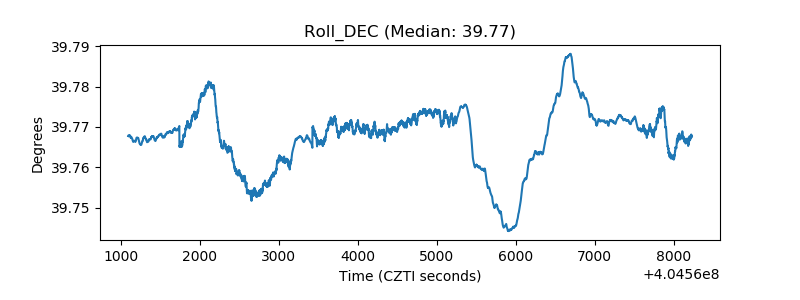 |
| _Roll_RA | 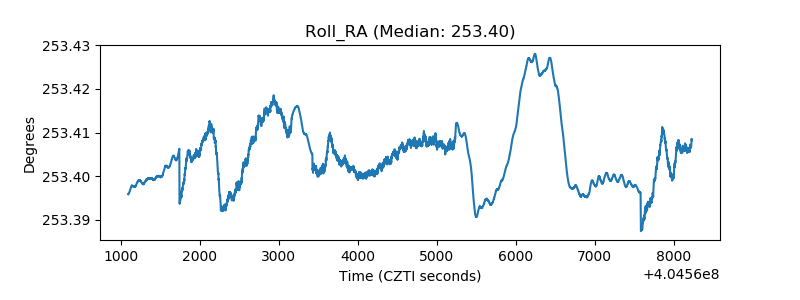 |
| Veto Counter | 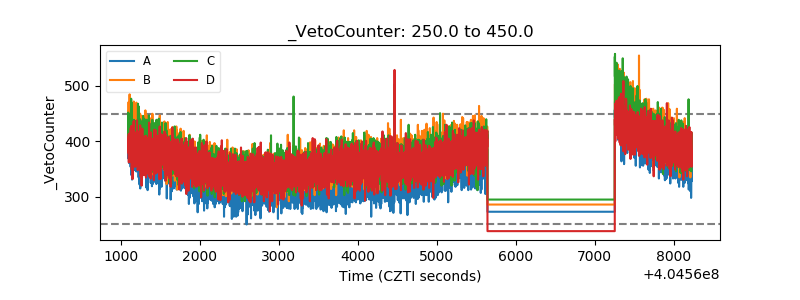 |