| Param | Original file | Final file |
|---|---|---|
| Filename | modeM0/AS1A07_145T01_9000005370_38286cztM0_level2.fits | modeM0/AS1A07_145T01_9000005370_38286cztM0_level2_quad_clean.evt |
| Size (bytes) | 526,893,120 | 86,232,960 |
| Size | 502.5 MB | 82.2 MB |
| Events in quadrant A | 2,810,421 | 638,843 |
| Events in quadrant B | 3,080,788 | 647,099 |
| Events in quadrant C | 2,948,489 | 619,849 |
| Events in quadrant D | 10,256,504 | 337,810 |
| Mode M9 | |||
|---|---|---|---|
| Quadrant | BADHDUFLAG | Total packets | Discarded packets |
| A | 0 | 19 | 0 |
| B | 0 | 19 | 0 |
| C | 0 | 19 | 0 |
| D | 0 | 19 | 0 |
| Mode SS | |||
|---|---|---|---|
| Quadrant | BADHDUFLAG | Total packets | Discarded packets |
| A | 0 | 106 | 0 |
| B | 0 | 106 | 0 |
| C | 0 | 106 | 0 |
| D | 0 | 106 | 0 |
| Mode M0 | |||
|---|---|---|---|
| Quadrant | BADHDUFLAG | Total packets | Discarded packets |
| A | 0 | 11479 | 2 |
| B | 0 | 12592 | 1 |
| C | 0 | 11887 | 1 |
| D | 0 | 34056 | 1 |
| Quadrant | Total seconds | Saturated seconds | Saturation percentage |
|---|---|---|---|
| A | 5246 | 8 | 0.152497% |
| B | 5246 | 113 | 2.154022% |
| C | 5246 | 42 | 0.800610% |
| D | 5246 | 2759 | 52.592451% |
Noise dominated data is calculated using 1-second bins in cleaned event files. If a bin has >2000 counts, and if more than 50% of those come from <1% of pixels, then it is considered to be noise-dominated and hence unusable.
| Quadrant | # 1 sec bins | Bins with >0 counts | Bins with >2000 counts | High rate bins dominated by noise | Noise dominated (total time) | Noise dominated (detector-on time) | Marked lightcurve |
|---|---|---|---|---|---|---|---|
| A | 7129 | 5247 | 3 | 3 | 0.04% | 0.06% | 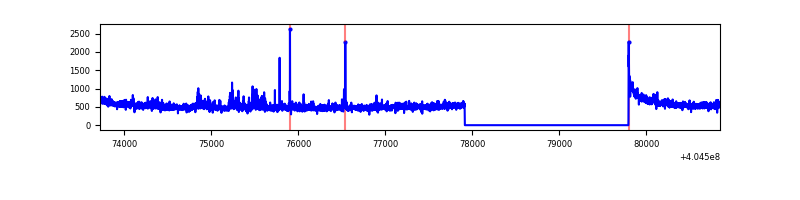 |
| B | 7129 | 5247 | 90 | 90 | 1.26% | 1.72% | 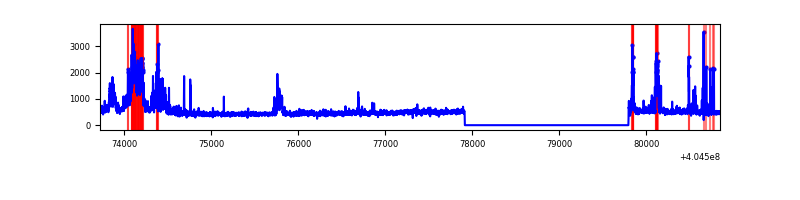 |
| C | 7129 | 5247 | 36 | 36 | 0.50% | 0.69% | 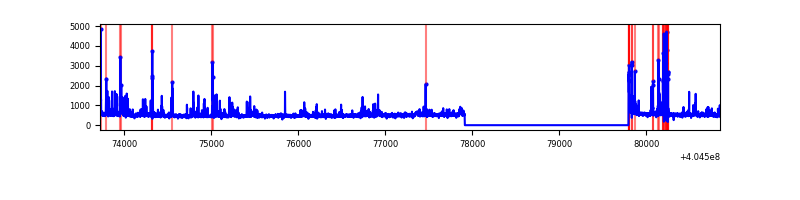 |
| D | 7129 | 5247 | 2381 | 2381 | 33.40% | 45.38% | 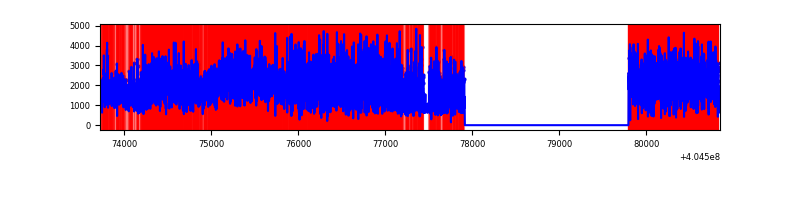 |
Top three noisy pixels from each quadrant. If the there are fewer than three noisy pixels in the level2.evt file, extra rows are filled as -1
| Pixel properties | Quadrant properties | ||||||
|---|---|---|---|---|---|---|---|
| Quadrant | DetID | PixID | Counts | Sigma | Mean | Median | Sigma |
| A | 10 | 83 | 339588 | 2796.6 | 600 | 588 | 121.2 |
| A | 12 | 16 | 91918 | 753.43 | 600 | 588 | 121.2 |
| A | 9 | 143 | 19535 | 156.3 | 600 | 588 | 121.2 |
| B | 5 | 184 | 431363 | 3796.39 | 598 | 581 | 113.5 |
| B | 5 | 172 | 240768 | 2116.71 | 598 | 581 | 113.5 |
| B | 15 | 85 | 23489 | 201.88 | 598 | 581 | 113.5 |
| C | 9 | 236 | 301634 | 2193.75 | 592 | 596 | 137.2 |
| C | 15 | 214 | 216368 | 1572.4 | 592 | 596 | 137.2 |
| C | 15 | 208 | 70898 | 512.31 | 592 | 596 | 137.2 |
| D | 2 | 16 | 5744826 | 48019.01 | 494 | 480 | 119.6 |
| D | 12 | 235 | 1809255 | 15120.19 | 494 | 480 | 119.6 |
| D | 12 | 233 | 333866 | 2786.89 | 494 | 480 | 119.6 |
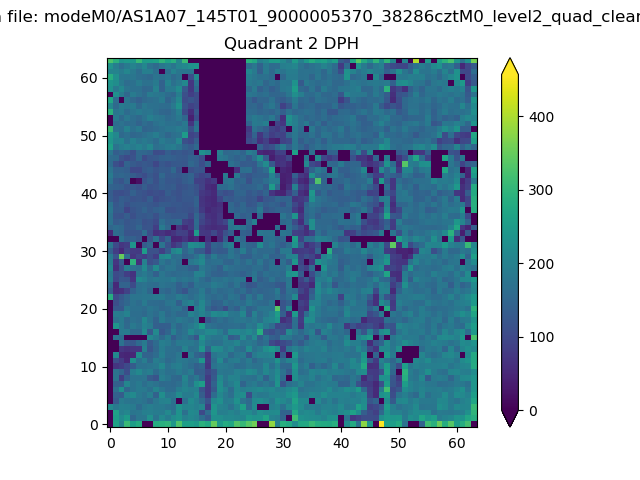
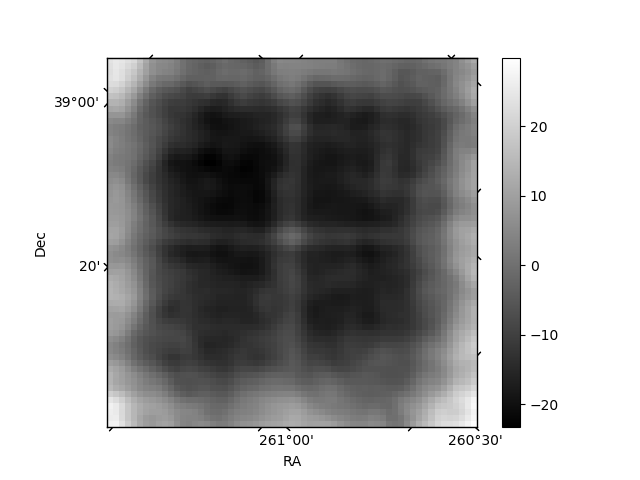
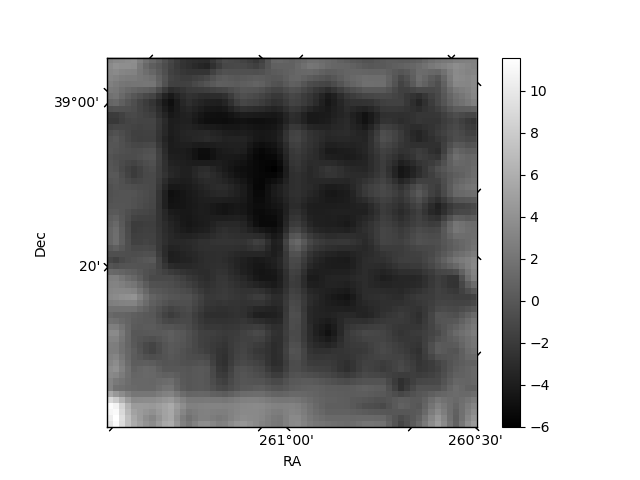
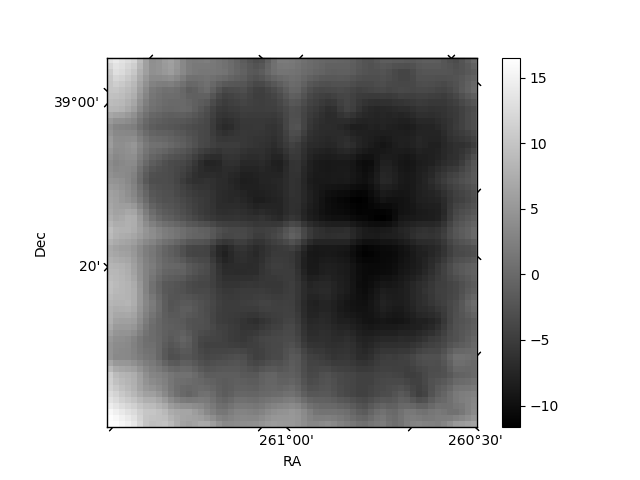
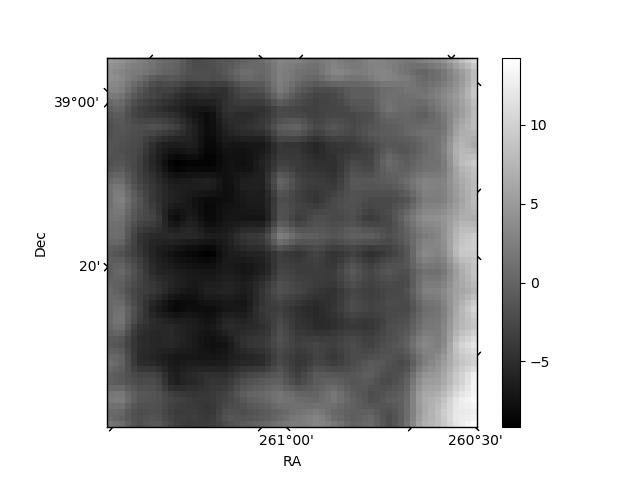
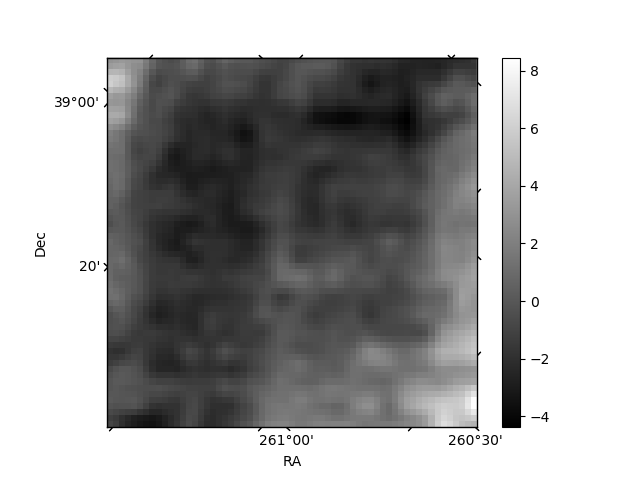
Histogram calculated using DETX and DETY for each event in the final _common_clean file
| Quadrant A | 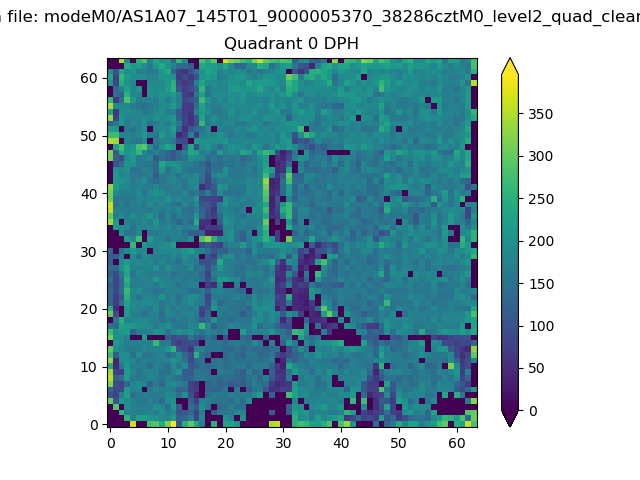 |
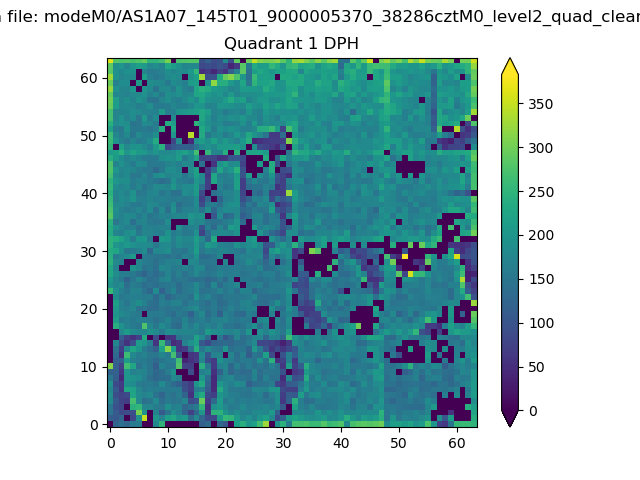 |
Quadrant B |
|---|---|---|---|
| Quadrant D | 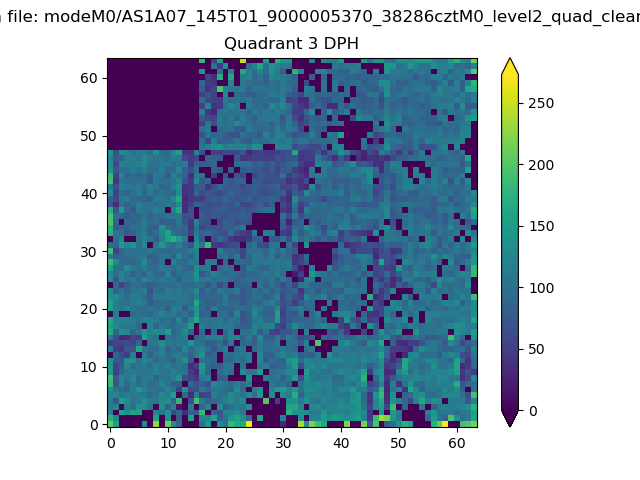 |
 |
Quadrant C |
| Plot type | Count rate plots | Images |
|---|---|---|
| Comparison with Poisson distribution Blue bars denote a histogram of data divided into 1 sec bins. Red curve is a Poisson curve with rate = median count rate of data. |
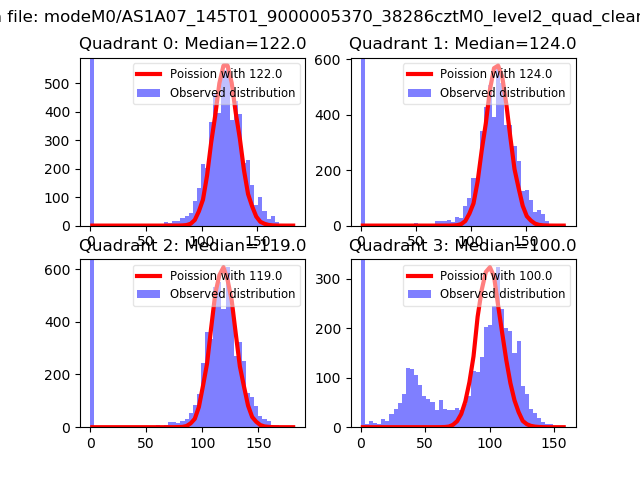 |
 |
| Quadrant-wise count rates Data is divided into 100 sec bins |
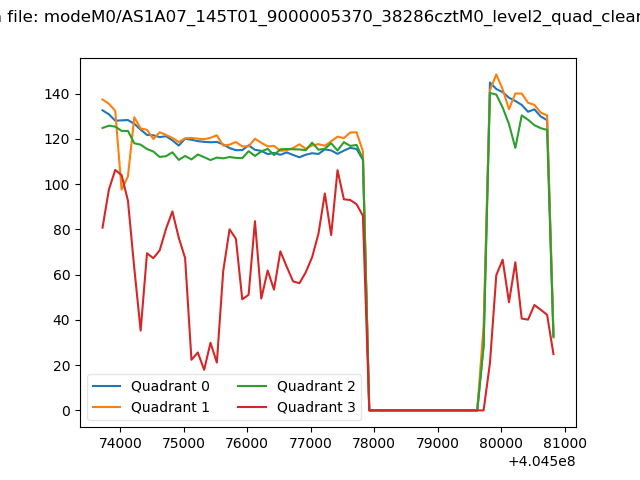 |
|
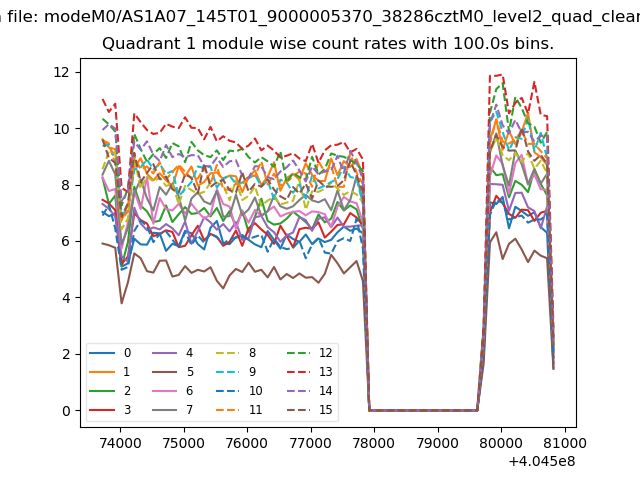
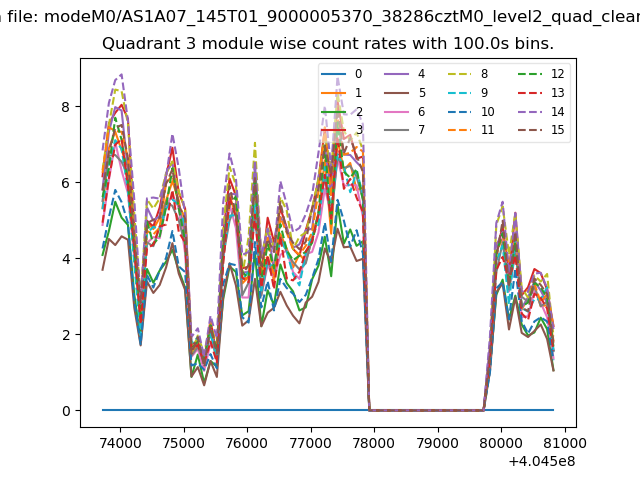
| Module-wise count rates for Quadrant A Data is divided into 100 sec bins |
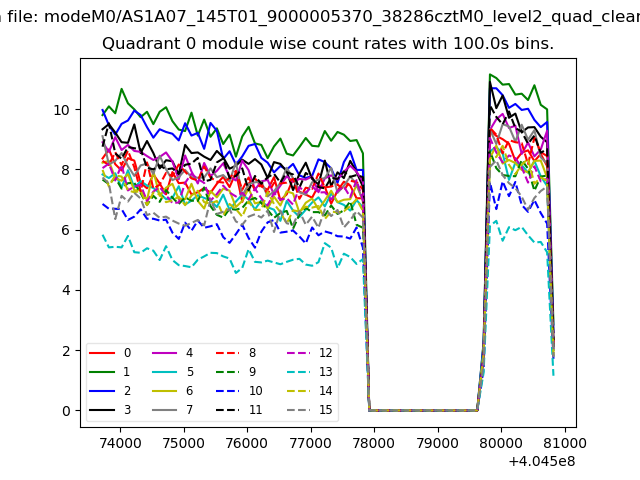 |
 |
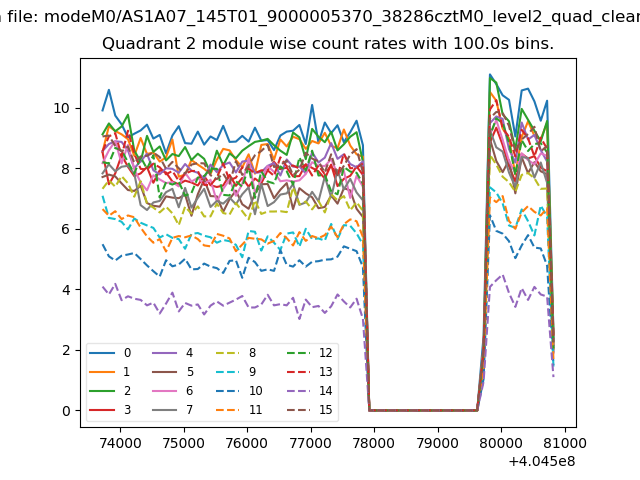
| Module-wise count rates for Quadrant B Data is divided into 100 sec bins |
 |
 |
| Module-wise count rates for Quadrant C Data is divided into 100 sec bins |
 |
 |
| Module-wise count rates for Quadrant D Data is divided into 100 sec bins |
 |
 |
| Parameter | Plot |
|---|---|
| CZT HV Monitor |  |
| D_VDD | 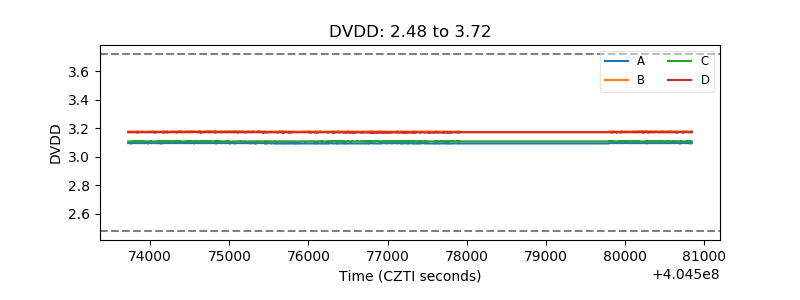 |
| Temperature 1 | 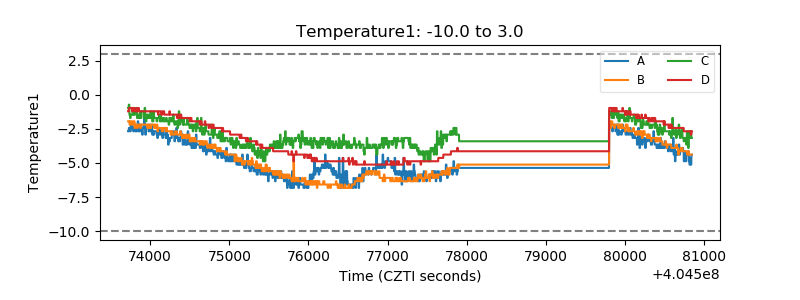 |
| Veto HV Monitor | 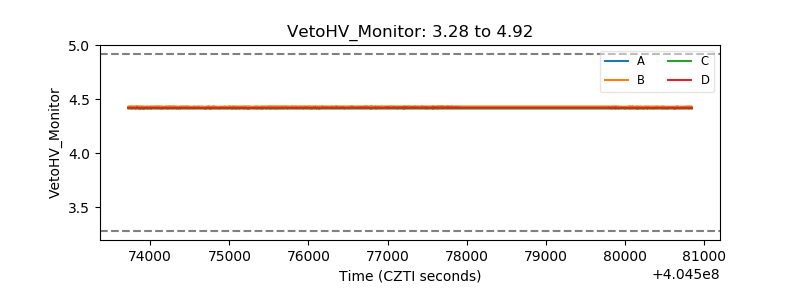 |
| Veto LLD | 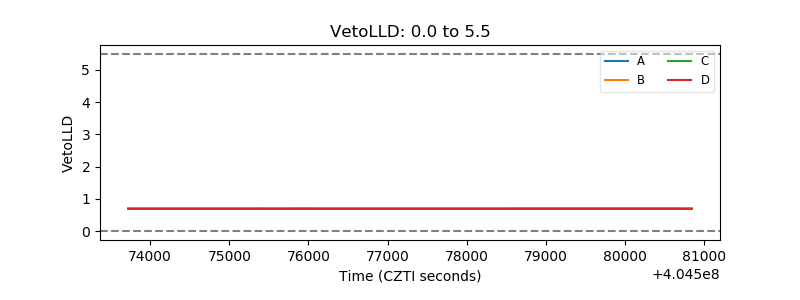 |
| Alpha Counter | 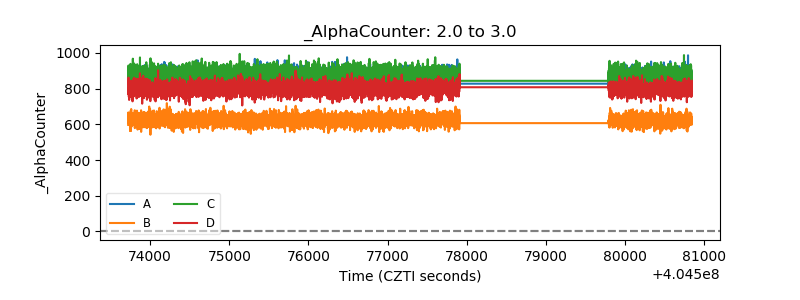 |
| _CPM_Rate |  |
| CZT Counter | 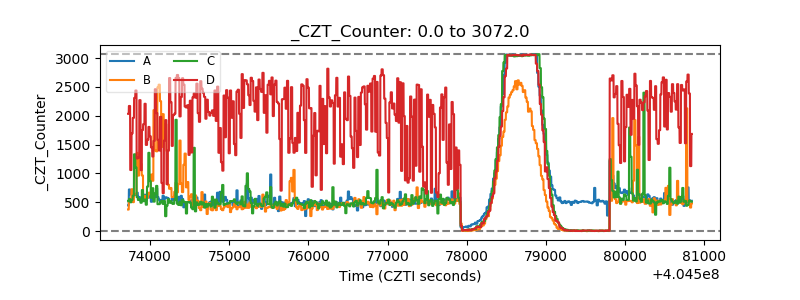 |
| +2.5 Volts monitor | 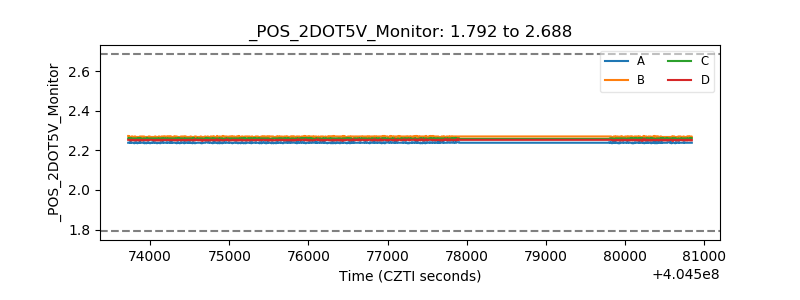 |
| +5 Volts monitor | 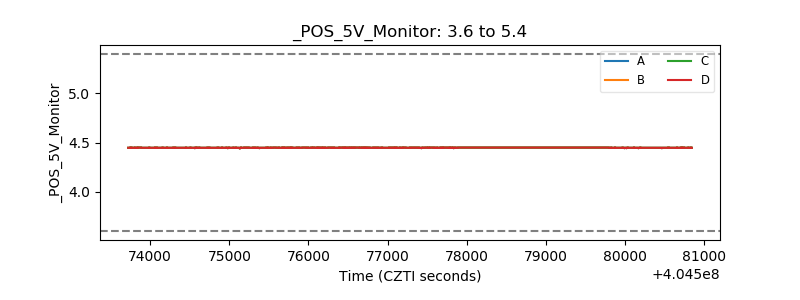 |
| _ROLL_ROT | 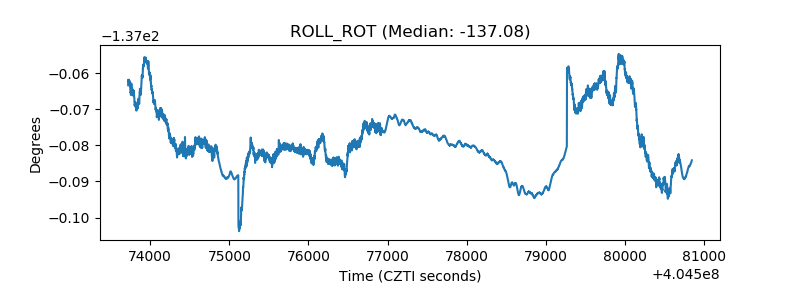 |
| _Roll_DEC | 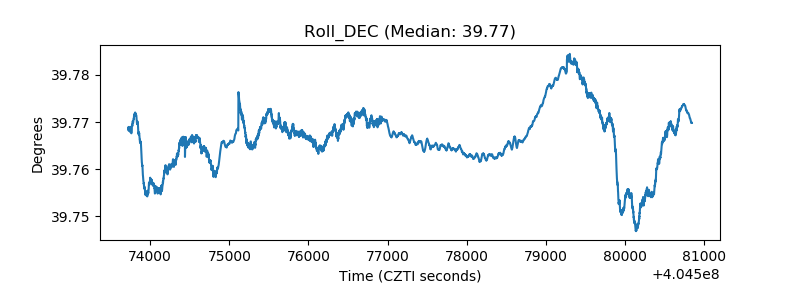 |
| _Roll_RA | 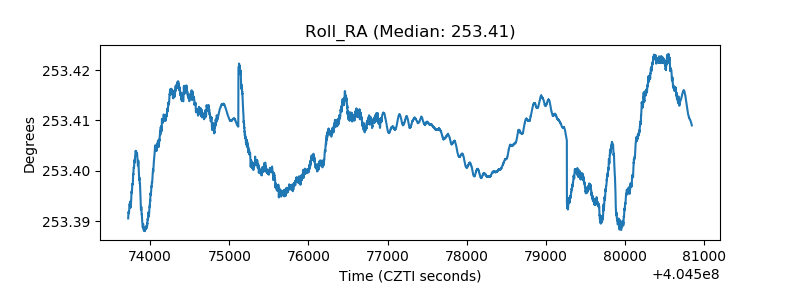 |
| Veto Counter | 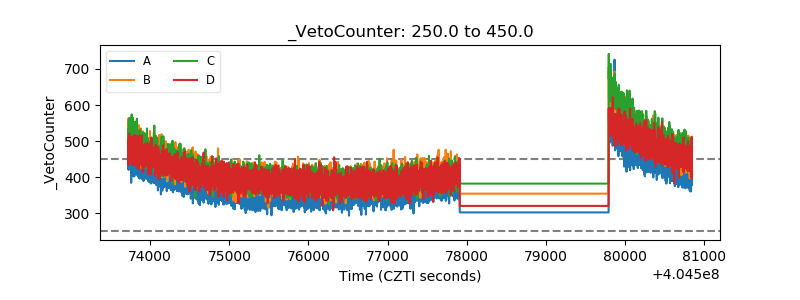 |