| Param | Original file | Final file |
|---|---|---|
| Filename | modeM0/AS1A07_145T01_9000005370_38287cztM0_level2.fits | modeM0/AS1A07_145T01_9000005370_38287cztM0_level2_quad_clean.evt |
| Size (bytes) | 477,299,520 | 86,618,880 |
| Size | 455.2 MB | 82.6 MB |
| Events in quadrant A | 2,819,225 | 641,929 |
| Events in quadrant B | 2,689,129 | 661,955 |
| Events in quadrant C | 3,061,043 | 630,254 |
| Events in quadrant D | 8,701,822 | 331,266 |
| Mode M9 | |||
|---|---|---|---|
| Quadrant | BADHDUFLAG | Total packets | Discarded packets |
| A | 0 | 22 | 0 |
| B | 0 | 22 | 0 |
| C | 0 | 22 | 0 |
| D | 0 | 23 | 0 |
| Mode SS | |||
|---|---|---|---|
| Quadrant | BADHDUFLAG | Total packets | Discarded packets |
| A | 0 | 104 | 0 |
| B | 0 | 104 | 0 |
| C | 0 | 104 | 0 |
| D | 0 | 104 | 0 |
| Mode M0 | |||
|---|---|---|---|
| Quadrant | BADHDUFLAG | Total packets | Discarded packets |
| A | 0 | 11435 | 3 |
| B | 0 | 11156 | 2 |
| C | 0 | 12134 | 2 |
| D | 0 | 29267 | 2 |
| Quadrant | Total seconds | Saturated seconds | Saturation percentage |
|---|---|---|---|
| A | 5101 | 17 | 0.333268% |
| B | 5101 | 46 | 0.901784% |
| C | 5101 | 84 | 1.646736% |
| D | 5101 | 2425 | 47.539698% |
Noise dominated data is calculated using 1-second bins in cleaned event files. If a bin has >2000 counts, and if more than 50% of those come from <1% of pixels, then it is considered to be noise-dominated and hence unusable.
| Quadrant | # 1 sec bins | Bins with >0 counts | Bins with >2000 counts | High rate bins dominated by noise | Noise dominated (total time) | Noise dominated (detector-on time) | Marked lightcurve |
|---|---|---|---|---|---|---|---|
| A | 7103 | 5102 | 9 | 9 | 0.13% | 0.18% | 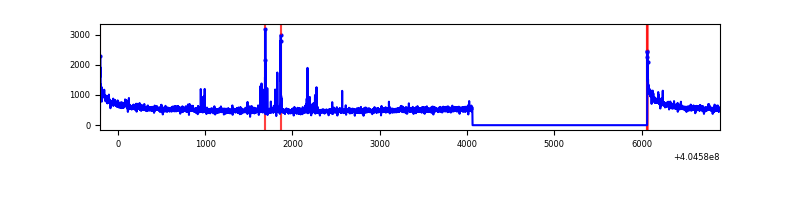 |
| B | 7103 | 5102 | 31 | 31 | 0.44% | 0.61% | 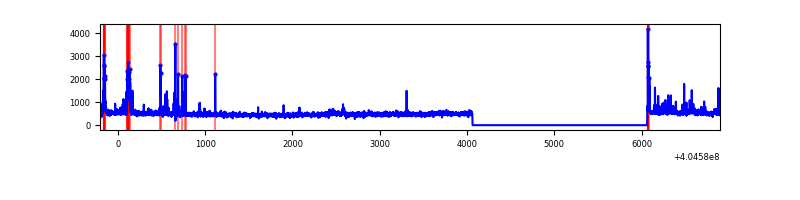 |
| C | 7103 | 5102 | 66 | 66 | 0.93% | 1.29% | 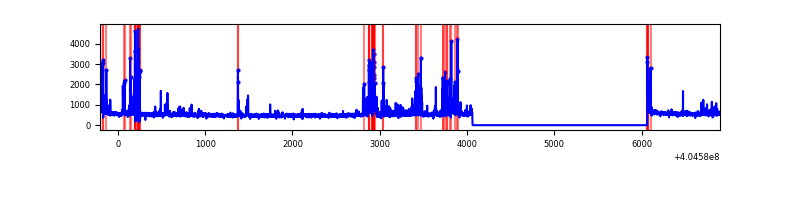 |
| D | 7103 | 5102 | 2183 | 2183 | 30.73% | 42.79% | 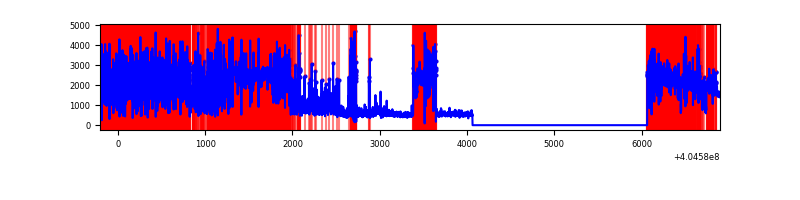 |
Top three noisy pixels from each quadrant. If the there are fewer than three noisy pixels in the level2.evt file, extra rows are filled as -1
| Pixel properties | Quadrant properties | ||||||
|---|---|---|---|---|---|---|---|
| Quadrant | DetID | PixID | Counts | Sigma | Mean | Median | Sigma |
| A | 10 | 83 | 385252 | 3170.04 | 599 | 588 | 121.3 |
| A | 9 | 143 | 56715 | 462.55 | 599 | 588 | 121.3 |
| A | 12 | 16 | 22005 | 176.5 | 599 | 588 | 121.3 |
| B | 5 | 184 | 124152 | 1062.88 | 603 | 587 | 116.3 |
| B | 5 | 172 | 89382 | 763.79 | 603 | 587 | 116.3 |
| B | 0 | 229 | 39459 | 334.37 | 603 | 587 | 116.3 |
| C | 9 | 236 | 407956 | 2973.38 | 593 | 600 | 137.0 |
| C | 15 | 214 | 212190 | 1544.44 | 593 | 600 | 137.0 |
| C | 15 | 208 | 49579 | 357.51 | 593 | 600 | 137.0 |
| D | 1 | 47 | 2628593 | 24012.38 | 451 | 438 | 109.5 |
| D | 2 | 16 | 2432795 | 22223.45 | 451 | 438 | 109.5 |
| D | 10 | 203 | 744950 | 6802.3 | 451 | 438 | 109.5 |
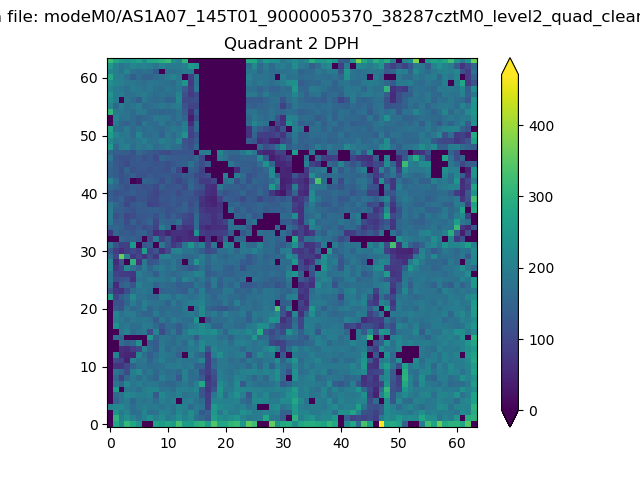
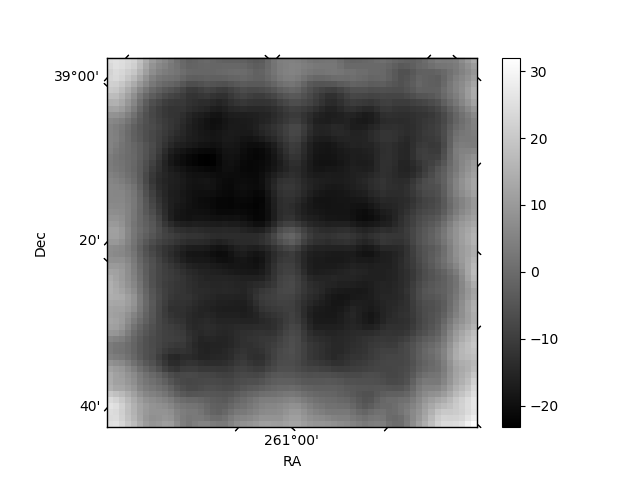
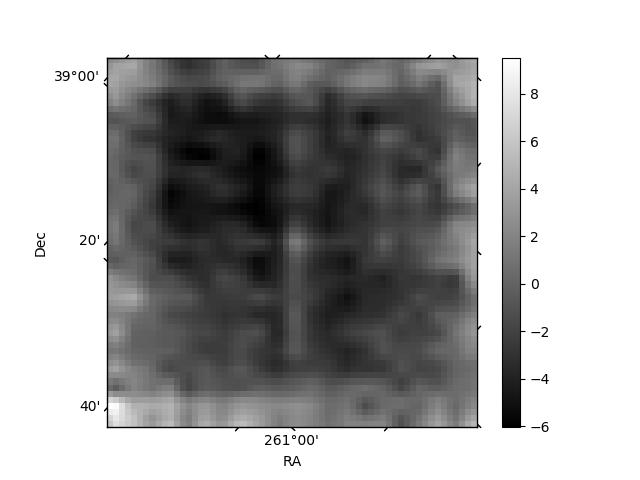
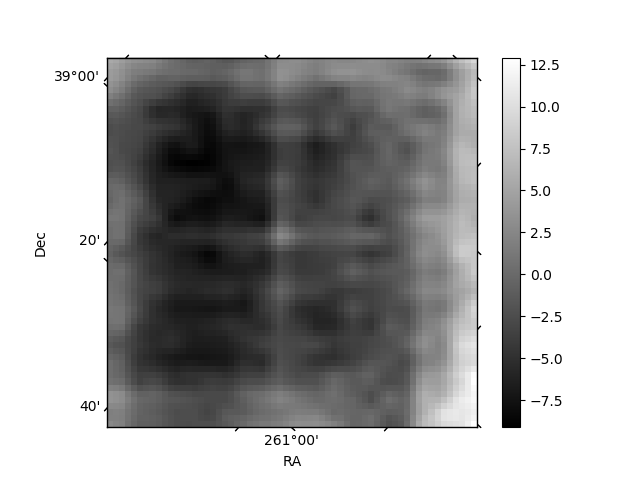
Histogram calculated using DETX and DETY for each event in the final _common_clean file
| Quadrant A | 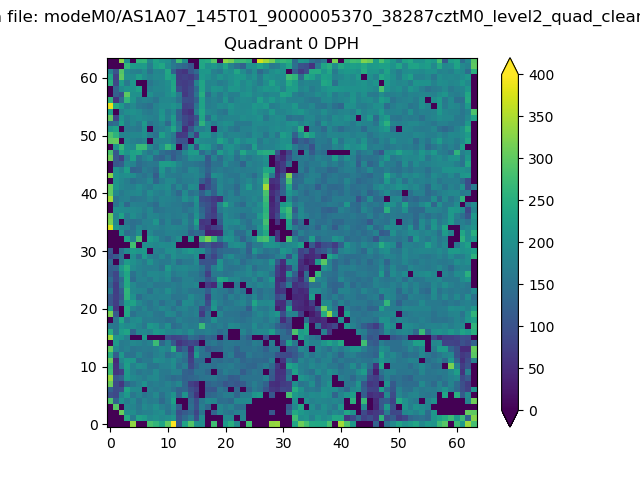 |
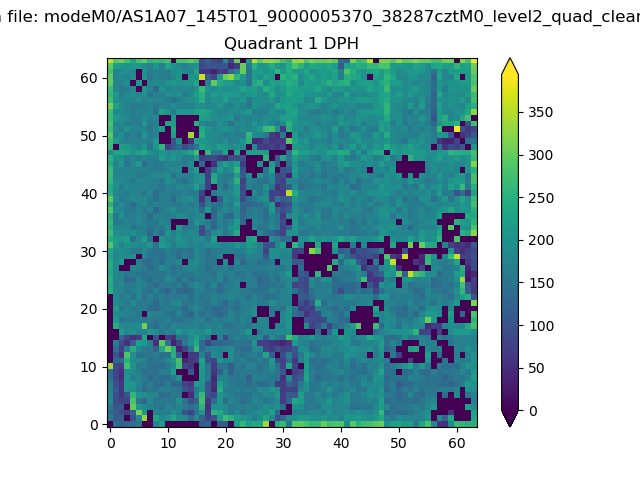 |
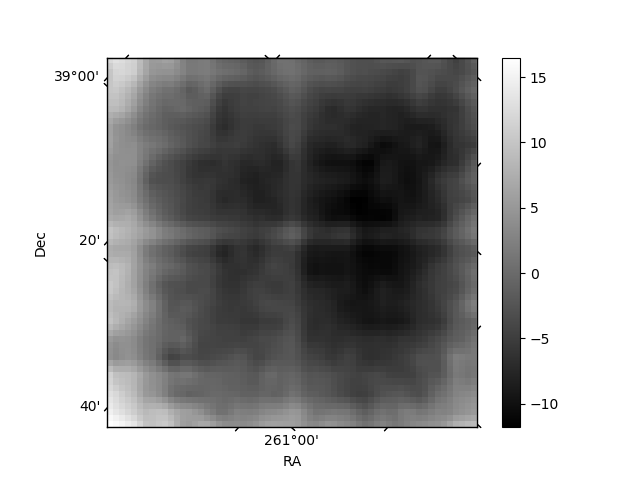
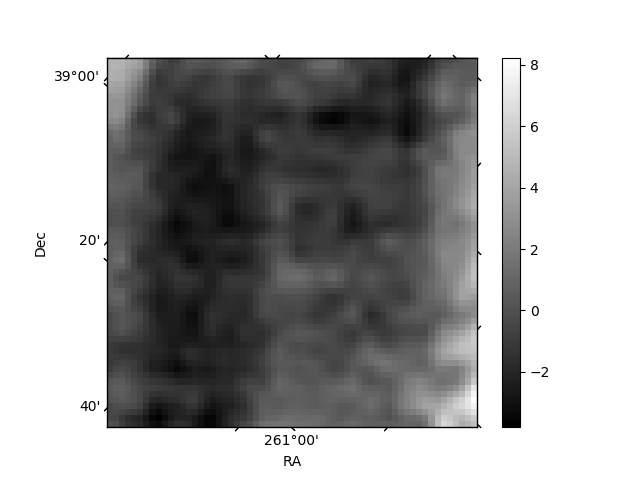
Quadrant B |
|---|---|---|---|
| Quadrant D | 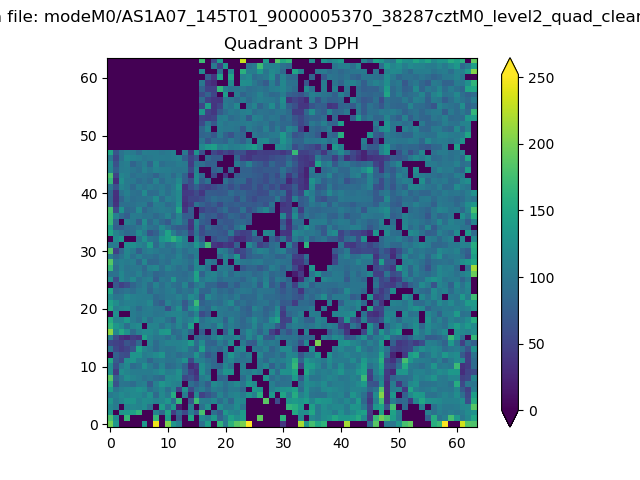 |
 |
Quadrant C |
| Plot type | Count rate plots | Images |
|---|---|---|
| Comparison with Poisson distribution Blue bars denote a histogram of data divided into 1 sec bins. Red curve is a Poisson curve with rate = median count rate of data. |
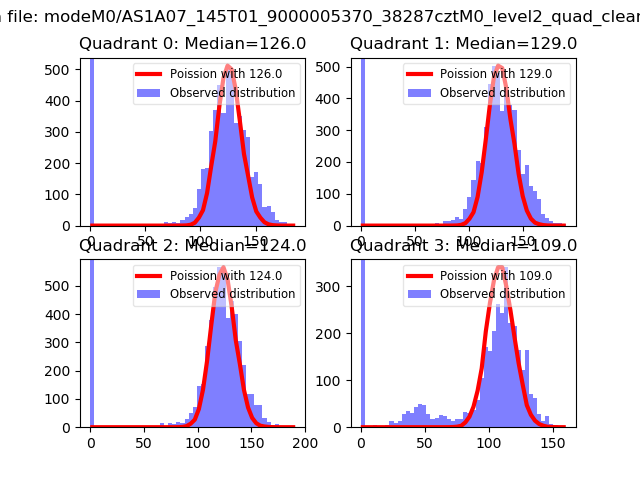 |
 |
| Quadrant-wise count rates Data is divided into 100 sec bins |
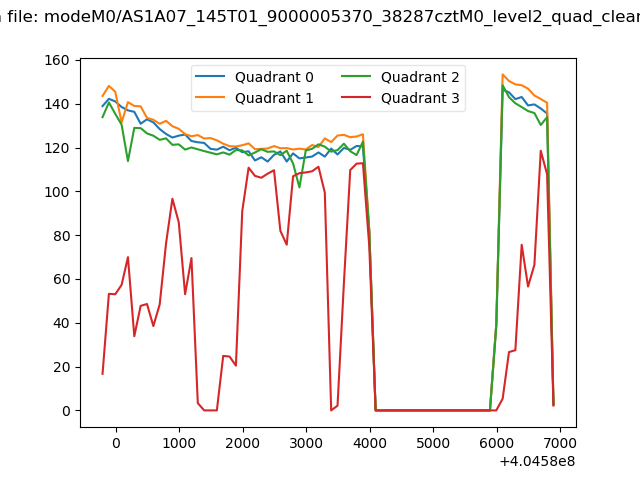 |
|
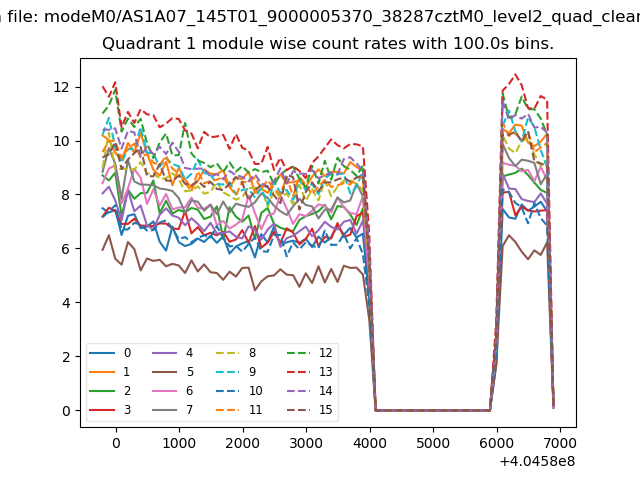
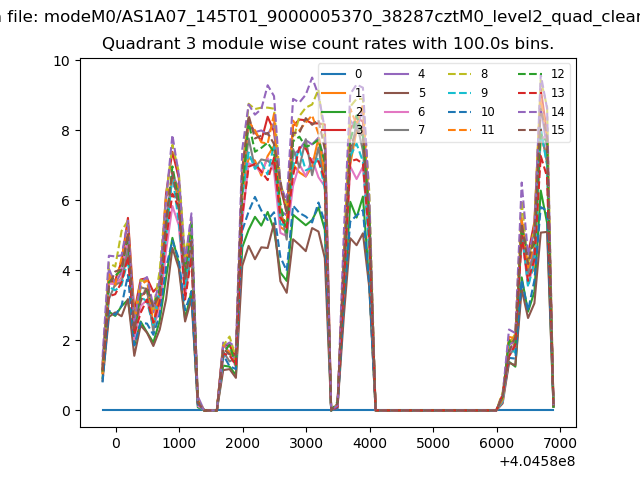
| Module-wise count rates for Quadrant A Data is divided into 100 sec bins |
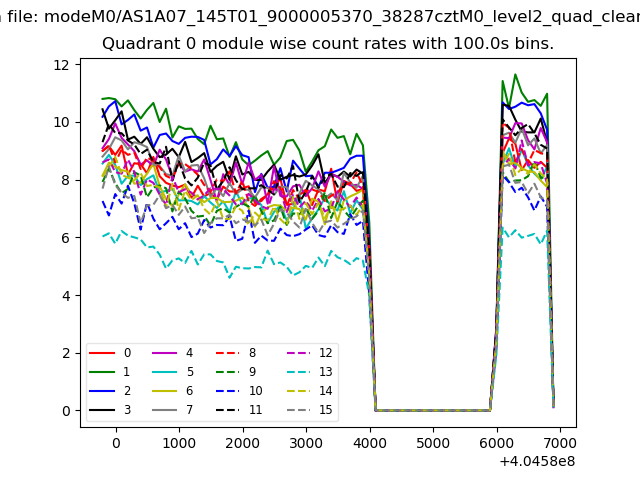 |
 |
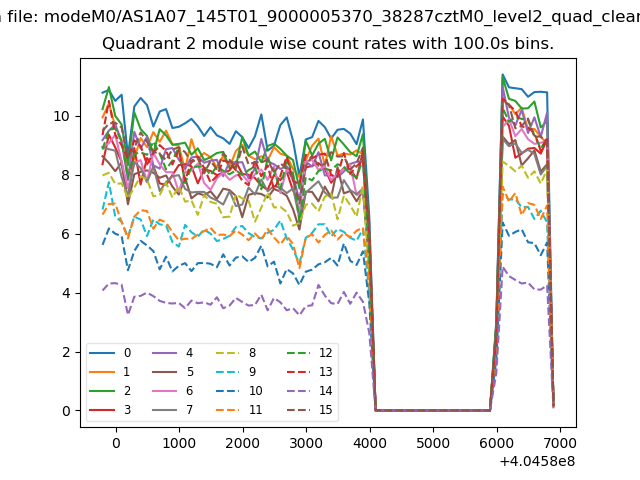
| Module-wise count rates for Quadrant B Data is divided into 100 sec bins |
 |
 |
| Module-wise count rates for Quadrant C Data is divided into 100 sec bins |
 |
 |
| Module-wise count rates for Quadrant D Data is divided into 100 sec bins |
 |
 |
| Parameter | Plot |
|---|---|
| CZT HV Monitor | 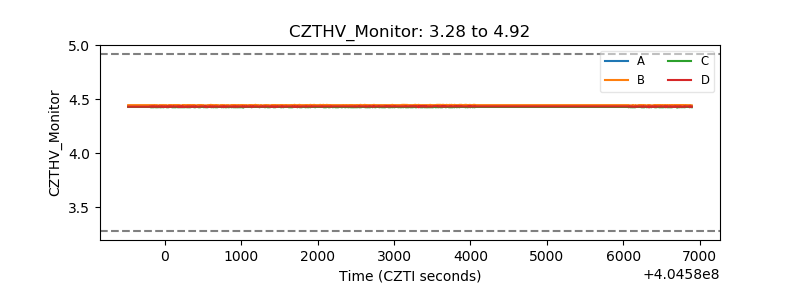 |
| D_VDD | 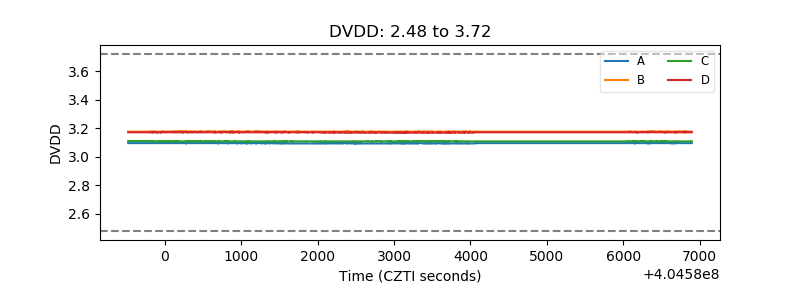 |
| Temperature 1 | 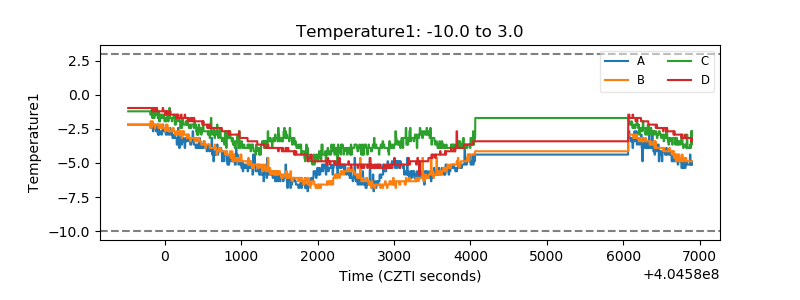 |
| Veto HV Monitor | 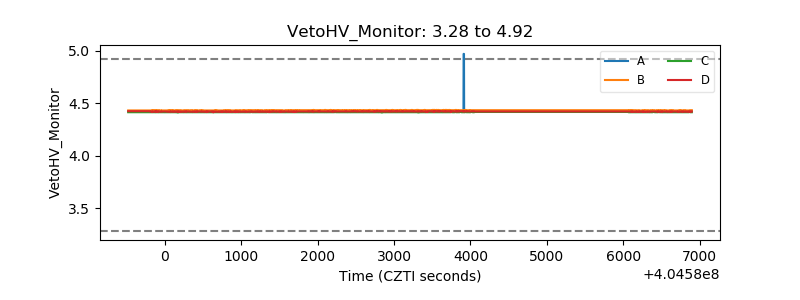 |
| Veto LLD | 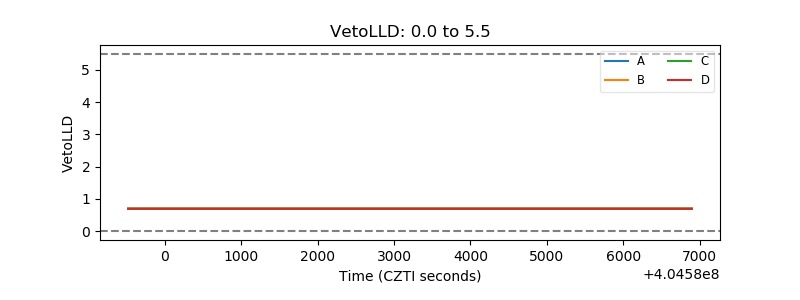 |
| Alpha Counter |  |
| _CPM_Rate | 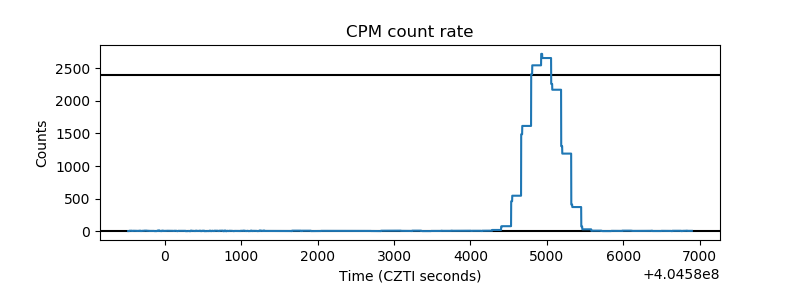 |
| CZT Counter | 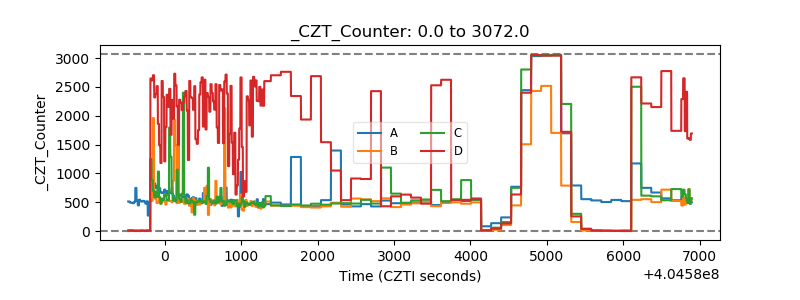 |
| +2.5 Volts monitor | 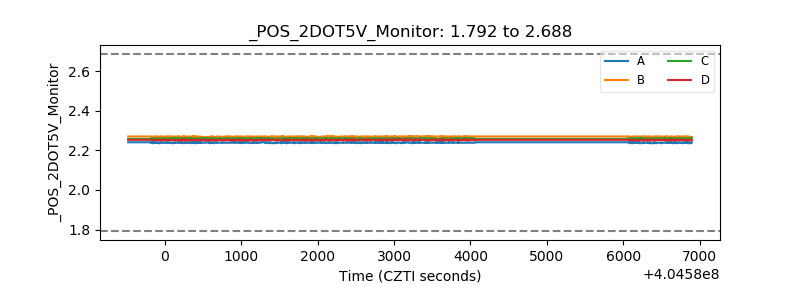 |
| +5 Volts monitor | 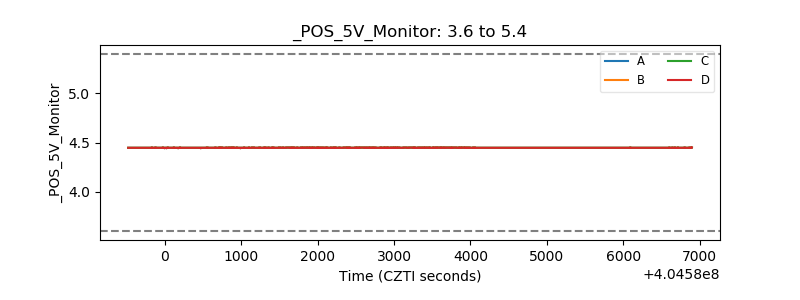 |
| _ROLL_ROT | 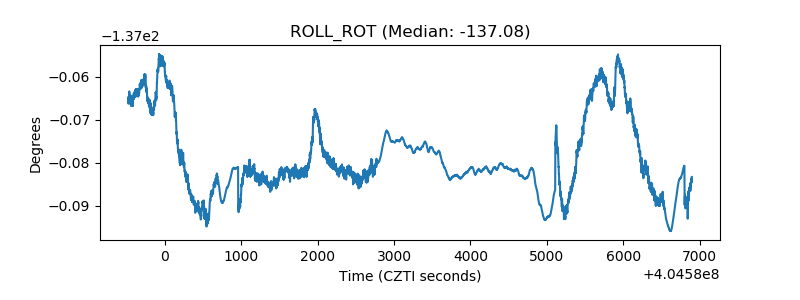 |
| _Roll_DEC | 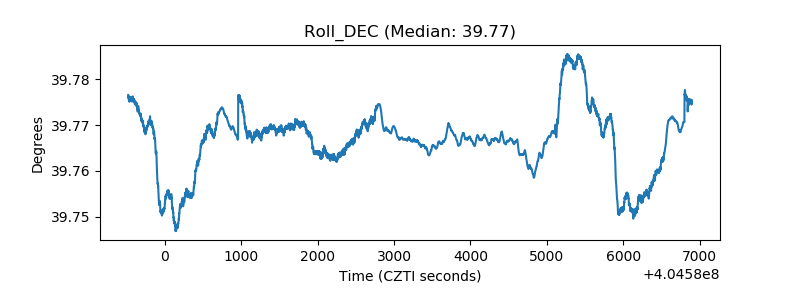 |
| _Roll_RA | 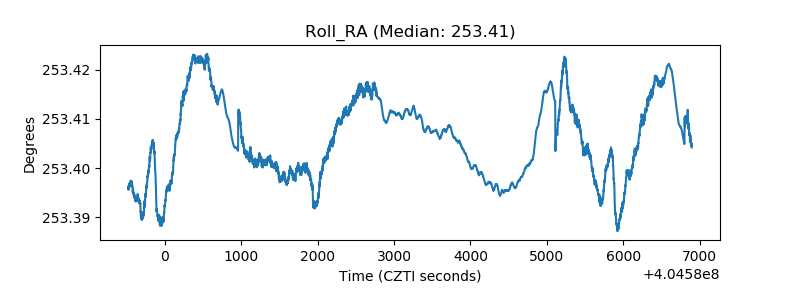 |
| Veto Counter | 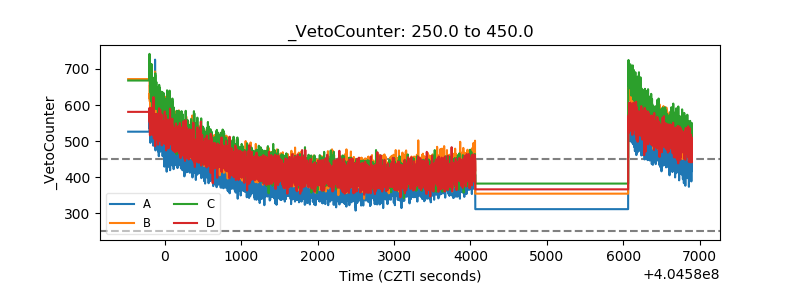 |