| Param | Original file | Final file |
|---|---|---|
| Filename | modeM0/AS1A07_145T01_9000005370_38288cztM0_level2.fits | modeM0/AS1A07_145T01_9000005370_38288cztM0_level2_quad_clean.evt |
| Size (bytes) | 489,165,120 | 88,119,360 |
| Size | 466.5 MB | 84.0 MB |
| Events in quadrant A | 2,886,914 | 634,634 |
| Events in quadrant B | 2,721,040 | 661,130 |
| Events in quadrant C | 2,927,047 | 631,653 |
| Events in quadrant D | 9,185,027 | 391,144 |
| Mode M9 | |||
|---|---|---|---|
| Quadrant | BADHDUFLAG | Total packets | Discarded packets |
| A | 0 | 28 | 0 |
| B | 0 | 28 | 0 |
| C | 0 | 28 | 0 |
| D | 0 | 29 | 0 |
| Mode SS | |||
|---|---|---|---|
| Quadrant | BADHDUFLAG | Total packets | Discarded packets |
| A | 0 | 102 | 0 |
| B | 0 | 102 | 0 |
| C | 0 | 102 | 0 |
| D | 0 | 102 | 0 |
| Mode M0 | |||
|---|---|---|---|
| Quadrant | BADHDUFLAG | Total packets | Discarded packets |
| A | 0 | 11623 | 3 |
| B | 0 | 11207 | 2 |
| C | 0 | 11581 | 2 |
| D | 0 | 30725 | 2 |
| Quadrant | Total seconds | Saturated seconds | Saturation percentage |
|---|---|---|---|
| A | 4990 | 15 | 0.300601% |
| B | 4990 | 26 | 0.521042% |
| C | 4990 | 57 | 1.142285% |
| D | 4990 | 1882 | 37.715431% |
Noise dominated data is calculated using 1-second bins in cleaned event files. If a bin has >2000 counts, and if more than 50% of those come from <1% of pixels, then it is considered to be noise-dominated and hence unusable.
| Quadrant | # 1 sec bins | Bins with >0 counts | Bins with >2000 counts | High rate bins dominated by noise | Noise dominated (total time) | Noise dominated (detector-on time) | Marked lightcurve |
|---|---|---|---|---|---|---|---|
| A | 7084 | 4991 | 8 | 8 | 0.11% | 0.16% | 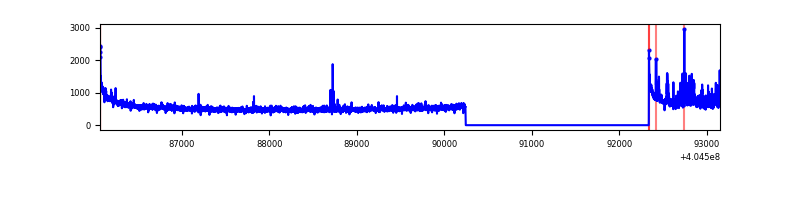 |
| B | 7084 | 4991 | 11 | 11 | 0.16% | 0.22% | 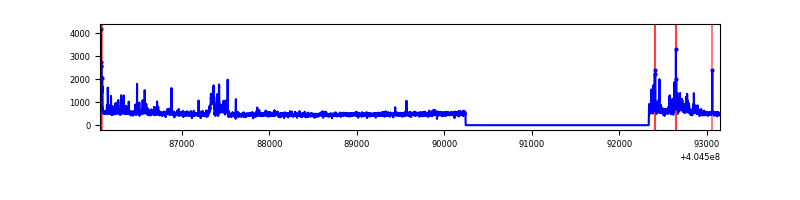 |
| C | 7084 | 4991 | 42 | 42 | 0.59% | 0.84% | 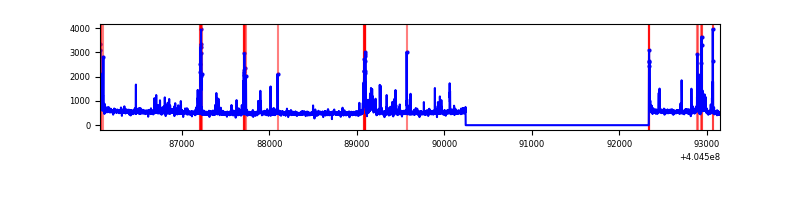 |
| D | 7084 | 4991 | 1884 | 1884 | 26.60% | 37.75% | 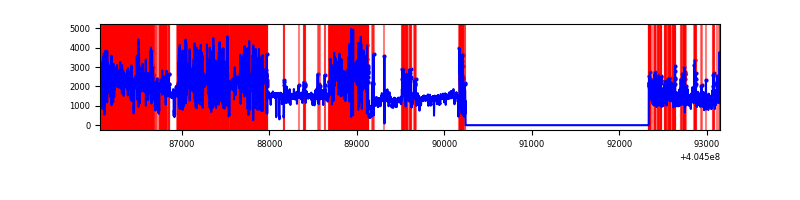 |
Top three noisy pixels from each quadrant. If the there are fewer than three noisy pixels in the level2.evt file, extra rows are filled as -1
| Pixel properties | Quadrant properties | ||||||
|---|---|---|---|---|---|---|---|
| Quadrant | DetID | PixID | Counts | Sigma | Mean | Median | Sigma |
| A | 10 | 83 | 375804 | 3149.85 | 589 | 579 | 119.1 |
| A | 12 | 16 | 142568 | 1191.94 | 589 | 579 | 119.1 |
| A | 9 | 143 | 36449 | 301.11 | 589 | 579 | 119.1 |
| B | 5 | 184 | 134398 | 1185.7 | 595 | 581 | 112.9 |
| B | 0 | 229 | 115990 | 1022.59 | 595 | 581 | 112.9 |
| B | 5 | 172 | 43910 | 383.92 | 595 | 581 | 112.9 |
| C | 15 | 214 | 211839 | 1542.36 | 591 | 596 | 137.0 |
| C | 14 | 254 | 145768 | 1059.95 | 591 | 596 | 137.0 |
| C | 15 | 208 | 119176 | 865.79 | 591 | 596 | 137.0 |
| D | 10 | 203 | 3947793 | 32834.49 | 492 | 479 | 120.2 |
| D | 1 | 47 | 1918082 | 15950.98 | 492 | 479 | 120.2 |
| D | 2 | 16 | 495912 | 4121.1 | 492 | 479 | 120.2 |
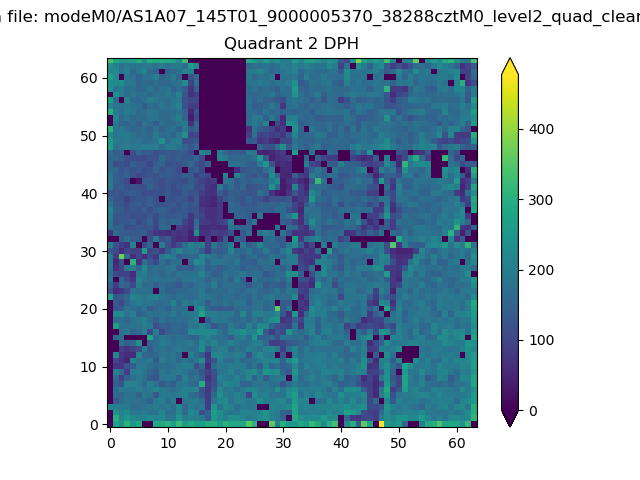
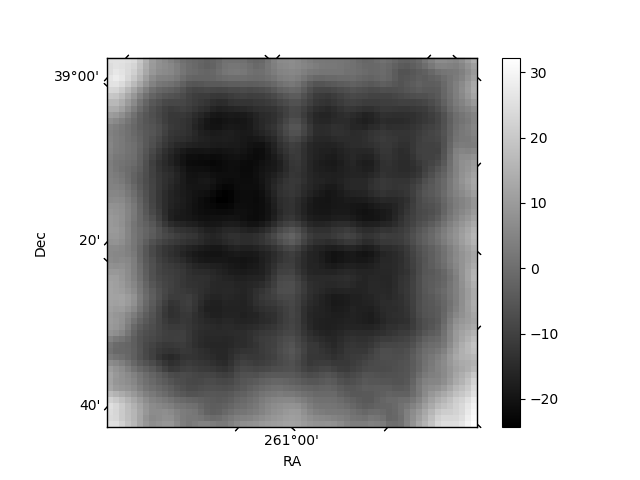
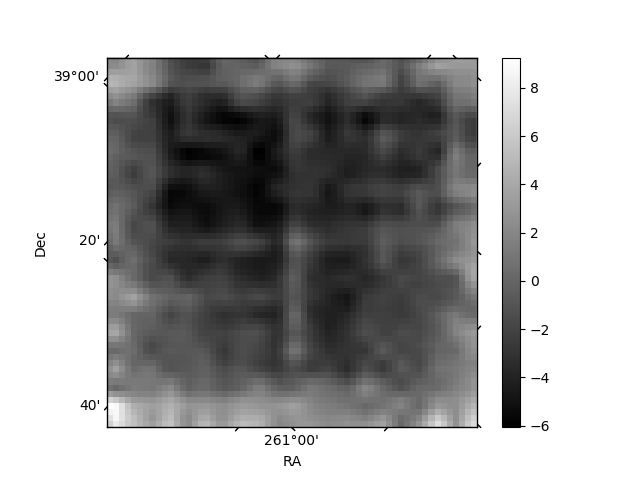
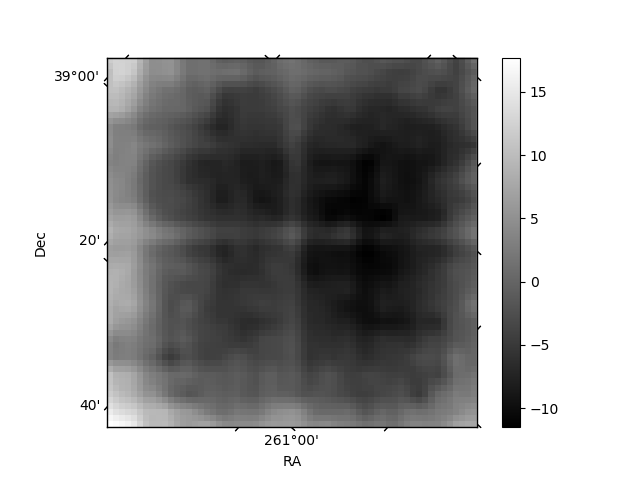
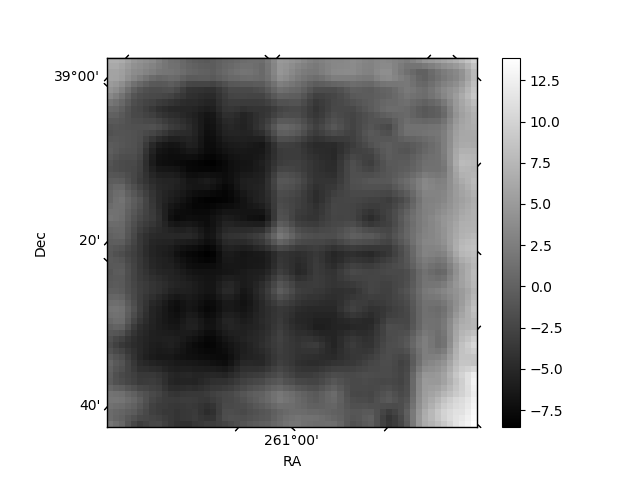
Histogram calculated using DETX and DETY for each event in the final _common_clean file
| Quadrant A | 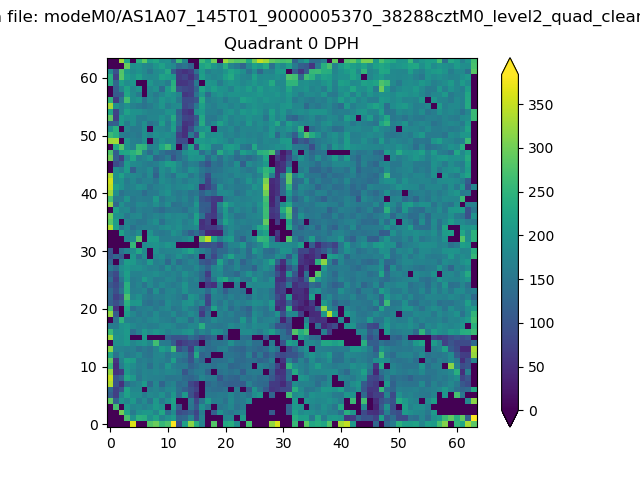 |
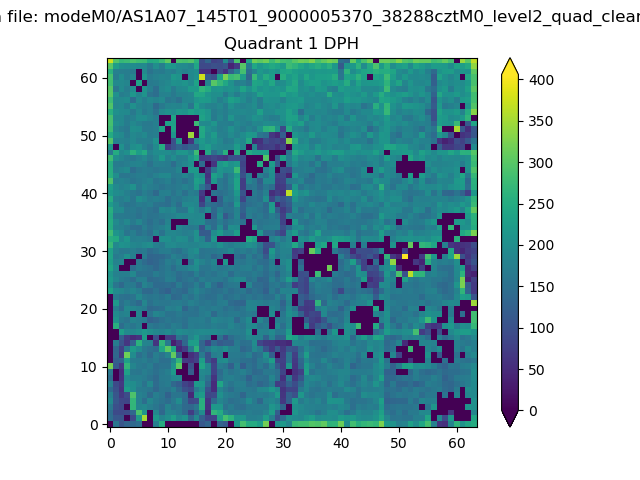 |
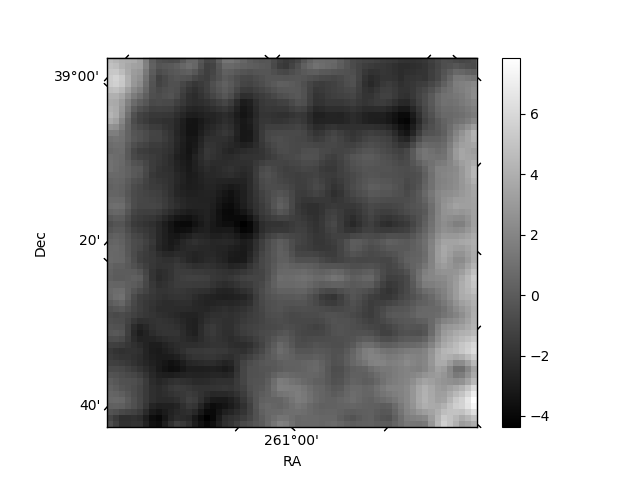
Quadrant B |
|---|---|---|---|
| Quadrant D | 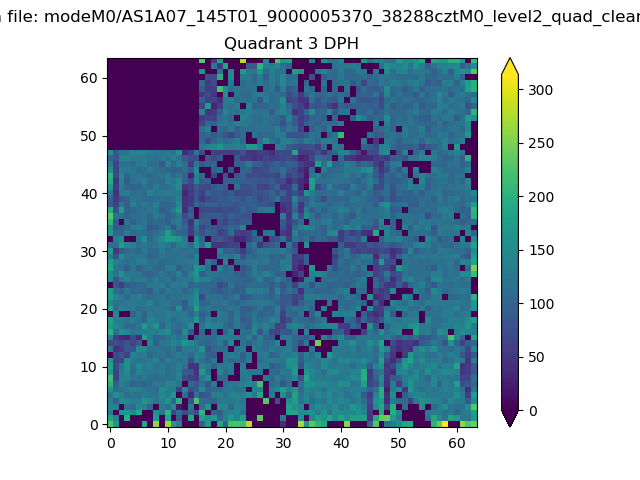 |
 |
Quadrant C |
| Plot type | Count rate plots | Images |
|---|---|---|
| Comparison with Poisson distribution Blue bars denote a histogram of data divided into 1 sec bins. Red curve is a Poisson curve with rate = median count rate of data. |
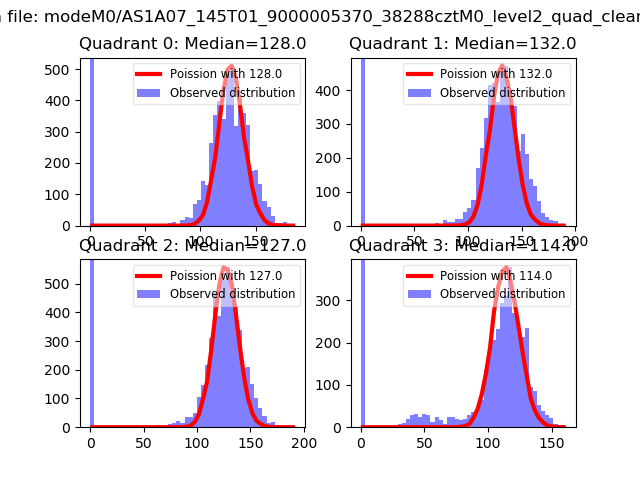 |
 |
| Quadrant-wise count rates Data is divided into 100 sec bins |
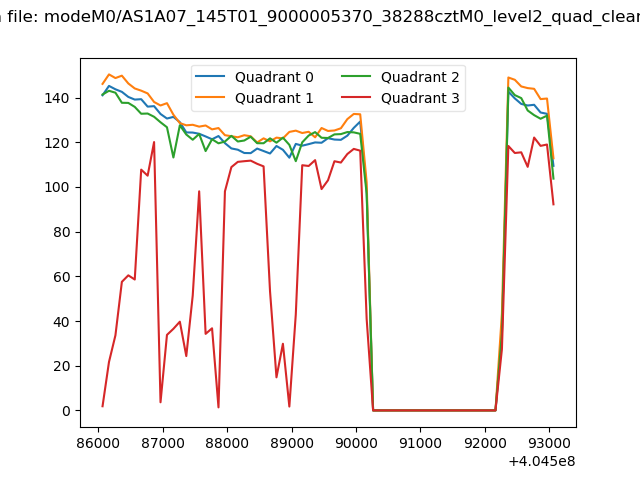 |
|
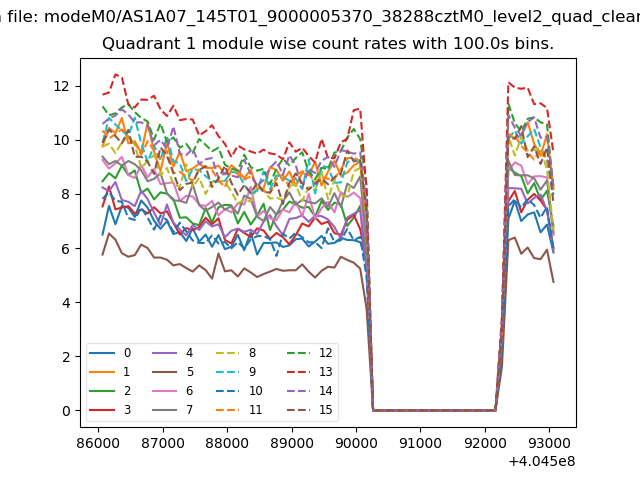
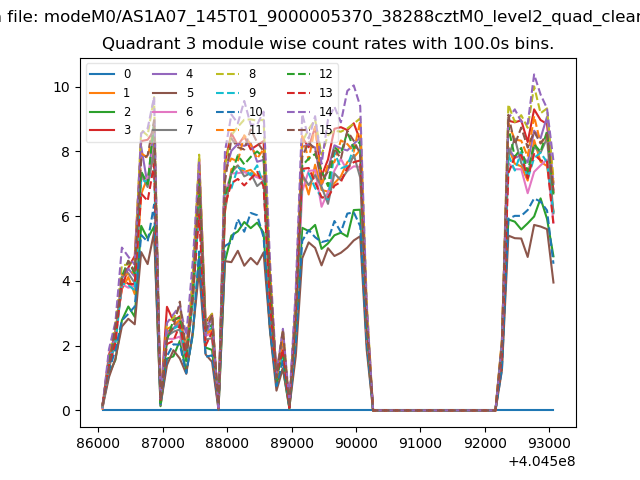
| Module-wise count rates for Quadrant A Data is divided into 100 sec bins |
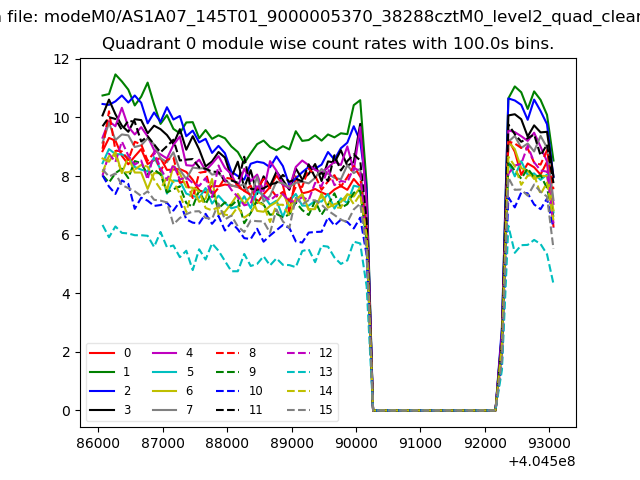 |
 |
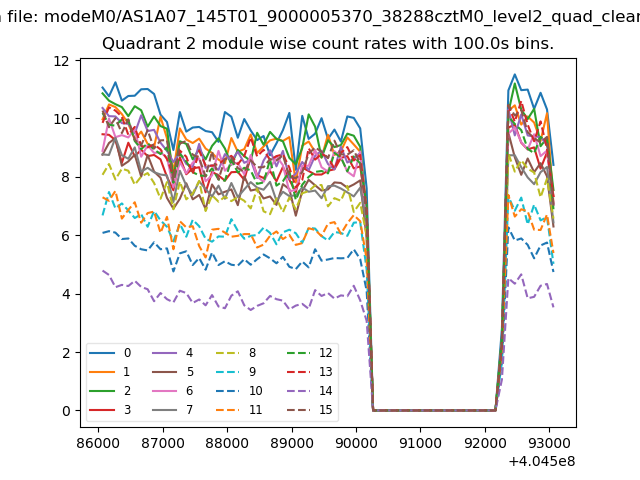
| Module-wise count rates for Quadrant B Data is divided into 100 sec bins |
 |
 |
| Module-wise count rates for Quadrant C Data is divided into 100 sec bins |
 |
 |
| Module-wise count rates for Quadrant D Data is divided into 100 sec bins |
 |
 |
| Parameter | Plot |
|---|---|
| CZT HV Monitor | 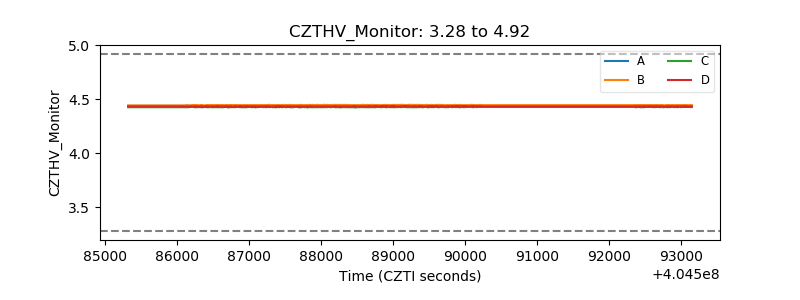 |
| D_VDD | 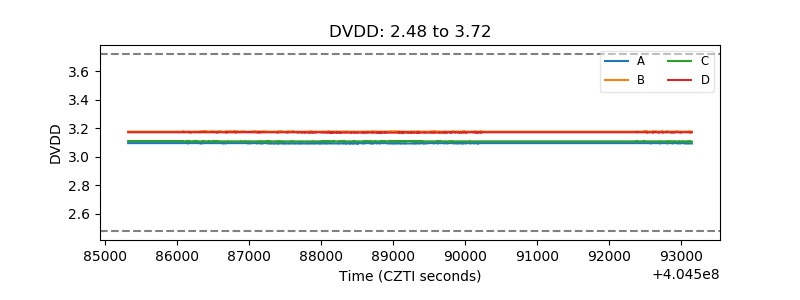 |
| Temperature 1 | 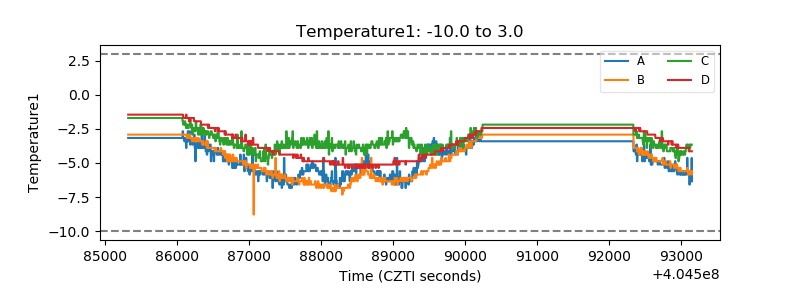 |
| Veto HV Monitor | 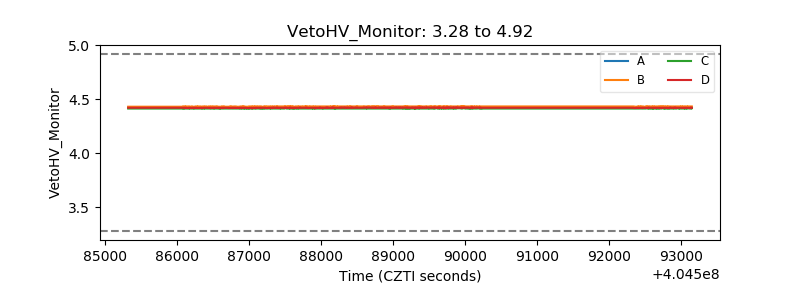 |
| Veto LLD | 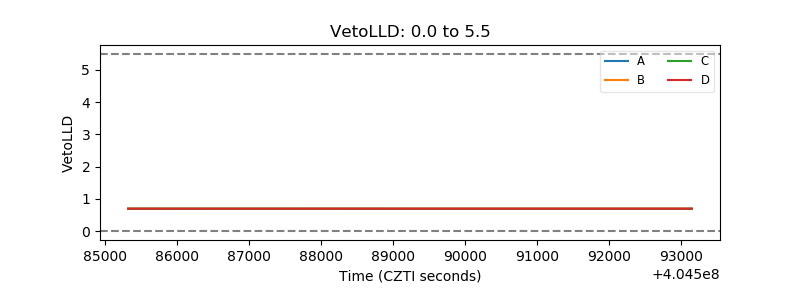 |
| Alpha Counter | 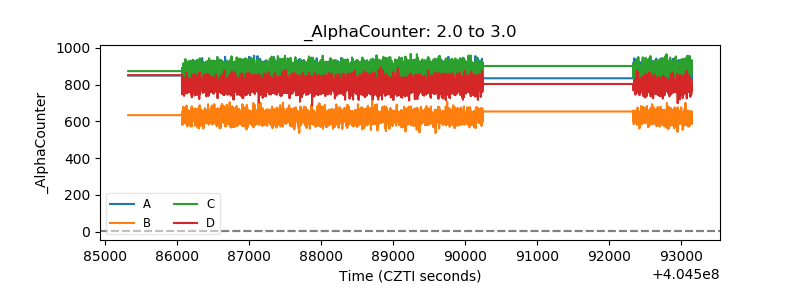 |
| _CPM_Rate | 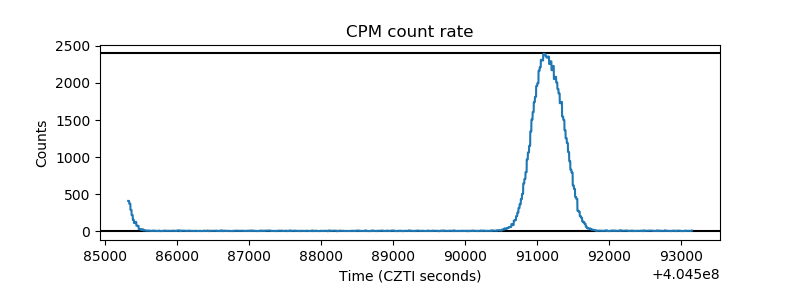 |
| CZT Counter | 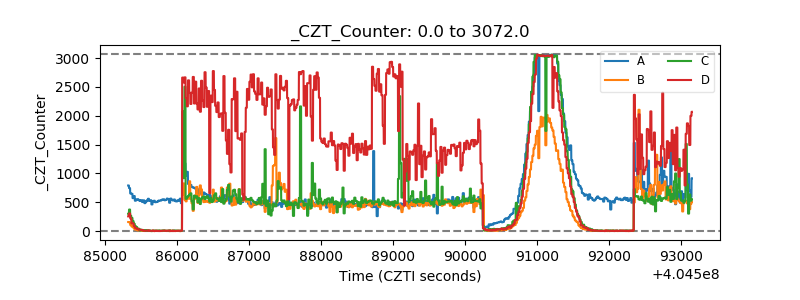 |
| +2.5 Volts monitor | 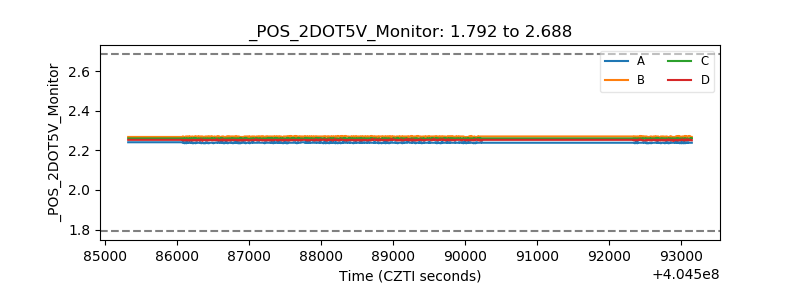 |
| +5 Volts monitor |  |
| _ROLL_ROT | 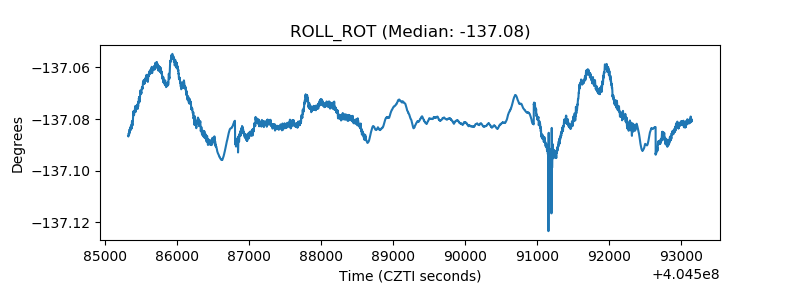 |
| _Roll_DEC | 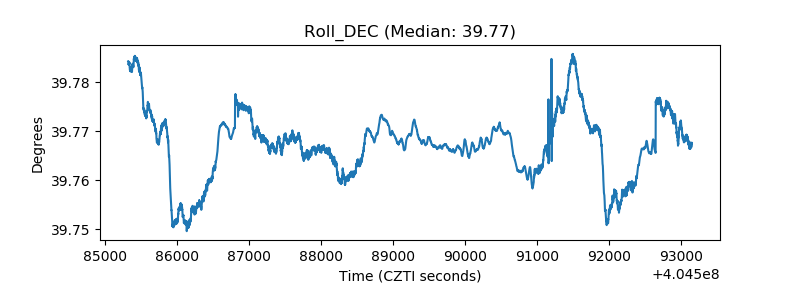 |
| _Roll_RA | 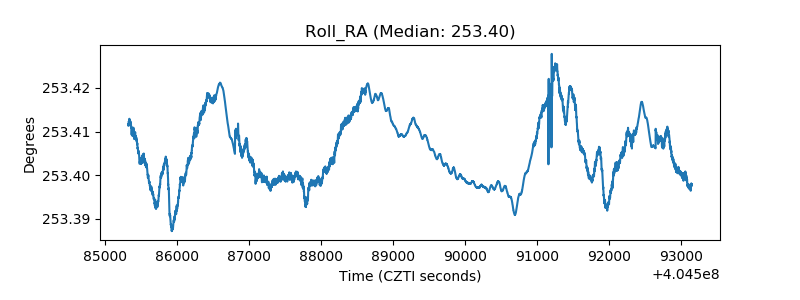 |
| Veto Counter | 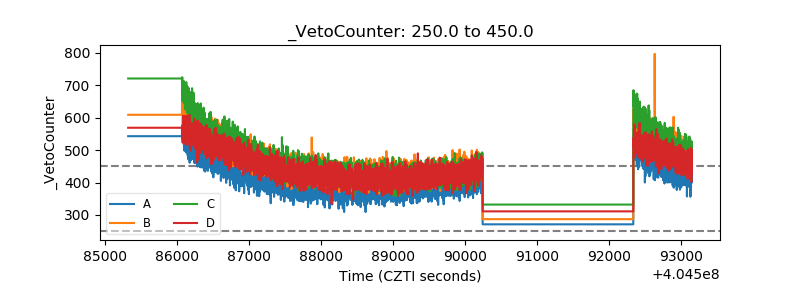 |