| Param | Original file | Final file |
|---|---|---|
| Filename | modeM0/AS1A07_145T01_9000005370_38289cztM0_level2.fits | modeM0/AS1A07_145T01_9000005370_38289cztM0_level2_quad_clean.evt |
| Size (bytes) | 428,941,440 | 87,347,520 |
| Size | 409.1 MB | 83.3 MB |
| Events in quadrant A | 2,819,537 | 600,343 |
| Events in quadrant B | 2,839,741 | 614,146 |
| Events in quadrant C | 2,865,535 | 595,961 |
| Events in quadrant D | 6,979,100 | 496,229 |
| Mode M9 | |||
|---|---|---|---|
| Quadrant | BADHDUFLAG | Total packets | Discarded packets |
| A | 0 | 24 | 0 |
| B | 0 | 24 | 0 |
| C | 0 | 24 | 0 |
| D | 0 | 25 | 0 |
| Mode SS | |||
|---|---|---|---|
| Quadrant | BADHDUFLAG | Total packets | Discarded packets |
| A | 0 | 98 | 0 |
| B | 0 | 98 | 0 |
| C | 0 | 98 | 0 |
| D | 0 | 98 | 0 |
| Mode M0 | |||
|---|---|---|---|
| Quadrant | BADHDUFLAG | Total packets | Discarded packets |
| A | 0 | 11307 | 3 |
| B | 0 | 11465 | 2 |
| C | 0 | 11347 | 2 |
| D | 0 | 24120 | 2 |
| Quadrant | Total seconds | Saturated seconds | Saturation percentage |
|---|---|---|---|
| A | 4823 | 16 | 0.331744% |
| B | 4823 | 118 | 2.446610% |
| C | 4823 | 49 | 1.015965% |
| D | 4823 | 666 | 13.808833% |
Noise dominated data is calculated using 1-second bins in cleaned event files. If a bin has >2000 counts, and if more than 50% of those come from <1% of pixels, then it is considered to be noise-dominated and hence unusable.
| Quadrant | # 1 sec bins | Bins with >0 counts | Bins with >2000 counts | High rate bins dominated by noise | Noise dominated (total time) | Noise dominated (detector-on time) | Marked lightcurve |
|---|---|---|---|---|---|---|---|
| A | 6976 | 4824 | 7 | 7 | 0.10% | 0.15% | 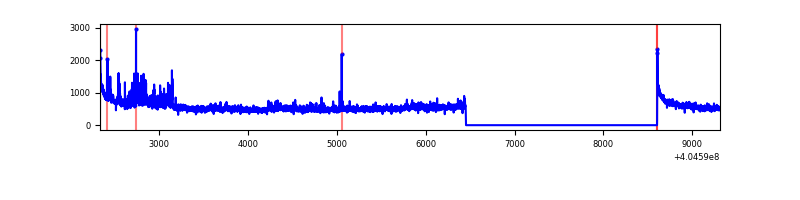 |
| B | 6976 | 4824 | 82 | 82 | 1.18% | 1.70% | 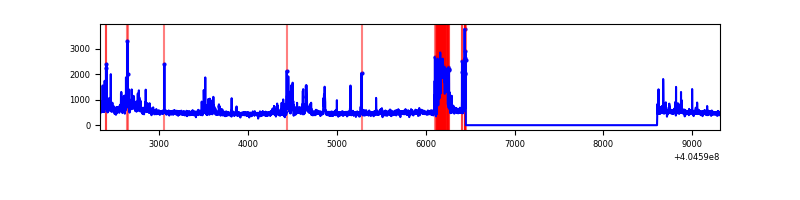 |
| C | 6976 | 4824 | 36 | 36 | 0.52% | 0.75% | 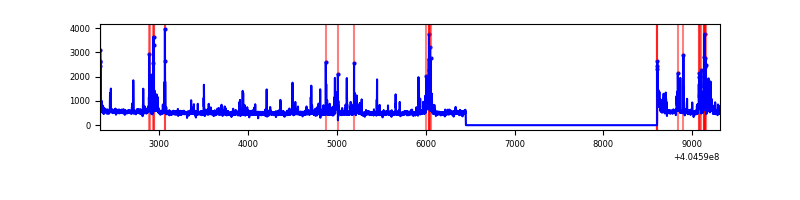 |
| D | 6976 | 4824 | 637 | 637 | 9.13% | 13.20% | 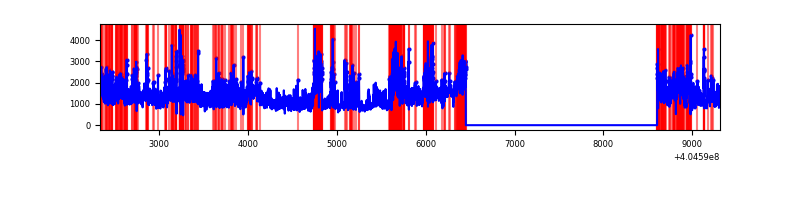 |
Top three noisy pixels from each quadrant. If the there are fewer than three noisy pixels in the level2.evt file, extra rows are filled as -1
| Pixel properties | Quadrant properties | ||||||
|---|---|---|---|---|---|---|---|
| Quadrant | DetID | PixID | Counts | Sigma | Mean | Median | Sigma |
| A | 10 | 83 | 362007 | 3202.14 | 560 | 551 | 112.9 |
| A | 12 | 16 | 199383 | 1761.45 | 560 | 551 | 112.9 |
| A | 12 | 194 | 33033 | 287.76 | 560 | 551 | 112.9 |
| B | 5 | 184 | 224903 | 2078.74 | 564 | 549 | 107.9 |
| B | 5 | 172 | 170501 | 1574.68 | 564 | 549 | 107.9 |
| B | 0 | 229 | 87498 | 805.62 | 564 | 549 | 107.9 |
| C | 15 | 214 | 205409 | 1566.92 | 559 | 563 | 130.7 |
| C | 9 | 236 | 200257 | 1527.51 | 559 | 563 | 130.7 |
| C | 14 | 254 | 143556 | 1093.79 | 559 | 563 | 130.7 |
| D | 2 | 16 | 1863055 | 14323.75 | 531 | 517 | 130.0 |
| D | 10 | 203 | 1166969 | 8970.54 | 531 | 517 | 130.0 |
| D | 1 | 47 | 938850 | 7216.2 | 531 | 517 | 130.0 |
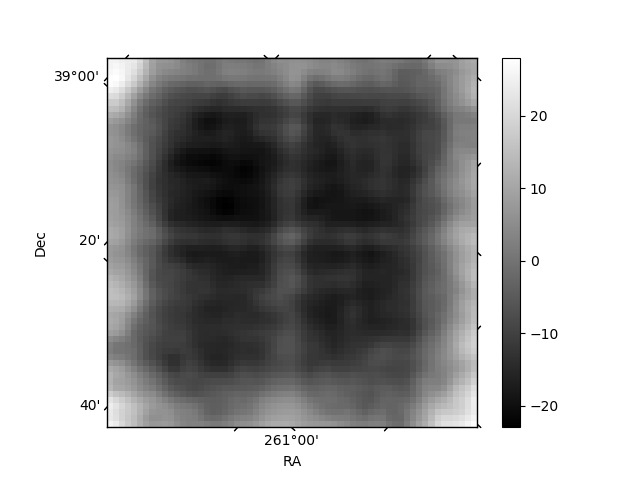
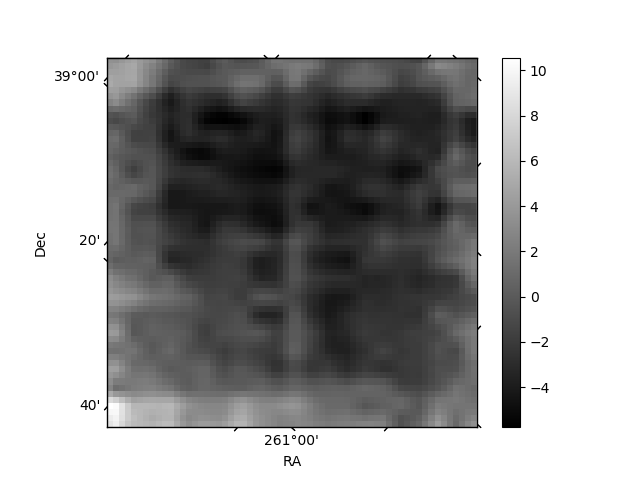
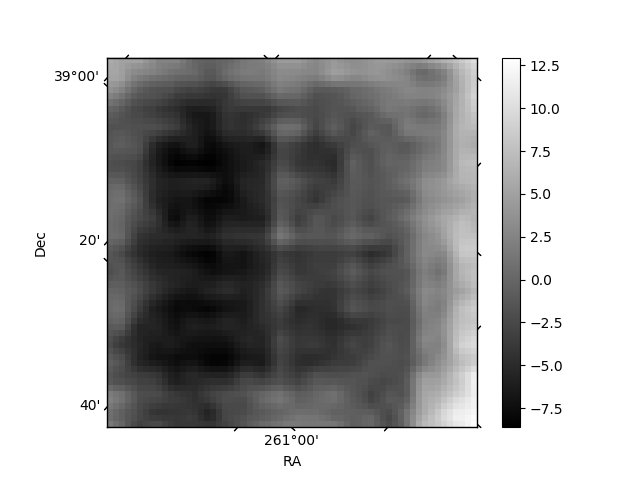
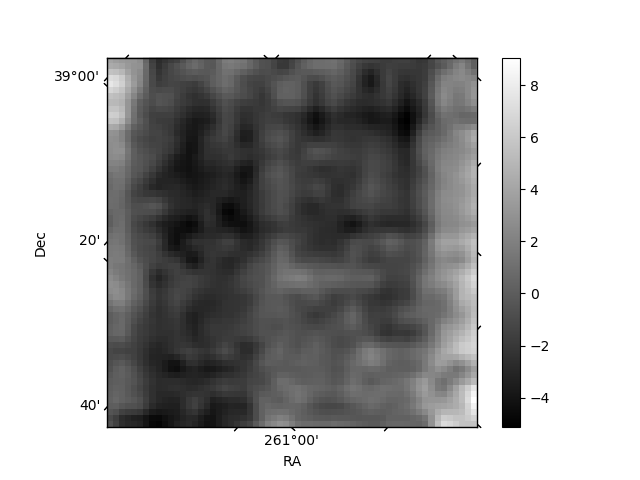
Histogram calculated using DETX and DETY for each event in the final _common_clean file
| Quadrant A | 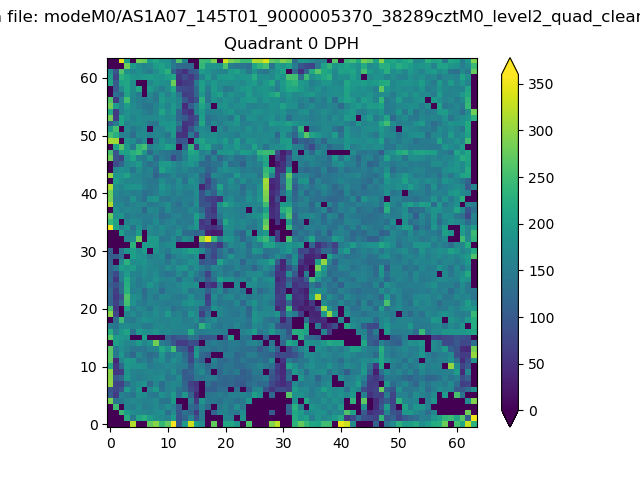 |
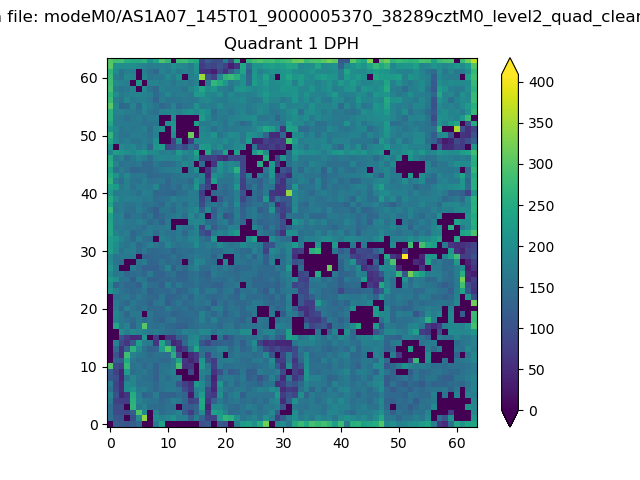 |
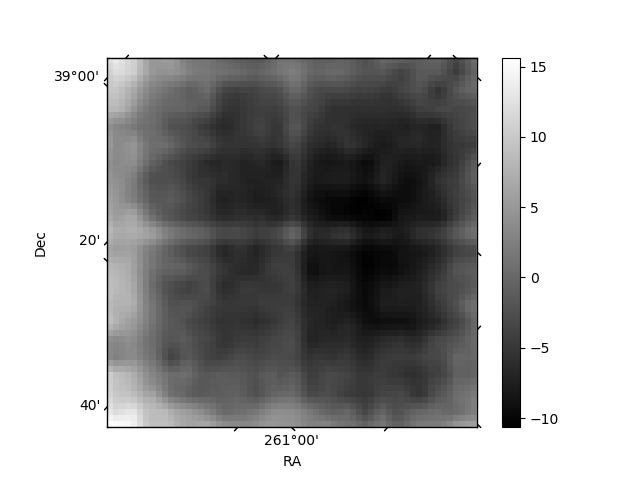
Quadrant B |
|---|---|---|---|
| Quadrant D | 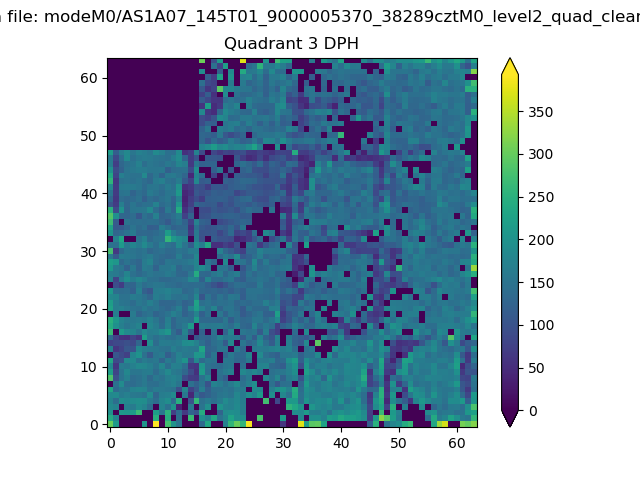 |
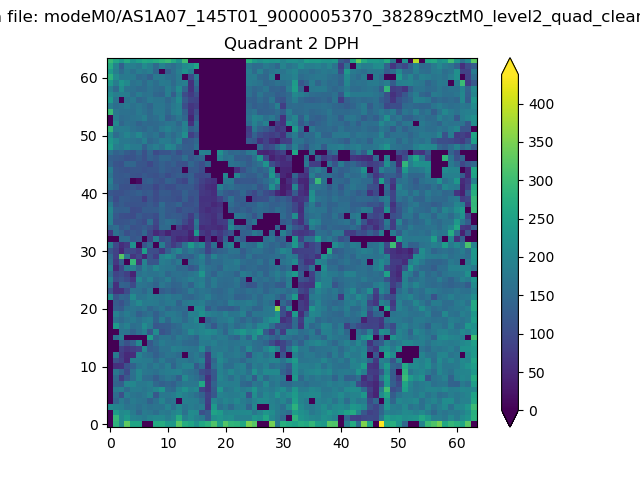 |
Quadrant C |
| Plot type | Count rate plots | Images |
|---|---|---|
| Comparison with Poisson distribution Blue bars denote a histogram of data divided into 1 sec bins. Red curve is a Poisson curve with rate = median count rate of data. |
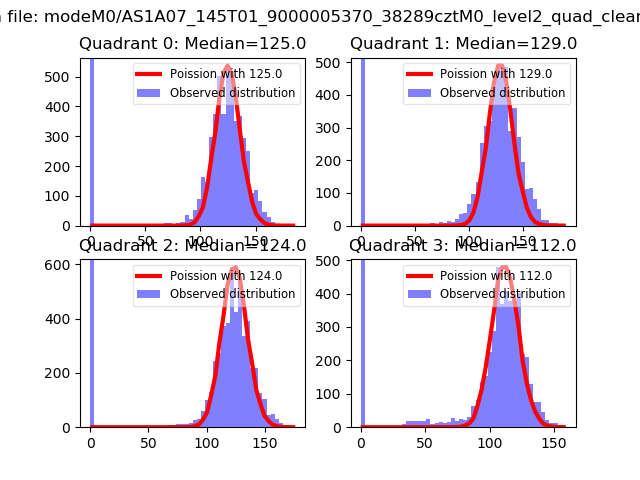 |
 |
| Quadrant-wise count rates Data is divided into 100 sec bins |
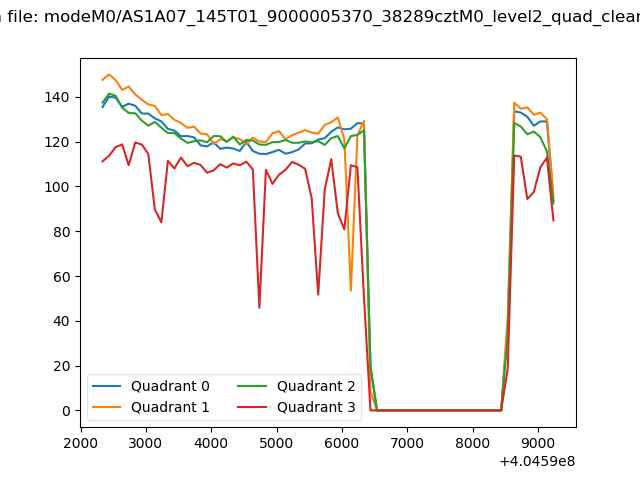 |
|
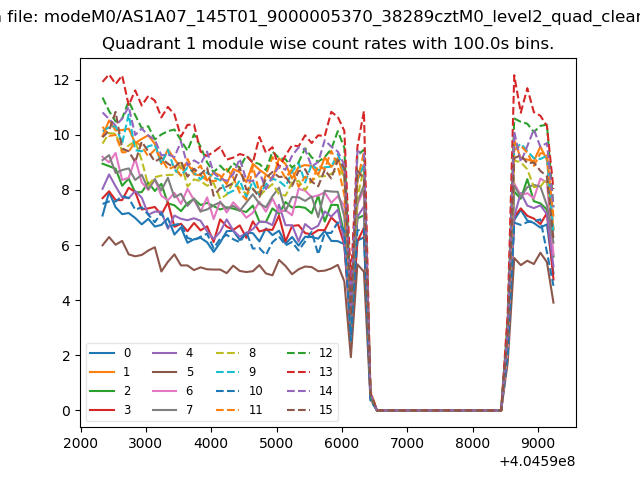
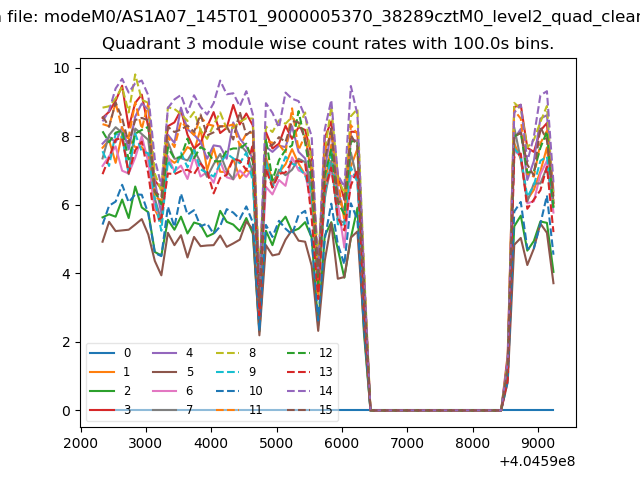
| Module-wise count rates for Quadrant A Data is divided into 100 sec bins |
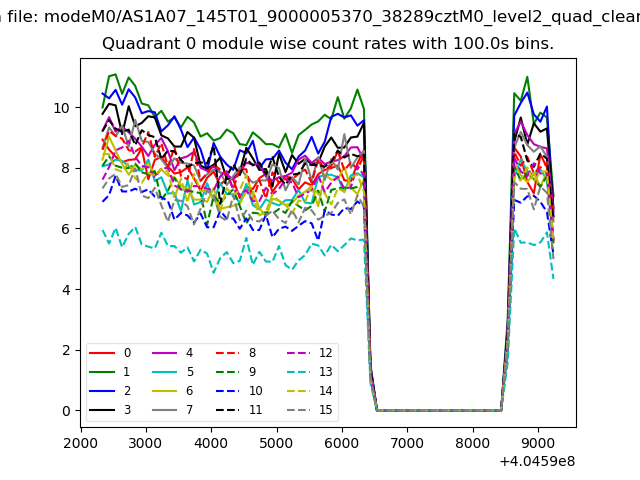 |
 |
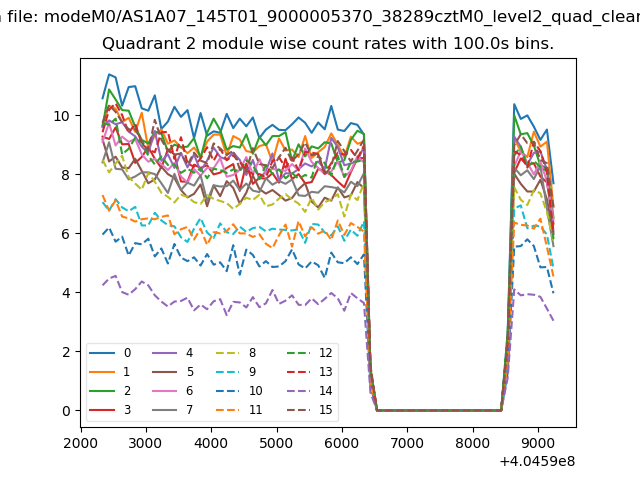
| Module-wise count rates for Quadrant B Data is divided into 100 sec bins |
 |
 |
| Module-wise count rates for Quadrant C Data is divided into 100 sec bins |
 |
 |
| Module-wise count rates for Quadrant D Data is divided into 100 sec bins |
 |
 |
| Parameter | Plot |
|---|---|
| CZT HV Monitor | 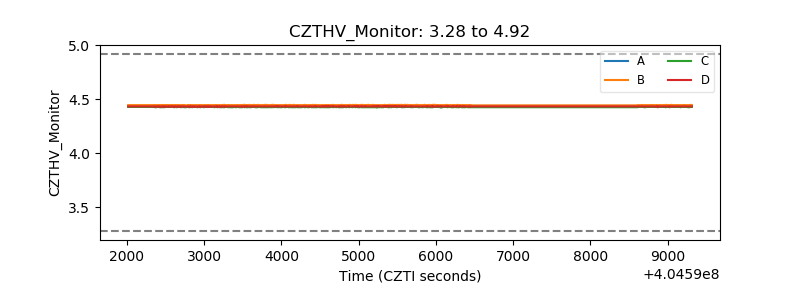 |
| D_VDD | 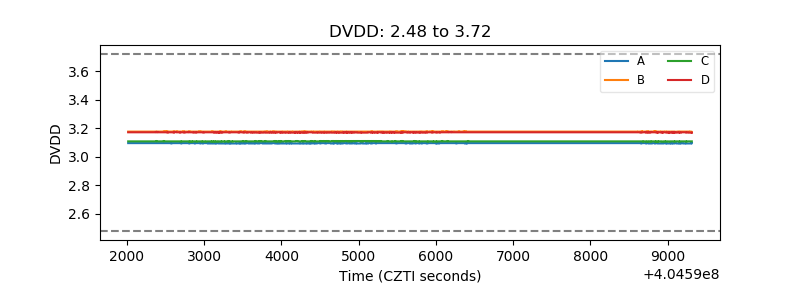 |
| Temperature 1 | 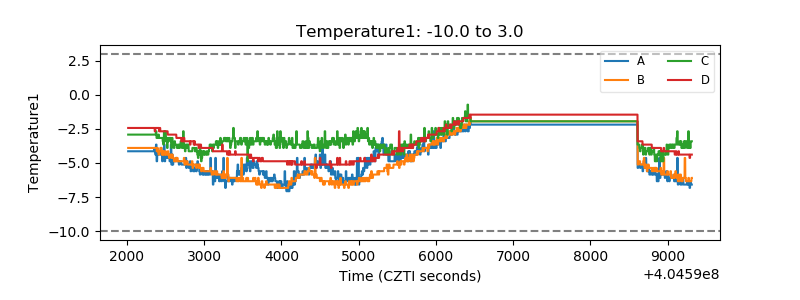 |
| Veto HV Monitor | 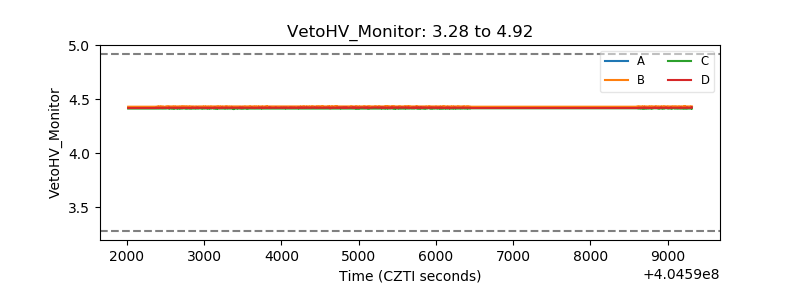 |
| Veto LLD | 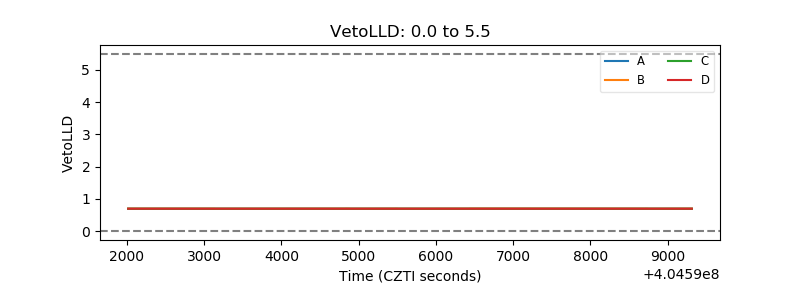 |
| Alpha Counter | 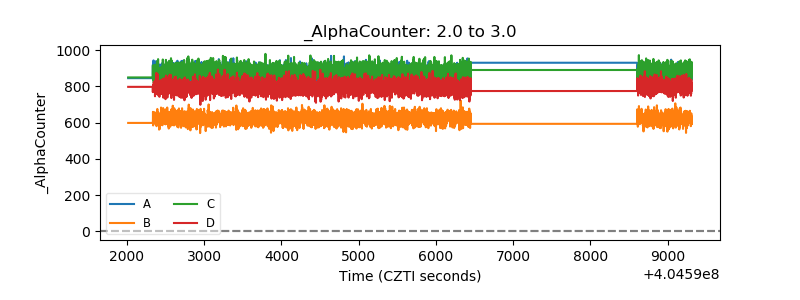 |
| _CPM_Rate | 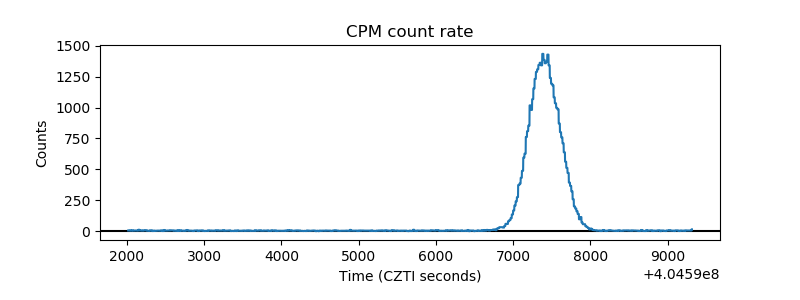 |
| CZT Counter | 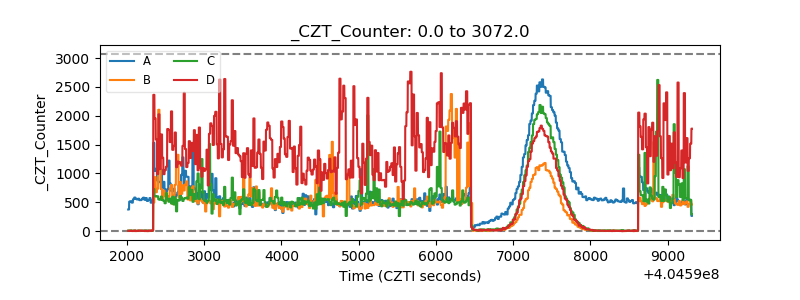 |
| +2.5 Volts monitor | 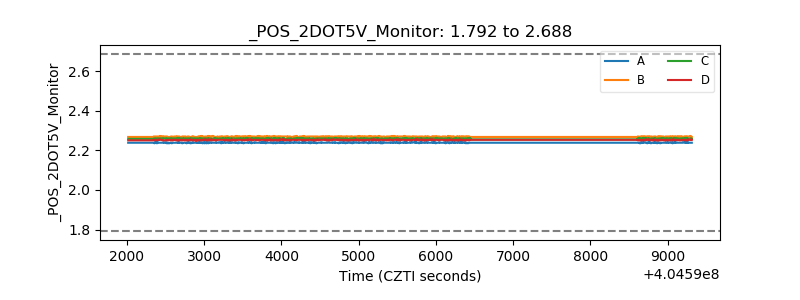 |
| +5 Volts monitor | 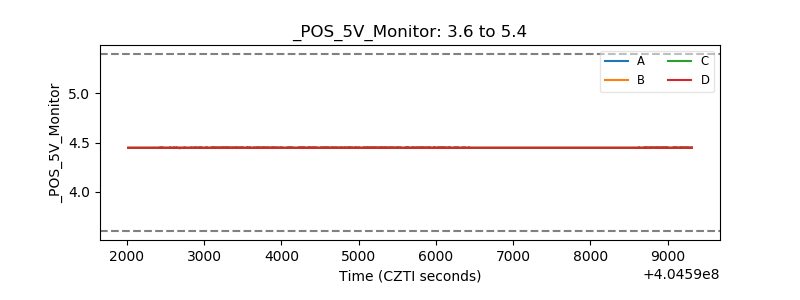 |
| _ROLL_ROT | 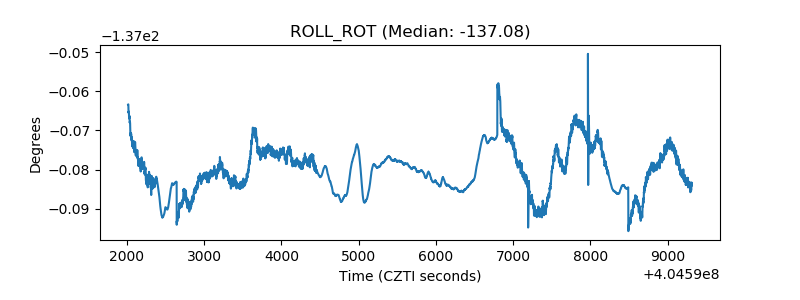 |
| _Roll_DEC | 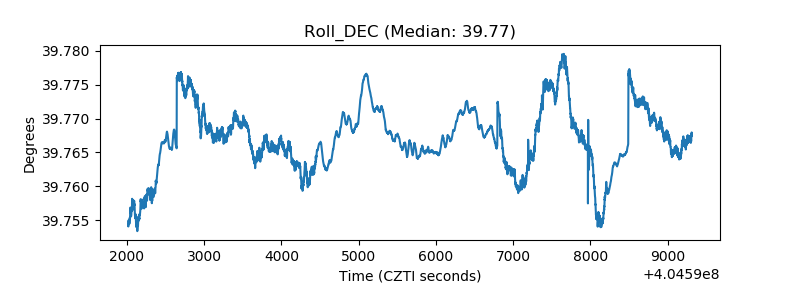 |
| _Roll_RA | 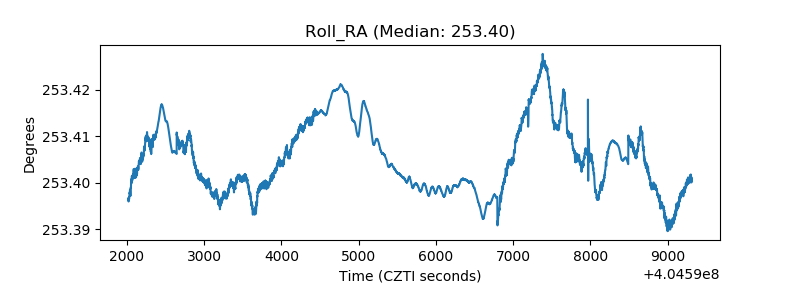 |
| Veto Counter | 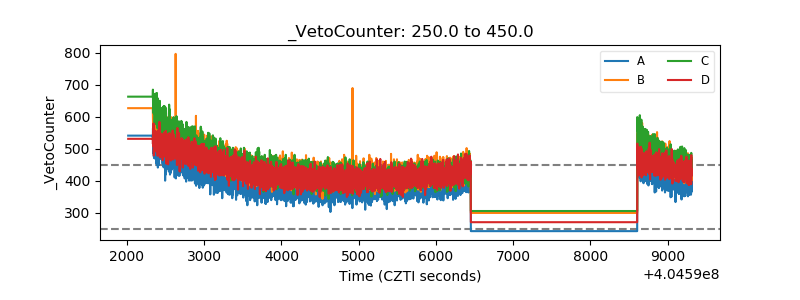 |