| Param | Original file | Final file |
|---|---|---|
| Filename | modeM0/AS1A07_145T01_9000005370_38291cztM0_level2.fits | modeM0/AS1A07_145T01_9000005370_38291cztM0_level2_quad_clean.evt |
| Size (bytes) | 503,254,080 | 86,607,360 |
| Size | 479.9 MB | 82.6 MB |
| Events in quadrant A | 2,786,478 | 608,681 |
| Events in quadrant B | 2,495,803 | 624,265 |
| Events in quadrant C | 3,448,731 | 584,616 |
| Events in quadrant D | 9,483,980 | 431,356 |
| Mode M9 | |||
|---|---|---|---|
| Quadrant | BADHDUFLAG | Total packets | Discarded packets |
| A | 0 | 29 | 0 |
| B | 0 | 29 | 0 |
| C | 0 | 29 | 0 |
| D | 0 | 30 | 0 |
| Mode SS | |||
|---|---|---|---|
| Quadrant | BADHDUFLAG | Total packets | Discarded packets |
| A | 0 | 108 | 0 |
| B | 0 | 108 | 0 |
| C | 0 | 108 | 0 |
| D | 0 | 108 | 0 |
| Mode M0 | |||
|---|---|---|---|
| Quadrant | BADHDUFLAG | Total packets | Discarded packets |
| A | 0 | 11439 | 3 |
| B | 0 | 11084 | 2 |
| C | 0 | 13572 | 2 |
| D | 0 | 31839 | 2 |
| Quadrant | Total seconds | Saturated seconds | Saturation percentage |
|---|---|---|---|
| A | 5336 | 11 | 0.206147% |
| B | 5336 | 23 | 0.431034% |
| C | 5336 | 215 | 4.029235% |
| D | 5336 | 1431 | 26.817841% |
Noise dominated data is calculated using 1-second bins in cleaned event files. If a bin has >2000 counts, and if more than 50% of those come from <1% of pixels, then it is considered to be noise-dominated and hence unusable.
| Quadrant | # 1 sec bins | Bins with >0 counts | Bins with >2000 counts | High rate bins dominated by noise | Noise dominated (total time) | Noise dominated (detector-on time) | Marked lightcurve |
|---|---|---|---|---|---|---|---|
| A | 7218 | 5337 | 6 | 6 | 0.08% | 0.11% | 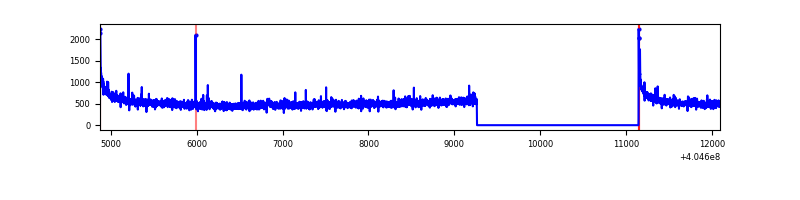 |
| B | 7218 | 5337 | 7 | 7 | 0.10% | 0.13% | 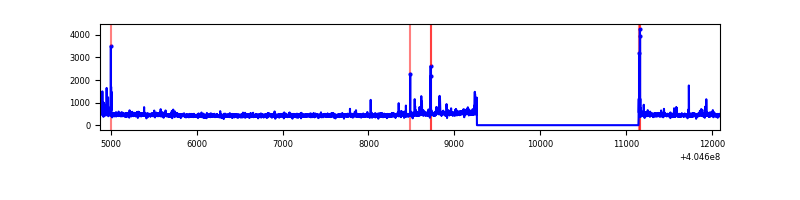 |
| C | 7218 | 5337 | 179 | 179 | 2.48% | 3.35% | 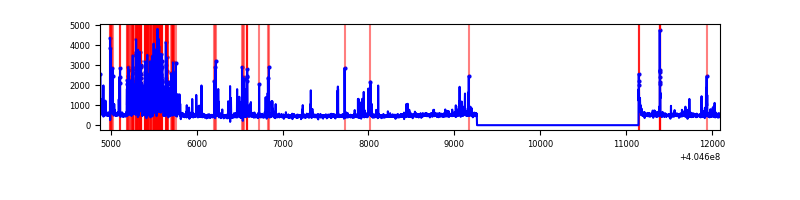 |
| D | 7218 | 5337 | 1612 | 1612 | 22.33% | 30.20% | 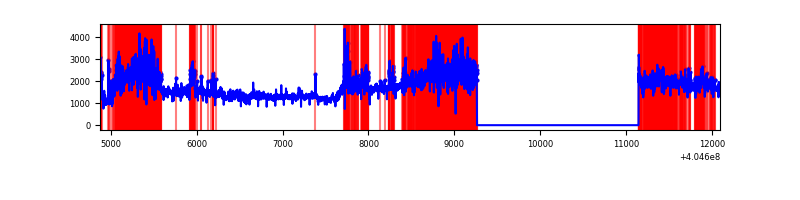 |
Top three noisy pixels from each quadrant. If the there are fewer than three noisy pixels in the level2.evt file, extra rows are filled as -1
| Pixel properties | Quadrant properties | ||||||
|---|---|---|---|---|---|---|---|
| Quadrant | DetID | PixID | Counts | Sigma | Mean | Median | Sigma |
| A | 10 | 83 | 382362 | 3163.59 | 593 | 581 | 120.7 |
| A | 12 | 189 | 34548 | 281.46 | 593 | 581 | 120.7 |
| A | 12 | 16 | 28599 | 232.17 | 593 | 581 | 120.7 |
| B | 5 | 172 | 66239 | 576.75 | 593 | 576 | 113.8 |
| B | 0 | 229 | 58349 | 507.45 | 593 | 576 | 113.8 |
| B | 12 | 111 | 14567 | 122.89 | 593 | 576 | 113.8 |
| C | 9 | 236 | 779342 | 5774.68 | 574 | 579 | 134.9 |
| C | 15 | 214 | 223179 | 1650.62 | 574 | 579 | 134.9 |
| C | 14 | 254 | 113460 | 837.03 | 574 | 579 | 134.9 |
| D | 10 | 203 | 5326535 | 40805.33 | 530 | 515 | 130.5 |
| D | 1 | 47 | 910264 | 6970.05 | 530 | 515 | 130.5 |
| D | 12 | 235 | 678224 | 5192.27 | 530 | 515 | 130.5 |
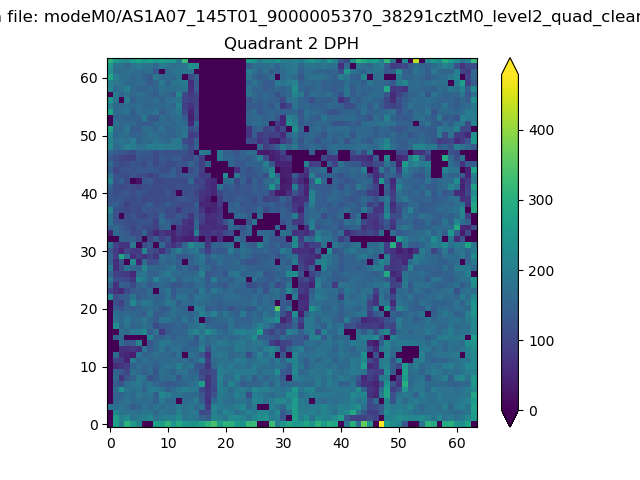
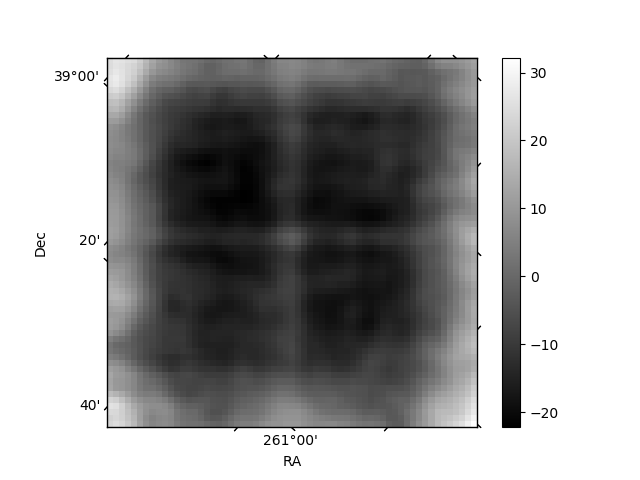
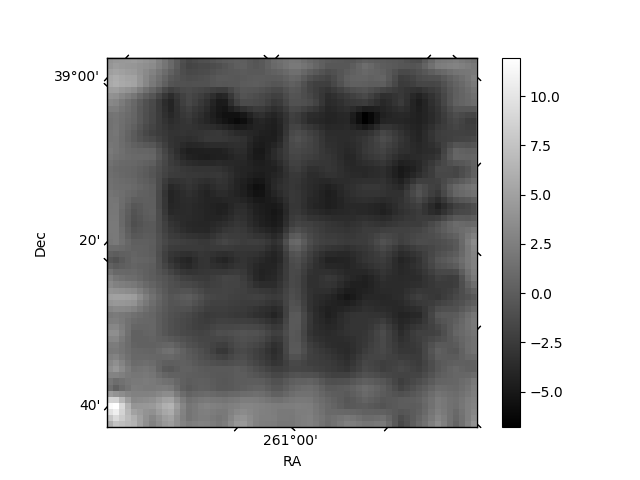
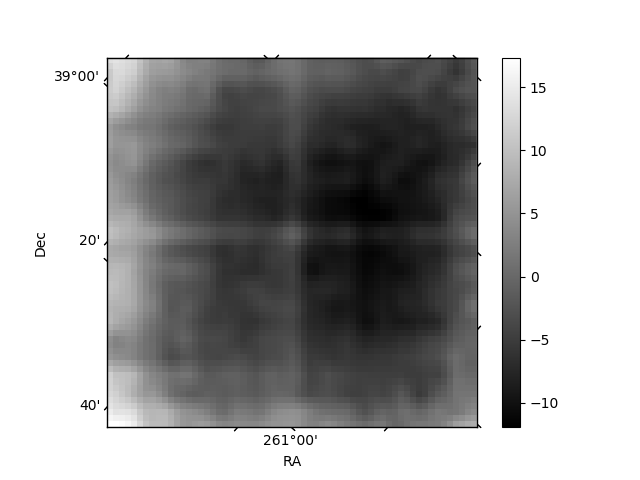
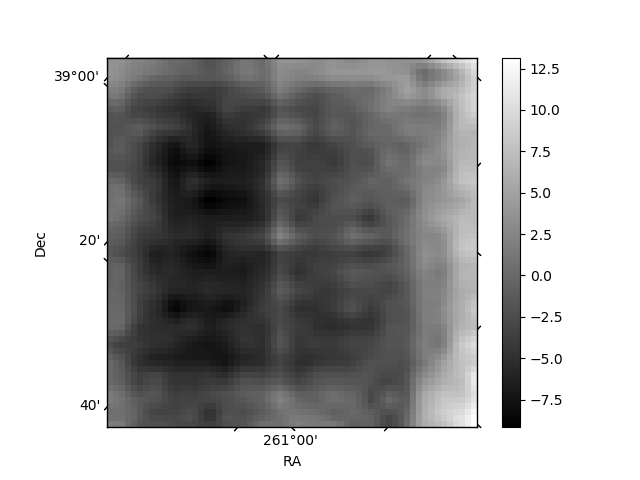
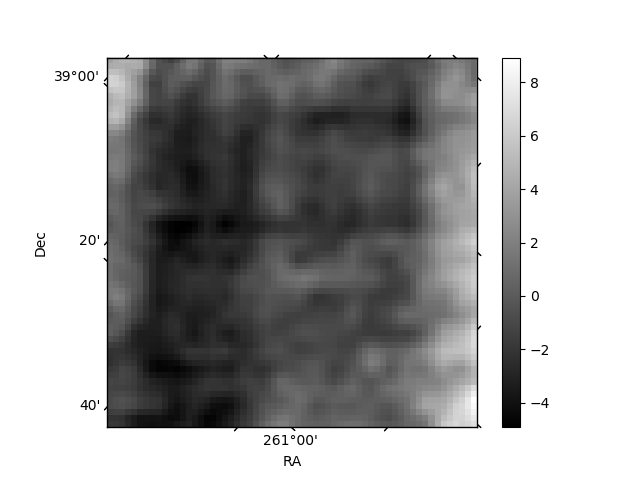
Histogram calculated using DETX and DETY for each event in the final _common_clean file
| Quadrant A | 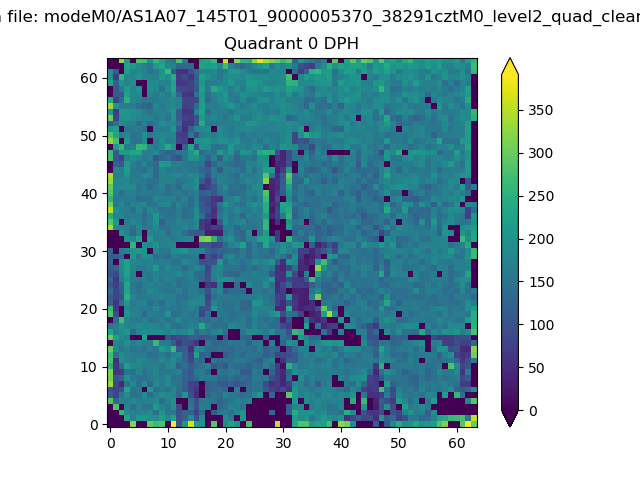 |
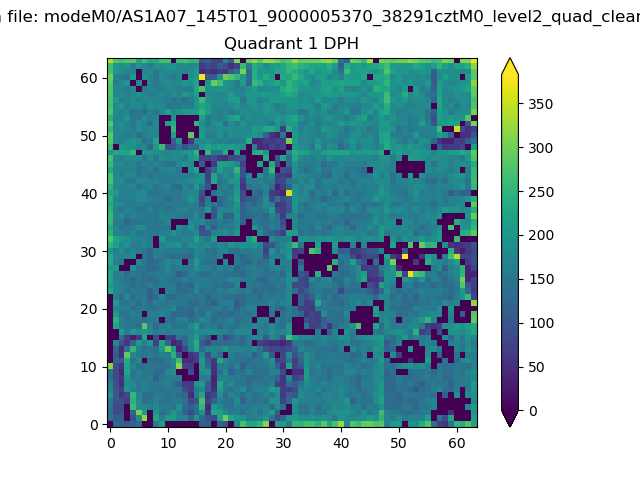 |
Quadrant B |
|---|---|---|---|
| Quadrant D | 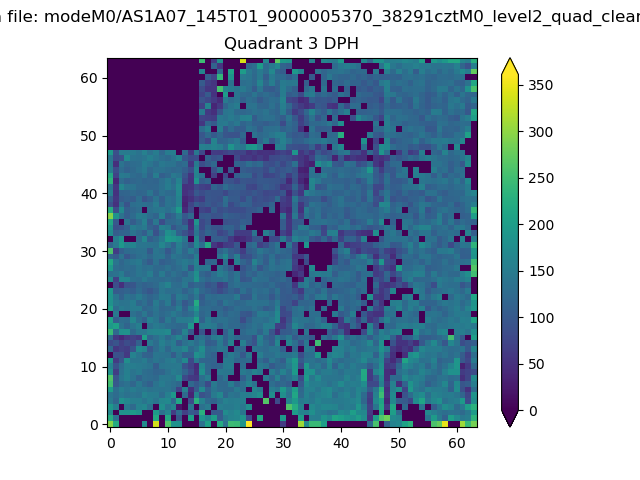 |
 |
Quadrant C |
| Plot type | Count rate plots | Images |
|---|---|---|
| Comparison with Poisson distribution Blue bars denote a histogram of data divided into 1 sec bins. Red curve is a Poisson curve with rate = median count rate of data. |
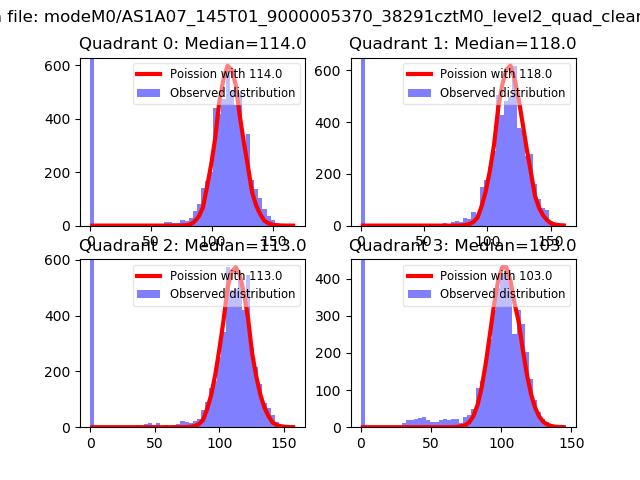 |
 |
| Quadrant-wise count rates Data is divided into 100 sec bins |
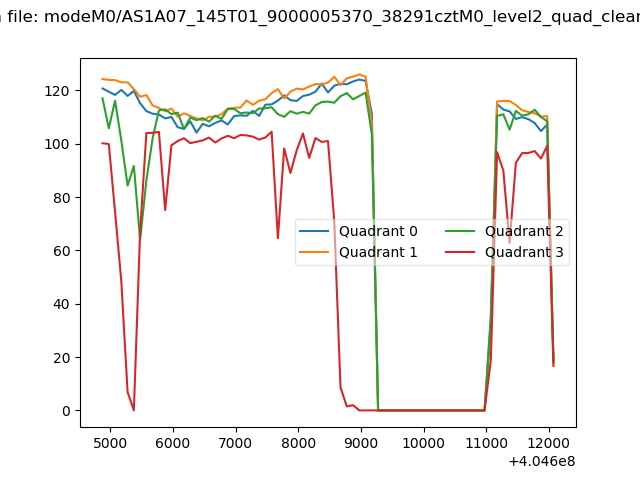 |
|
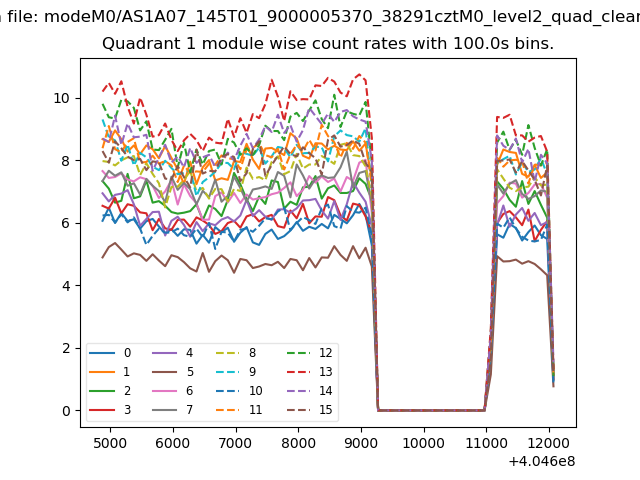
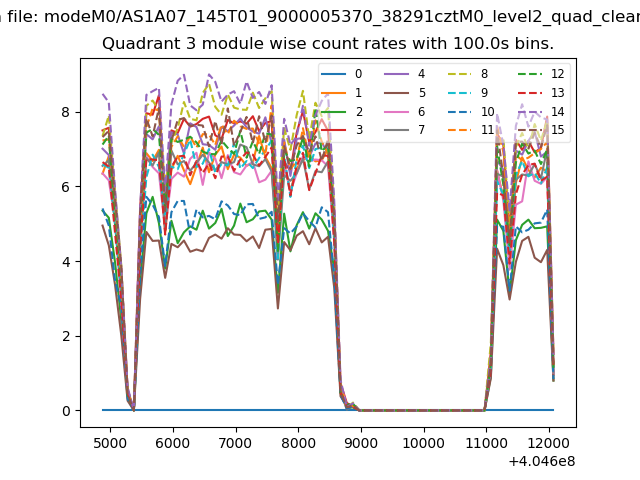
| Module-wise count rates for Quadrant A Data is divided into 100 sec bins |
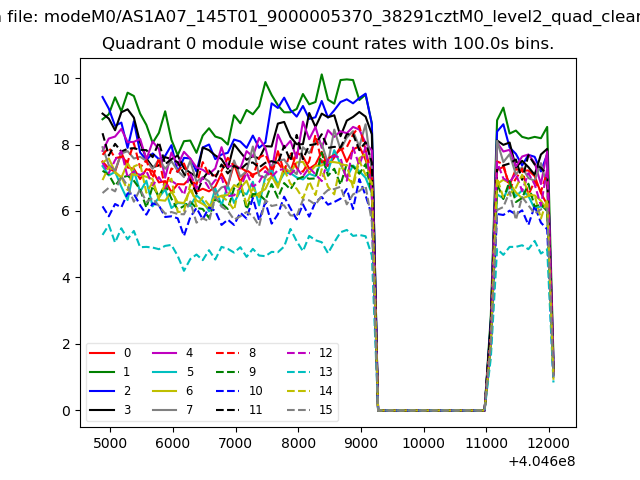 |
 |
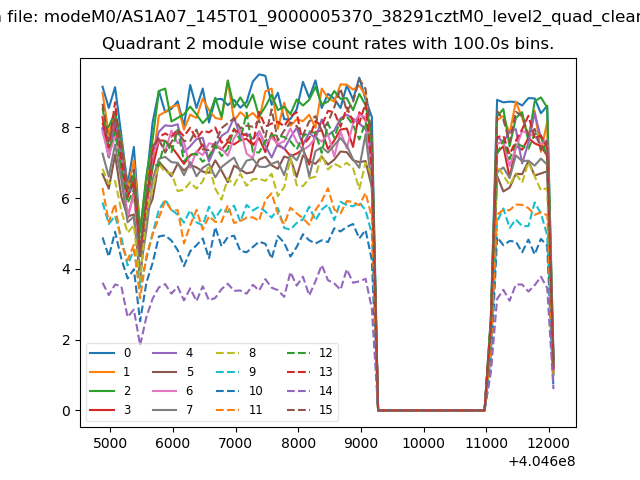
| Module-wise count rates for Quadrant B Data is divided into 100 sec bins |
 |
 |
| Module-wise count rates for Quadrant C Data is divided into 100 sec bins |
 |
 |
| Module-wise count rates for Quadrant D Data is divided into 100 sec bins |
 |
 |
| Parameter | Plot |
|---|---|
| CZT HV Monitor | 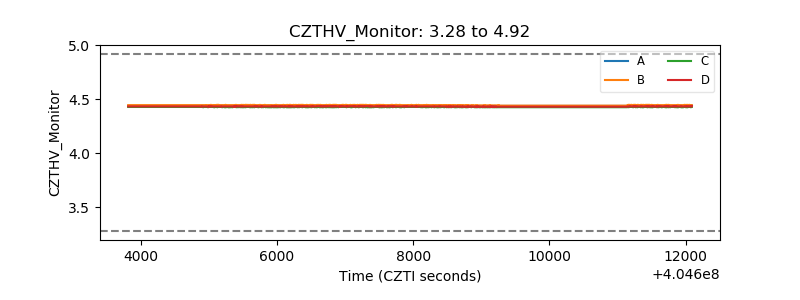 |
| D_VDD | 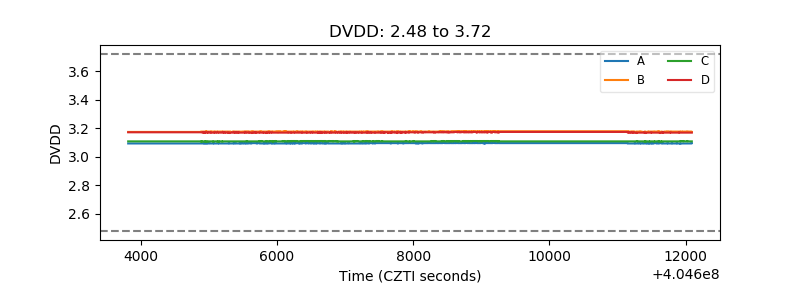 |
| Temperature 1 | 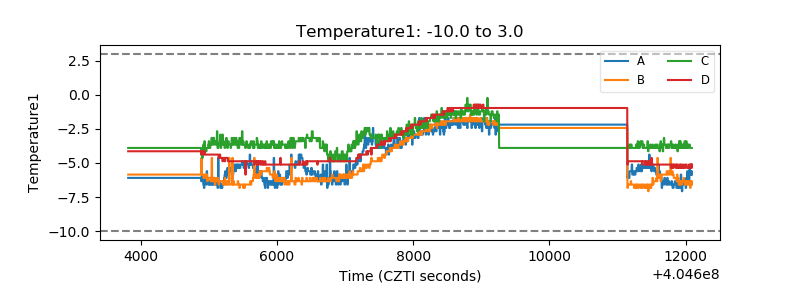 |
| Veto HV Monitor | 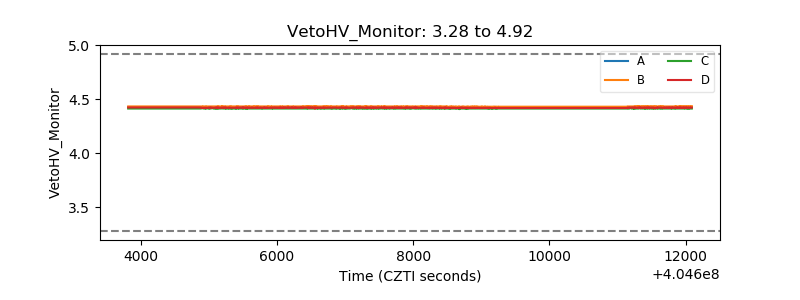 |
| Veto LLD | 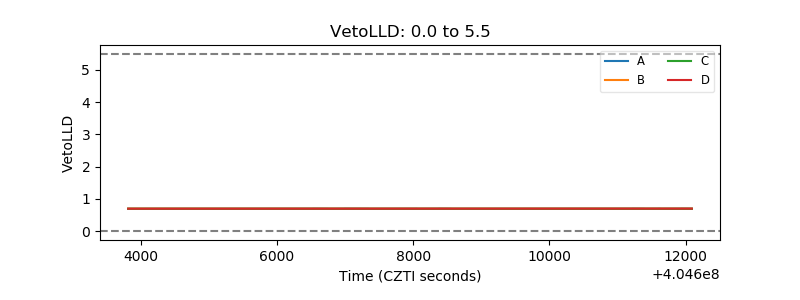 |
| Alpha Counter | 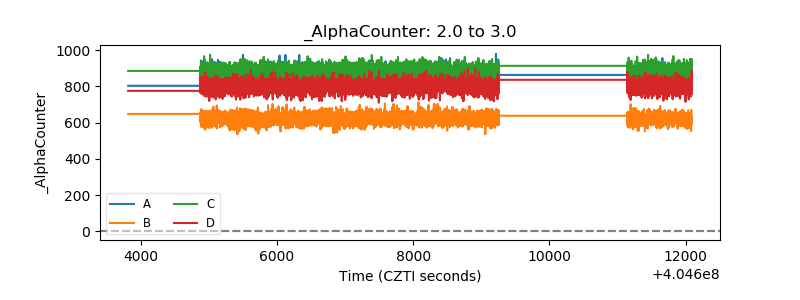 |
| _CPM_Rate | 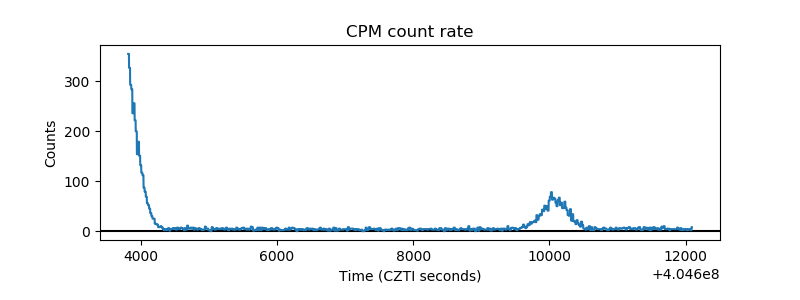 |
| CZT Counter | 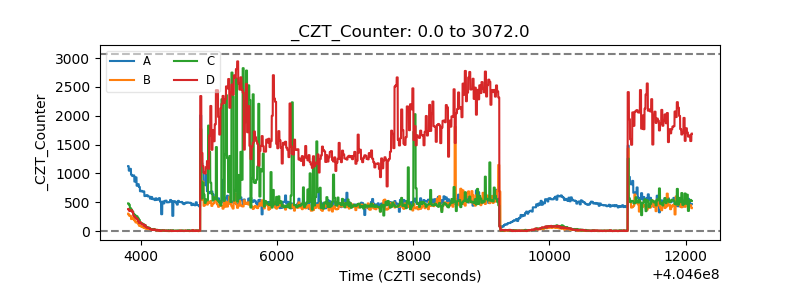 |
| +2.5 Volts monitor | 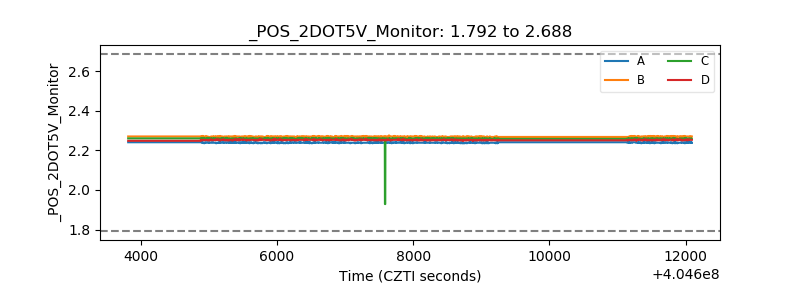 |
| +5 Volts monitor | 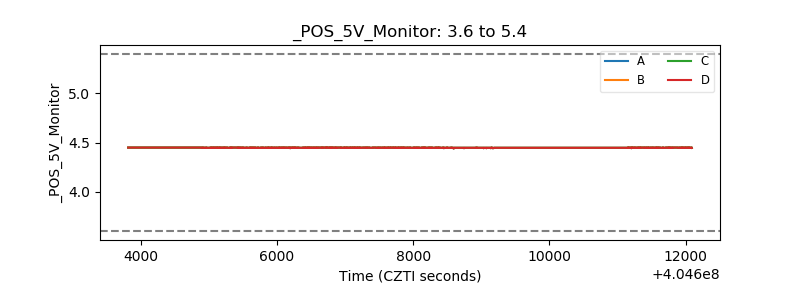 |
| _ROLL_ROT | 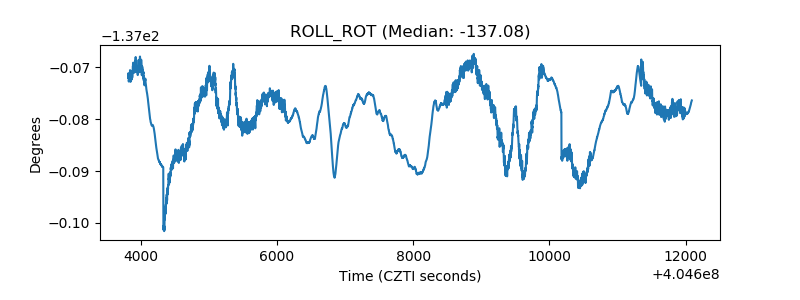 |
| _Roll_DEC | 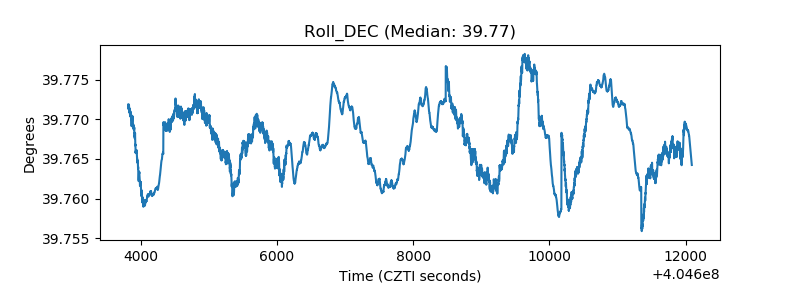 |
| _Roll_RA | 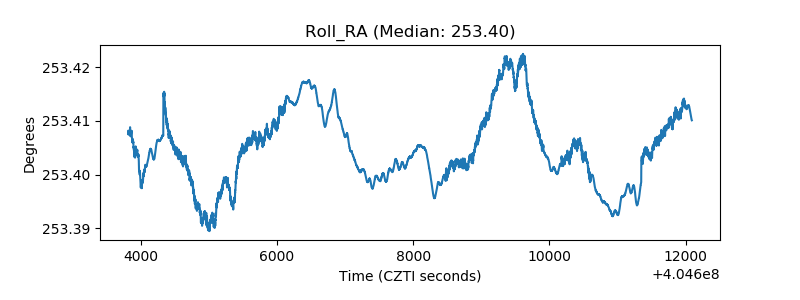 |
| Veto Counter | 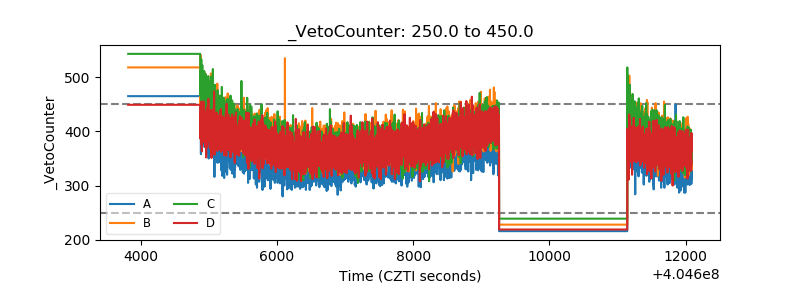 |