| Param | Original file | Final file |
|---|---|---|
| Filename | modeM0/AS1A07_145T01_9000005370_38292cztM0_level2.fits | modeM0/AS1A07_145T01_9000005370_38292cztM0_level2_quad_clean.evt |
| Size (bytes) | 566,582,400 | 86,906,880 |
| Size | 540.3 MB | 82.9 MB |
| Events in quadrant A | 3,064,013 | 630,022 |
| Events in quadrant B | 2,771,747 | 647,774 |
| Events in quadrant C | 3,348,793 | 622,150 |
| Events in quadrant D | 11,351,743 | 337,829 |
| Mode M9 | |||
|---|---|---|---|
| Quadrant | BADHDUFLAG | Total packets | Discarded packets |
| A | 0 | 32 | 0 |
| B | 0 | 32 | 0 |
| C | 0 | 32 | 0 |
| D | 0 | 33 | 0 |
| Mode SS | |||
|---|---|---|---|
| Quadrant | BADHDUFLAG | Total packets | Discarded packets |
| A | 0 | 114 | 0 |
| B | 0 | 114 | 0 |
| C | 0 | 114 | 0 |
| D | 0 | 114 | 0 |
| Mode M0 | |||
|---|---|---|---|
| Quadrant | BADHDUFLAG | Total packets | Discarded packets |
| A | 0 | 12423 | 3 |
| B | 0 | 12052 | 2 |
| C | 0 | 13488 | 2 |
| D | 0 | 37610 | 2 |
| Quadrant | Total seconds | Saturated seconds | Saturation percentage |
|---|---|---|---|
| A | 5630 | 11 | 0.195382% |
| B | 5630 | 37 | 0.657194% |
| C | 5630 | 45 | 0.799290% |
| D | 5630 | 2550 | 45.293073% |
Noise dominated data is calculated using 1-second bins in cleaned event files. If a bin has >2000 counts, and if more than 50% of those come from <1% of pixels, then it is considered to be noise-dominated and hence unusable.
| Quadrant | # 1 sec bins | Bins with >0 counts | Bins with >2000 counts | High rate bins dominated by noise | Noise dominated (total time) | Noise dominated (detector-on time) | Marked lightcurve |
|---|---|---|---|---|---|---|---|
| A | 7153 | 5631 | 5 | 5 | 0.07% | 0.09% | 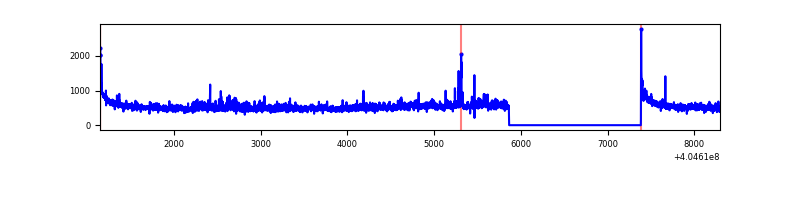 |
| B | 7153 | 5631 | 19 | 19 | 0.27% | 0.34% | 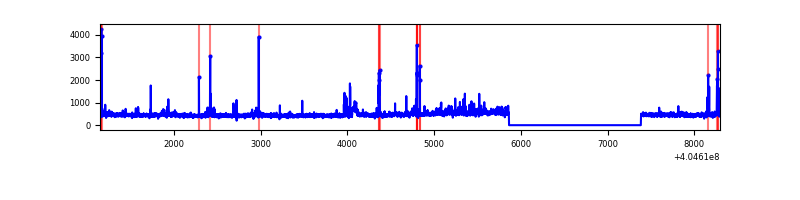 |
| C | 7153 | 5631 | 47 | 47 | 0.66% | 0.83% | 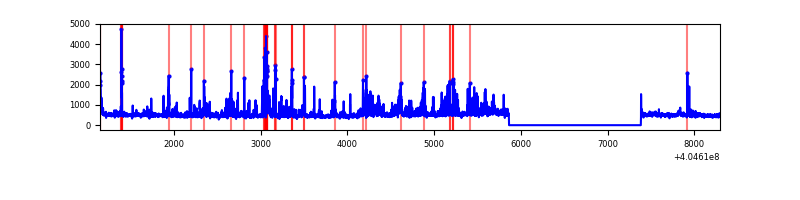 |
| D | 7153 | 5631 | 2756 | 2756 | 38.53% | 48.94% | 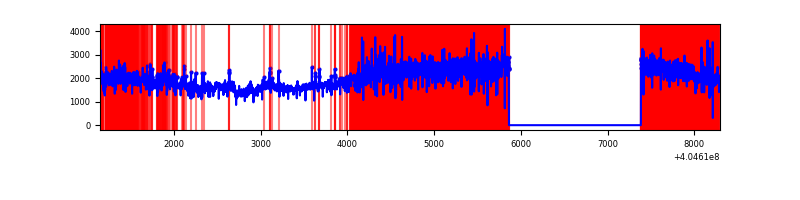 |
Top three noisy pixels from each quadrant. If the there are fewer than three noisy pixels in the level2.evt file, extra rows are filled as -1
| Pixel properties | Quadrant properties | ||||||
|---|---|---|---|---|---|---|---|
| Quadrant | DetID | PixID | Counts | Sigma | Mean | Median | Sigma |
| A | 10 | 83 | 389903 | 3077.87 | 625 | 613 | 126.5 |
| A | 12 | 16 | 141768 | 1116.02 | 625 | 613 | 126.5 |
| A | 12 | 189 | 52734 | 412.09 | 625 | 613 | 126.5 |
| B | 0 | 229 | 106104 | 870.83 | 624 | 606 | 121.1 |
| B | 5 | 172 | 65356 | 534.48 | 624 | 606 | 121.1 |
| B | 4 | 232 | 56361 | 460.23 | 624 | 606 | 121.1 |
| C | 15 | 208 | 403464 | 2822.59 | 612 | 617 | 142.7 |
| C | 15 | 214 | 237347 | 1658.67 | 612 | 617 | 142.7 |
| C | 9 | 236 | 154052 | 1075.06 | 612 | 617 | 142.7 |
| D | 10 | 203 | 8375945 | 63527.74 | 534 | 518 | 131.8 |
| D | 12 | 235 | 411144 | 3114.6 | 534 | 518 | 131.8 |
| D | 2 | 250 | 159840 | 1208.46 | 534 | 518 | 131.8 |
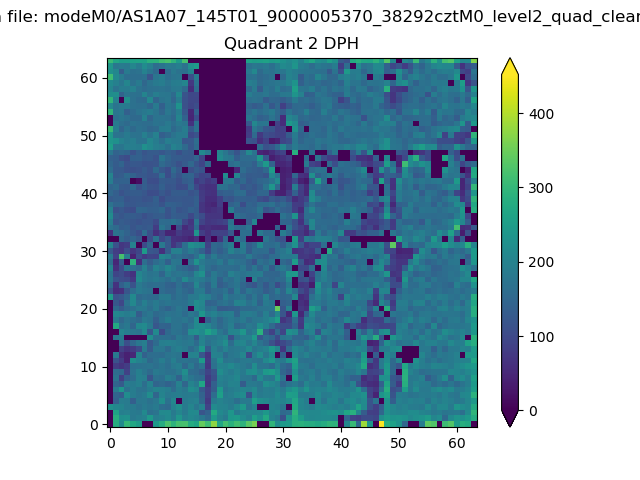
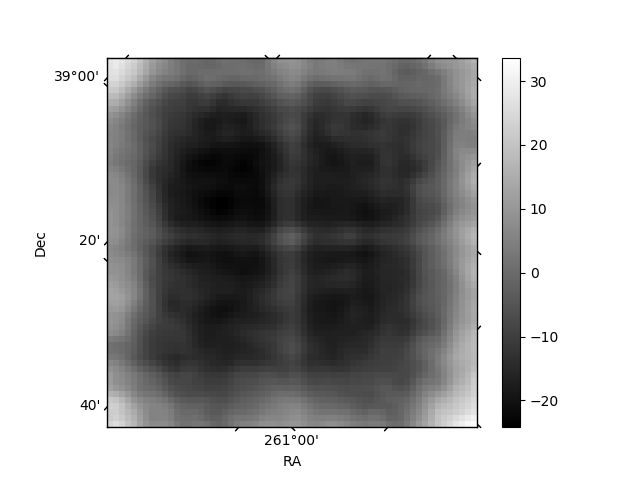
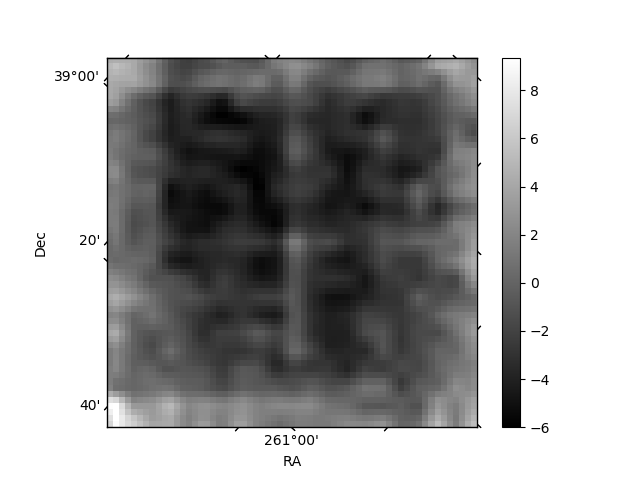
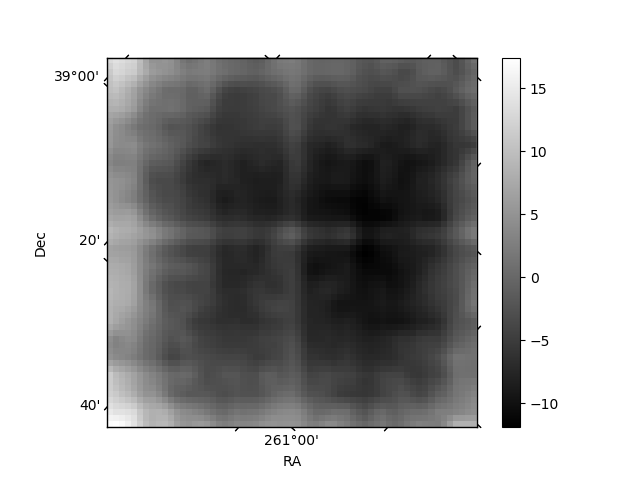
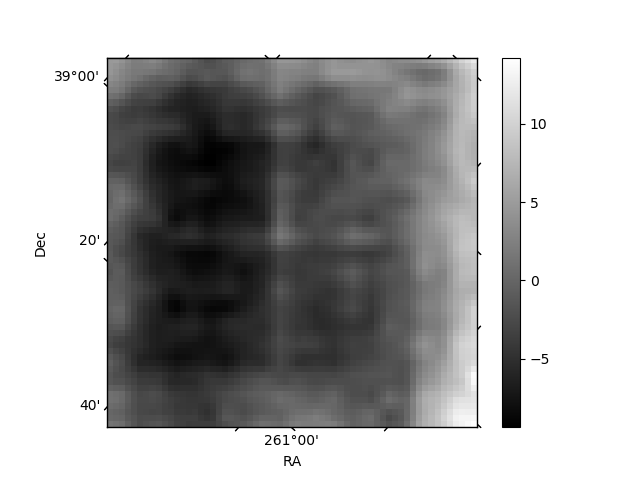
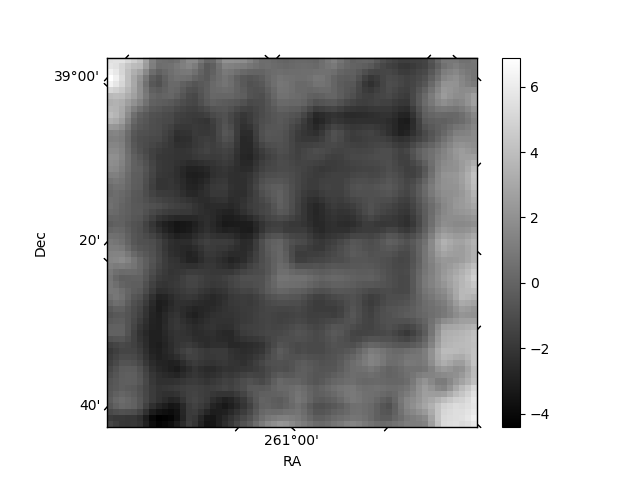
Histogram calculated using DETX and DETY for each event in the final _common_clean file
| Quadrant A | 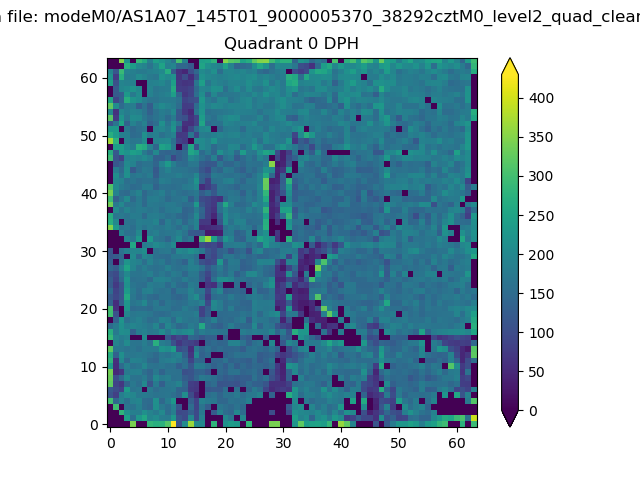 |
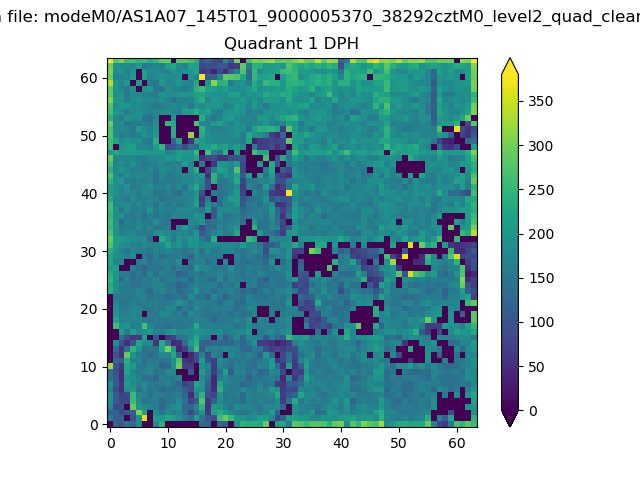 |
Quadrant B |
|---|---|---|---|
| Quadrant D | 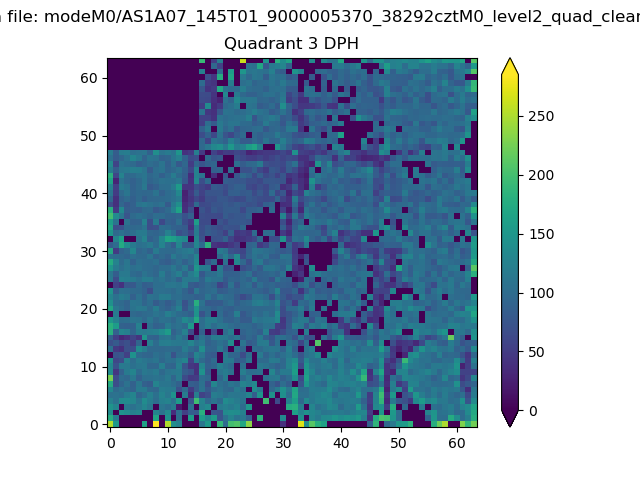 |
 |
Quadrant C |
| Plot type | Count rate plots | Images |
|---|---|---|
| Comparison with Poisson distribution Blue bars denote a histogram of data divided into 1 sec bins. Red curve is a Poisson curve with rate = median count rate of data. |
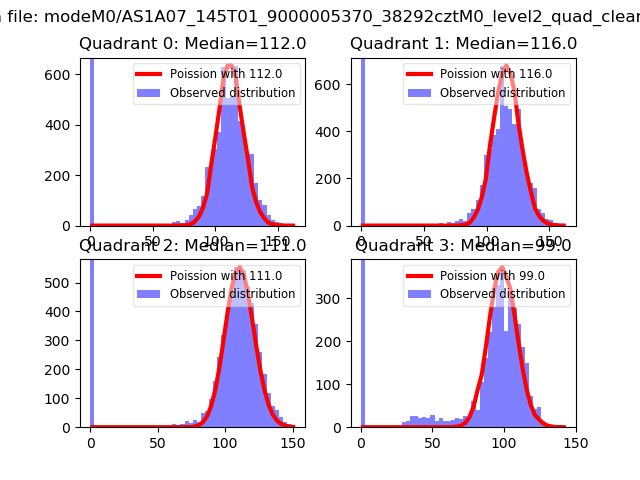 |
 |
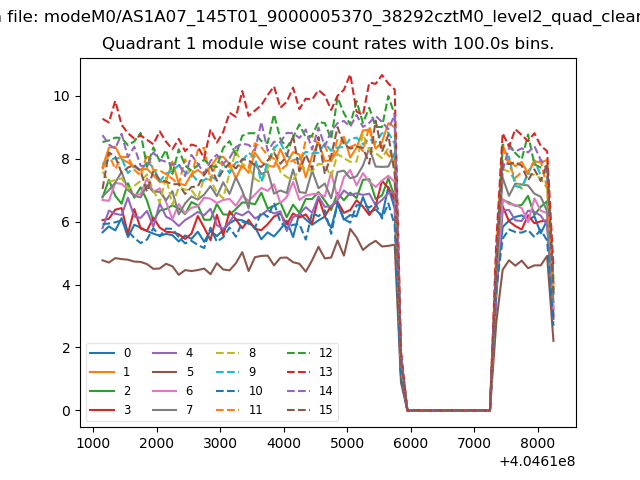
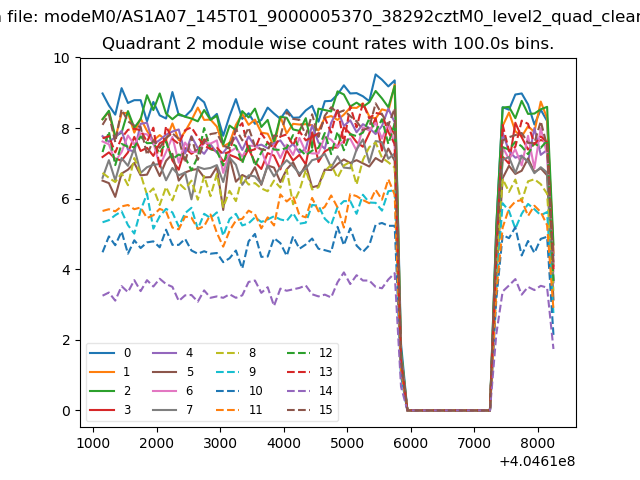
| Quadrant-wise count rates Data is divided into 100 sec bins |
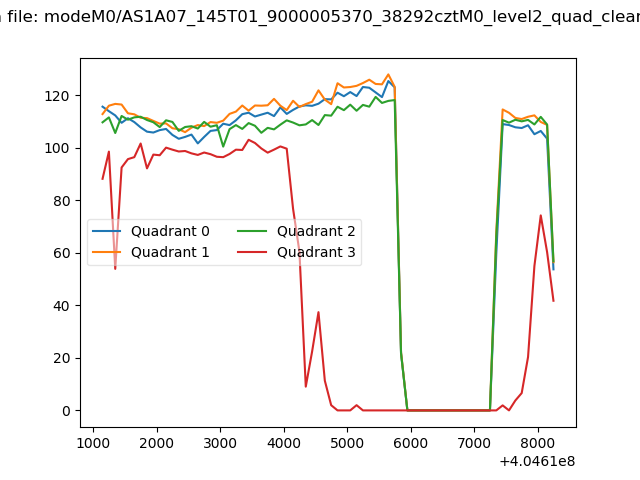 |
|
| Module-wise count rates for Quadrant A Data is divided into 100 sec bins |
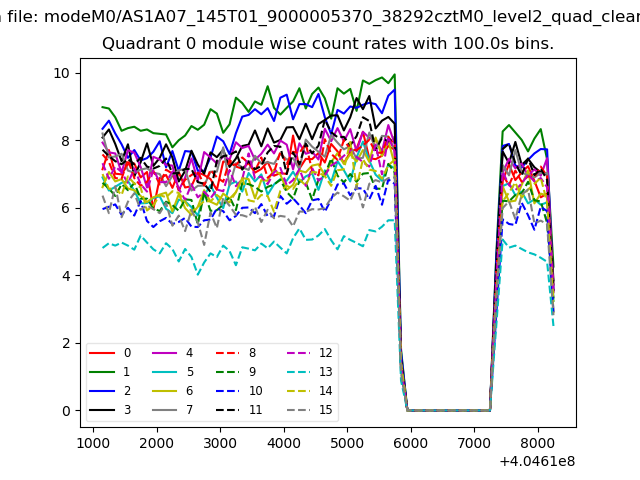 |
 |
| Module-wise count rates for Quadrant B Data is divided into 100 sec bins |
 |
 |
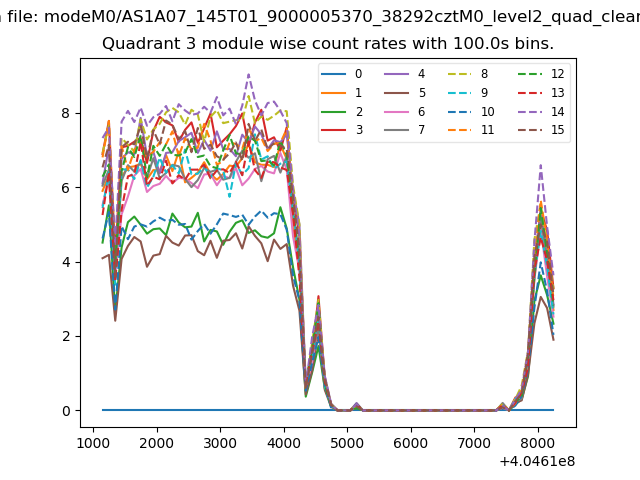
| Module-wise count rates for Quadrant C Data is divided into 100 sec bins |
 |
 |
| Module-wise count rates for Quadrant D Data is divided into 100 sec bins |
 |
 |
| Parameter | Plot |
|---|---|
| CZT HV Monitor | 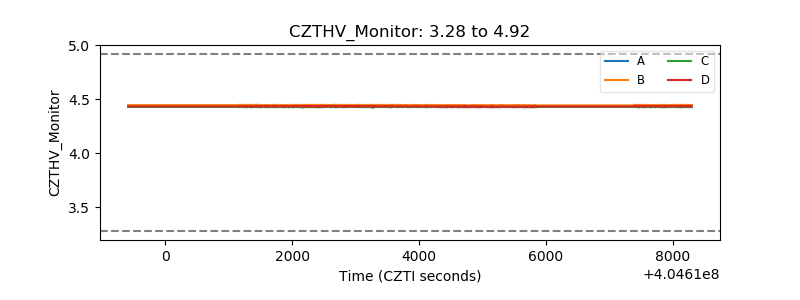 |
| D_VDD | 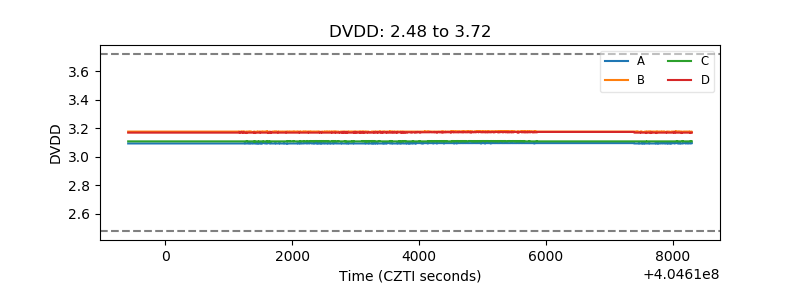 |
| Temperature 1 | 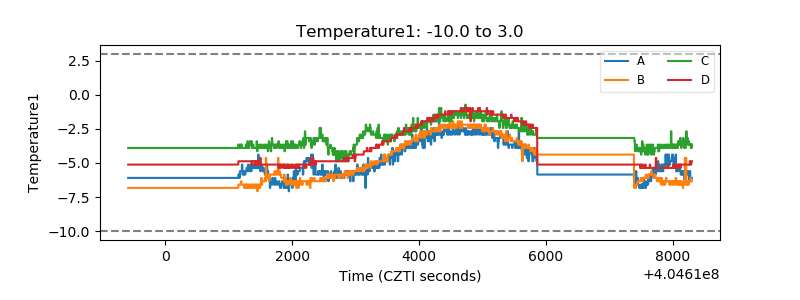 |
| Veto HV Monitor | 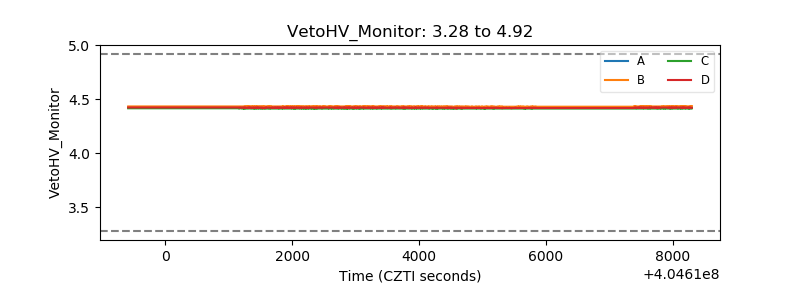 |
| Veto LLD | 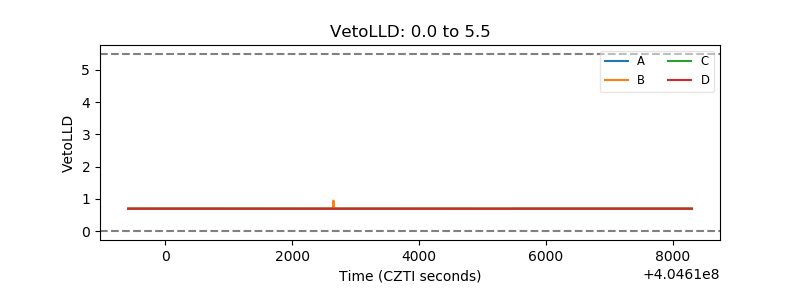 |
| Alpha Counter | 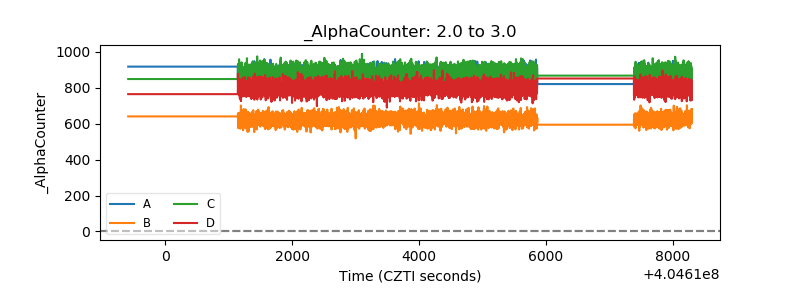 |
| _CPM_Rate | 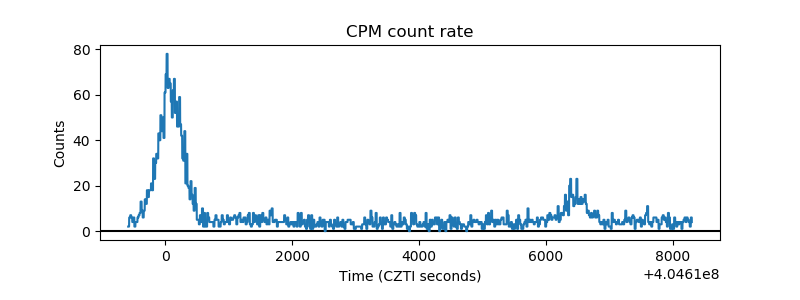 |
| CZT Counter | 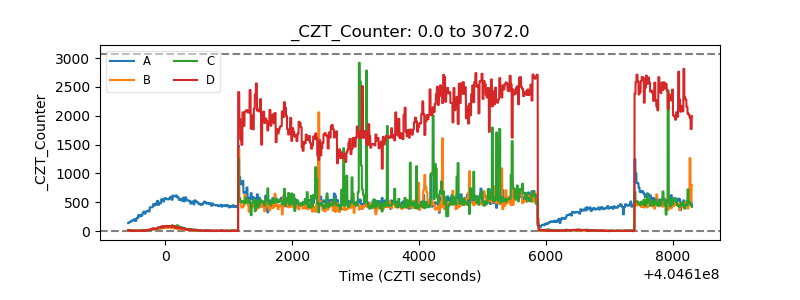 |
| +2.5 Volts monitor | 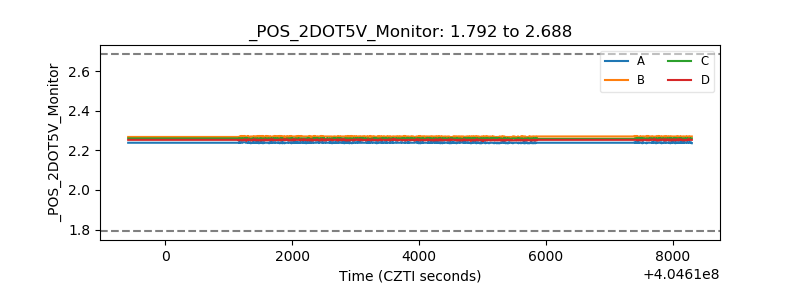 |
| +5 Volts monitor |  |
| _ROLL_ROT | 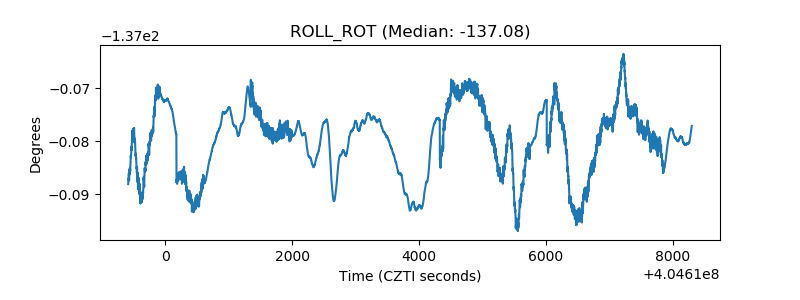 |
| _Roll_DEC | 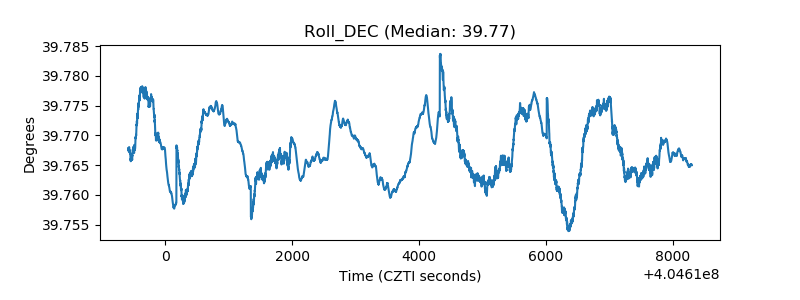 |
| _Roll_RA | 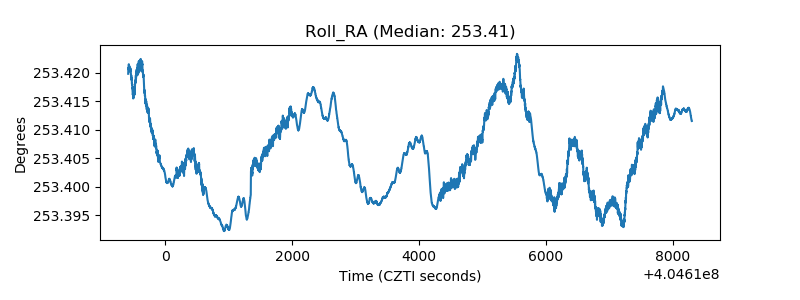 |
| Veto Counter | 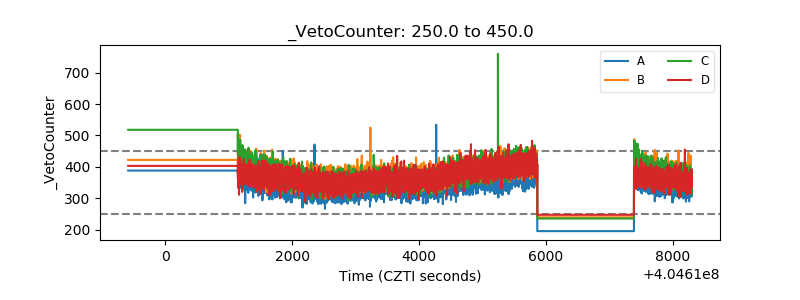 |