| Param | Original file | Final file |
|---|---|---|
| Filename | modeM0/AS1A07_145T01_9000005370_38294cztM0_level2.fits | modeM0/AS1A07_145T01_9000005370_38294cztM0_level2_quad_clean.evt |
| Size (bytes) | 618,168,960 | 89,922,240 |
| Size | 589.5 MB | 85.8 MB |
| Events in quadrant A | 3,510,003 | 674,491 |
| Events in quadrant B | 2,918,424 | 688,209 |
| Events in quadrant C | 3,007,346 | 665,476 |
| Events in quadrant D | 12,974,568 | 269,835 |
| Mode M9 | |||
|---|---|---|---|
| Quadrant | BADHDUFLAG | Total packets | Discarded packets |
| A | 0 | 21 | 0 |
| B | 0 | 21 | 0 |
| C | 0 | 21 | 0 |
| D | 0 | 22 | 0 |
| Mode SS | |||
|---|---|---|---|
| Quadrant | BADHDUFLAG | Total packets | Discarded packets |
| A | 0 | 124 | 0 |
| B | 0 | 124 | 0 |
| C | 0 | 124 | 0 |
| D | 0 | 124 | 0 |
| Mode M0 | |||
|---|---|---|---|
| Quadrant | BADHDUFLAG | Total packets | Discarded packets |
| A | 0 | 14016 | 3 |
| B | 0 | 12820 | 2 |
| C | 0 | 12611 | 2 |
| D | 0 | 42641 | 2 |
| Quadrant | Total seconds | Saturated seconds | Saturation percentage |
|---|---|---|---|
| A | 6080 | 52 | 0.855263% |
| B | 6080 | 60 | 0.986842% |
| C | 6080 | 4 | 0.065789% |
| D | 6080 | 3671 | 60.378289% |
Noise dominated data is calculated using 1-second bins in cleaned event files. If a bin has >2000 counts, and if more than 50% of those come from <1% of pixels, then it is considered to be noise-dominated and hence unusable.
| Quadrant | # 1 sec bins | Bins with >0 counts | Bins with >2000 counts | High rate bins dominated by noise | Noise dominated (total time) | Noise dominated (detector-on time) | Marked lightcurve |
|---|---|---|---|---|---|---|---|
| A | 7362 | 6081 | 69 | 69 | 0.94% | 1.13% | 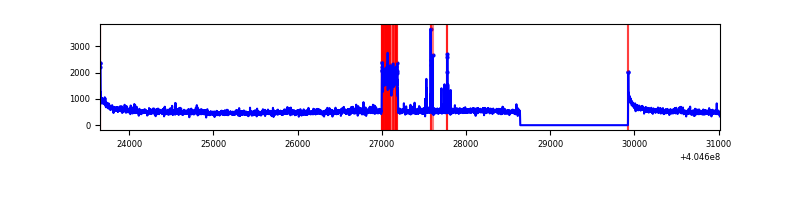 |
| B | 7362 | 6081 | 39 | 39 | 0.53% | 0.64% | 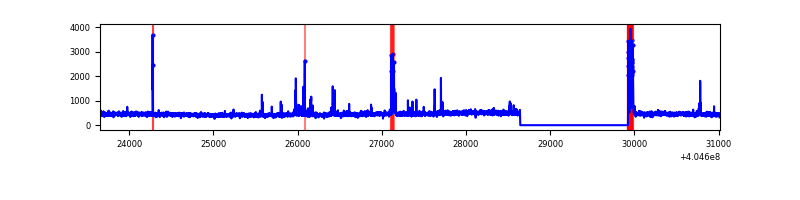 |
| C | 7362 | 6081 | 3 | 3 | 0.04% | 0.05% | 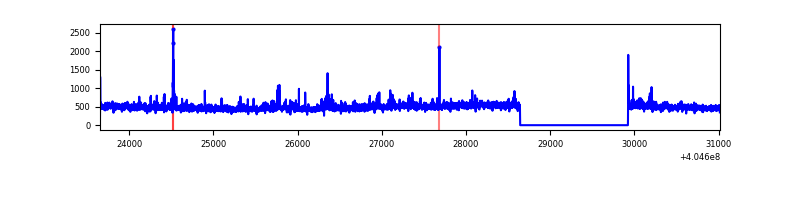 |
| D | 7362 | 6081 | 3694 | 3694 | 50.18% | 60.75% | 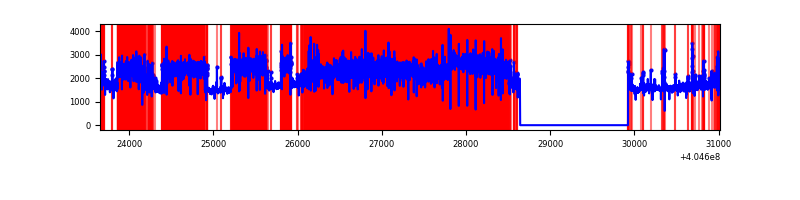 |
Top three noisy pixels from each quadrant. If the there are fewer than three noisy pixels in the level2.evt file, extra rows are filled as -1
| Pixel properties | Quadrant properties | ||||||
|---|---|---|---|---|---|---|---|
| Quadrant | DetID | PixID | Counts | Sigma | Mean | Median | Sigma |
| A | 10 | 83 | 412948 | 2959.78 | 679 | 666 | 139.3 |
| A | 0 | 247 | 263185 | 1884.63 | 679 | 666 | 139.3 |
| A | 12 | 16 | 129037 | 921.58 | 679 | 666 | 139.3 |
| B | 4 | 232 | 106870 | 811.83 | 674 | 654 | 130.8 |
| B | 5 | 172 | 60812 | 459.8 | 674 | 654 | 130.8 |
| B | 15 | 85 | 51161 | 386.04 | 674 | 654 | 130.8 |
| C | 15 | 214 | 257358 | 1652.16 | 661 | 666 | 155.4 |
| C | 15 | 208 | 117413 | 751.43 | 661 | 666 | 155.4 |
| C | 14 | 254 | 38405 | 242.9 | 661 | 666 | 155.4 |
| D | 10 | 203 | 9764110 | 70912.02 | 548 | 531 | 137.7 |
| D | 2 | 16 | 458246 | 3324.34 | 548 | 531 | 137.7 |
| D | 12 | 235 | 368836 | 2674.97 | 548 | 531 | 137.7 |
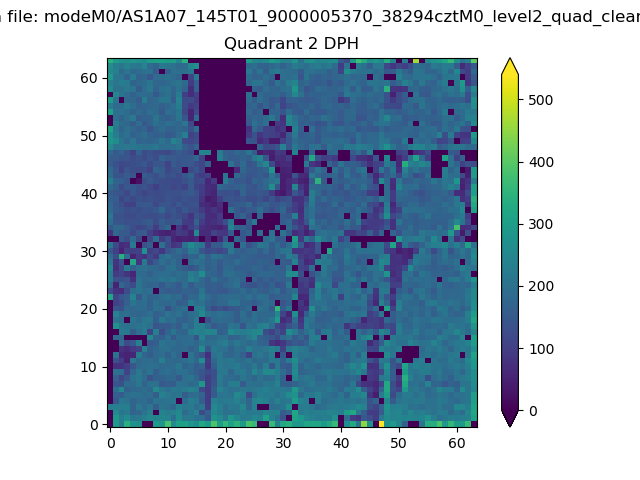
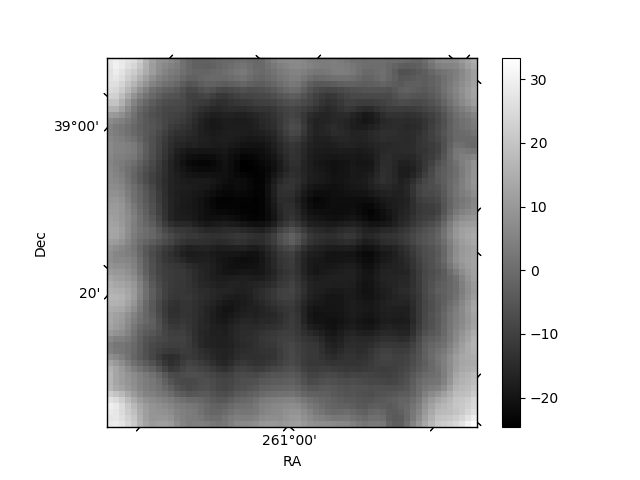
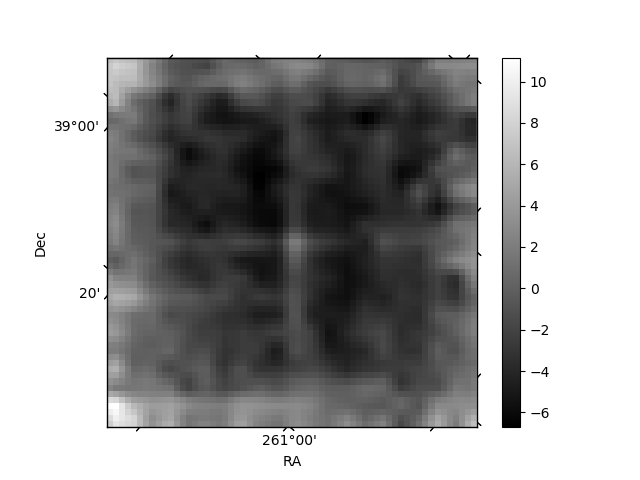
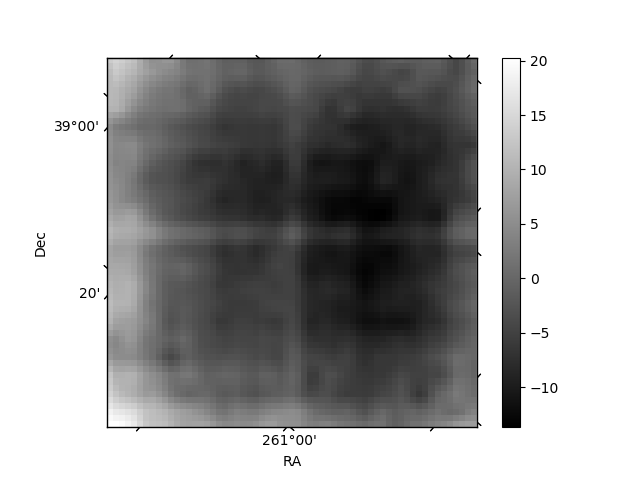
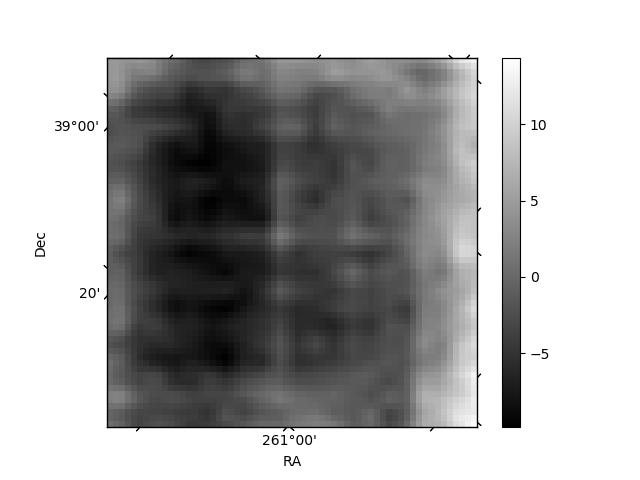
Histogram calculated using DETX and DETY for each event in the final _common_clean file
| Quadrant A | 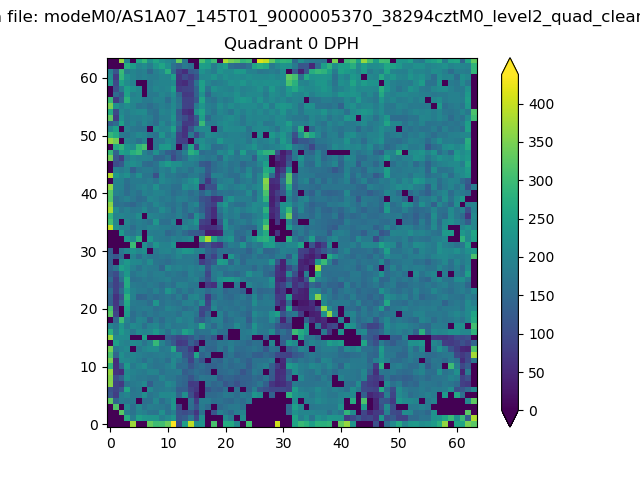 |
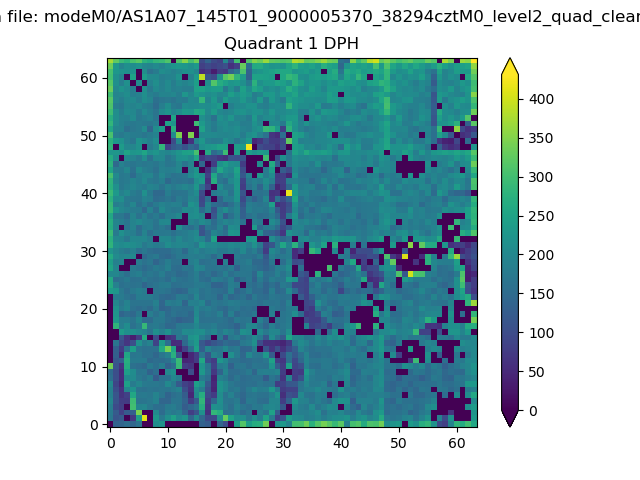 |
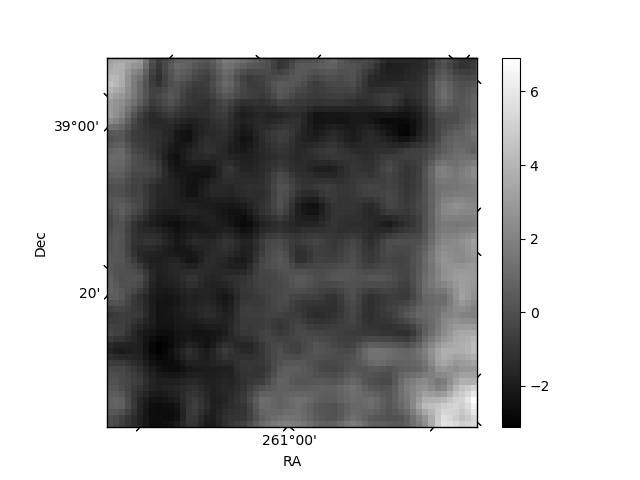
Quadrant B |
|---|---|---|---|
| Quadrant D | 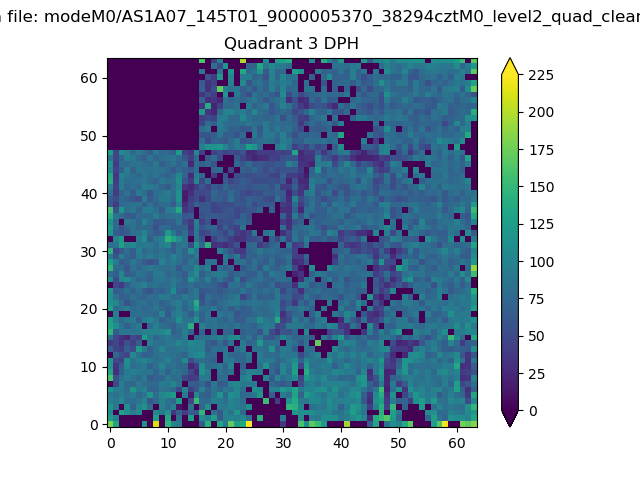 |
 |
Quadrant C |
| Plot type | Count rate plots | Images |
|---|---|---|
| Comparison with Poisson distribution Blue bars denote a histogram of data divided into 1 sec bins. Red curve is a Poisson curve with rate = median count rate of data. |
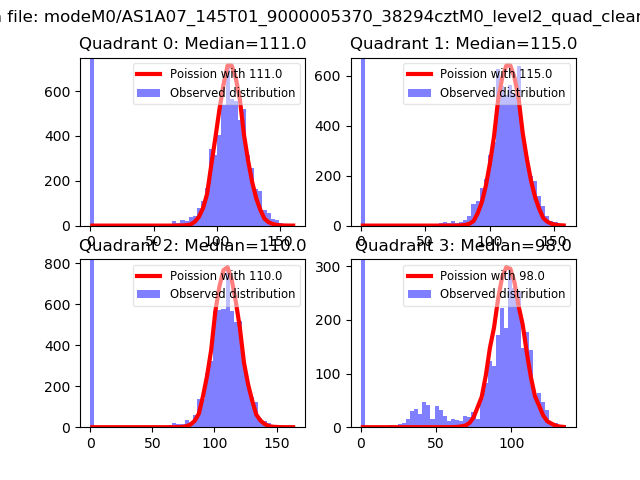 |
 |
| Quadrant-wise count rates Data is divided into 100 sec bins |
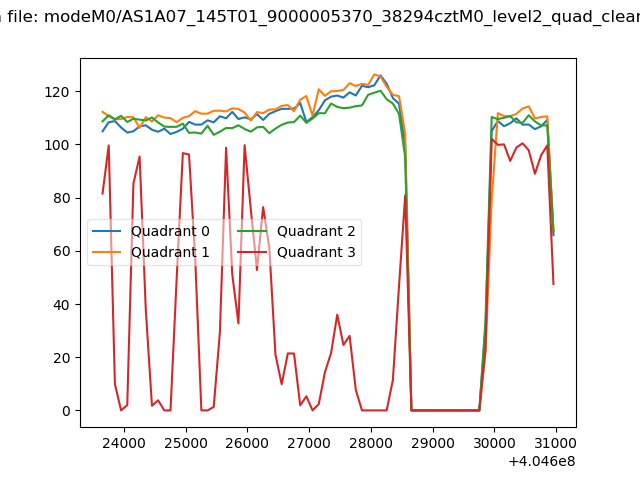 |
|
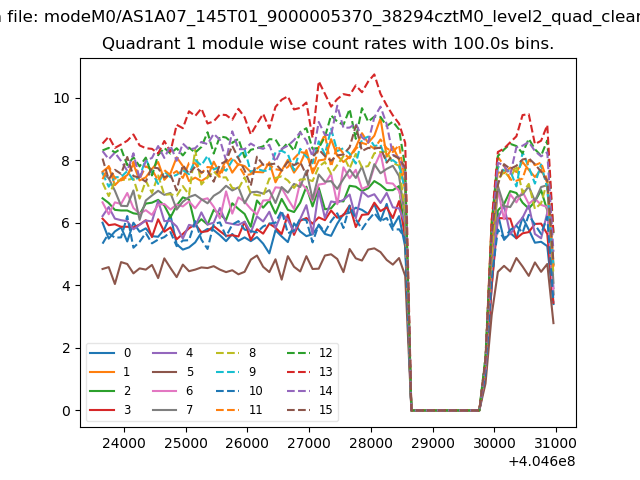
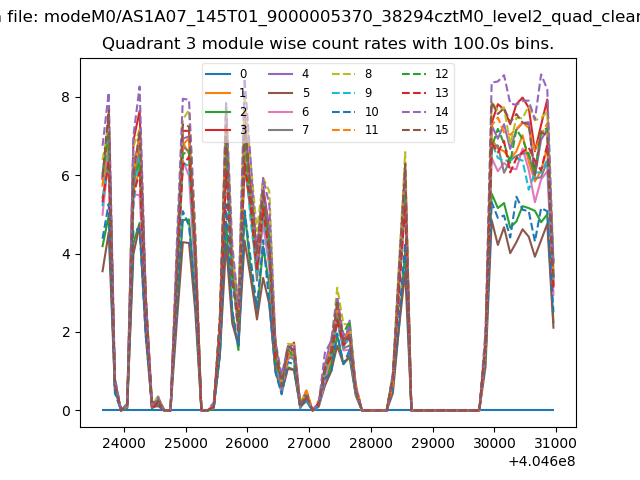
| Module-wise count rates for Quadrant A Data is divided into 100 sec bins |
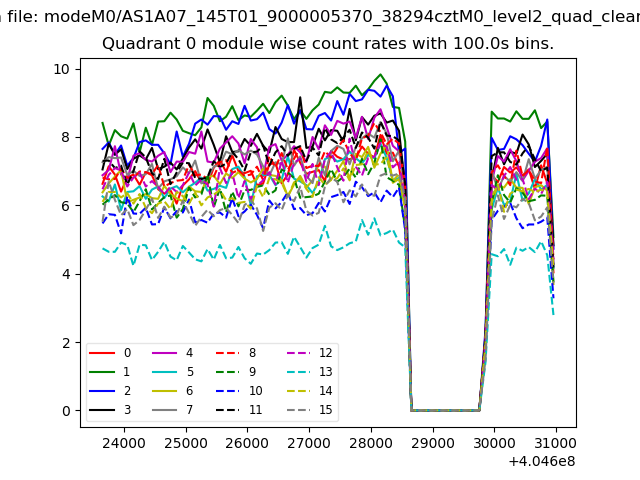 |
 |
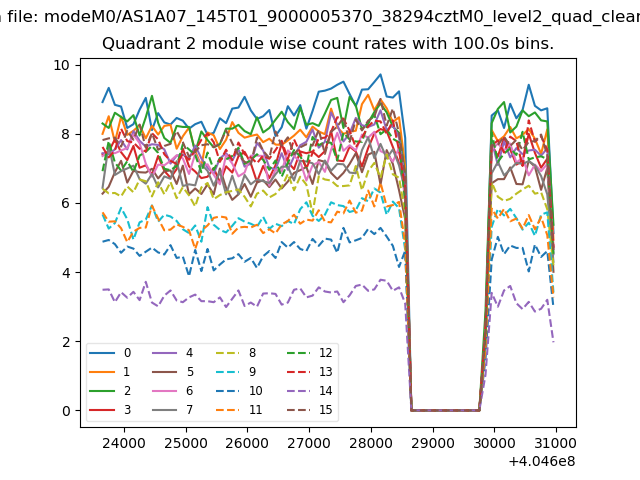
| Module-wise count rates for Quadrant B Data is divided into 100 sec bins |
 |
 |
| Module-wise count rates for Quadrant C Data is divided into 100 sec bins |
 |
 |
| Module-wise count rates for Quadrant D Data is divided into 100 sec bins |
 |
 |
| Parameter | Plot |
|---|---|
| CZT HV Monitor | 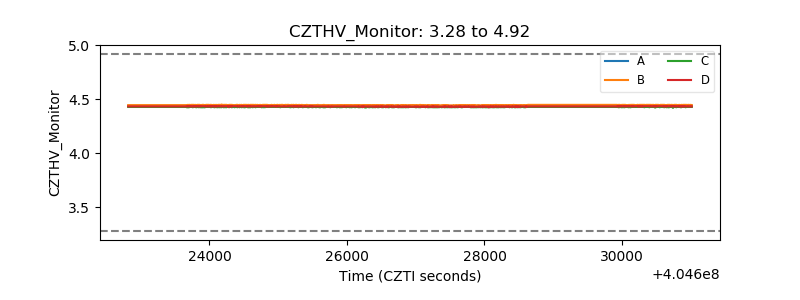 |
| D_VDD | 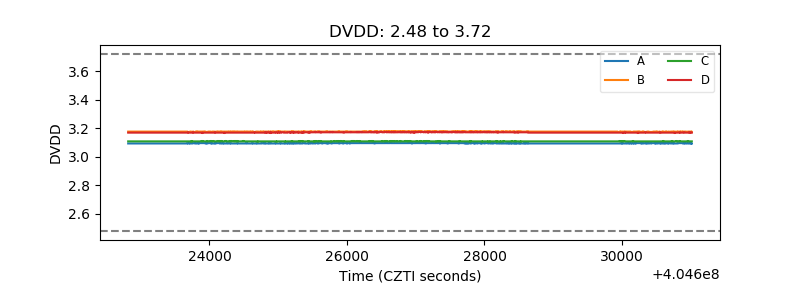 |
| Temperature 1 | 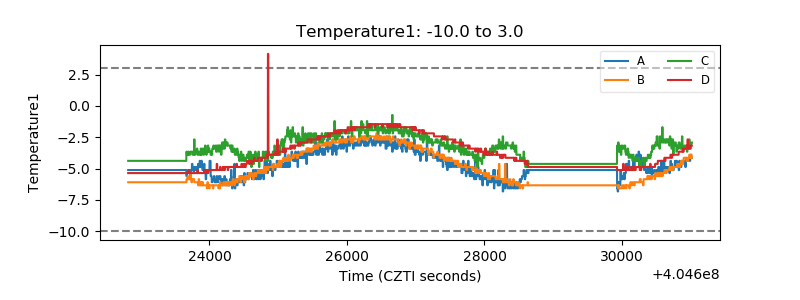 |
| Veto HV Monitor | 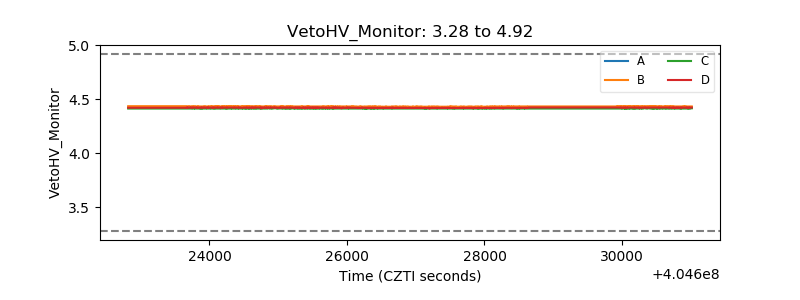 |
| Veto LLD | 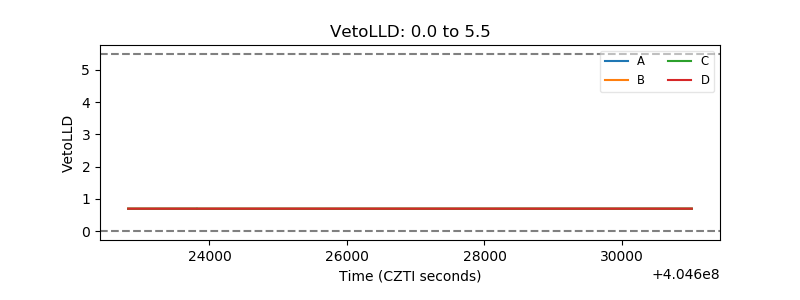 |
| Alpha Counter | 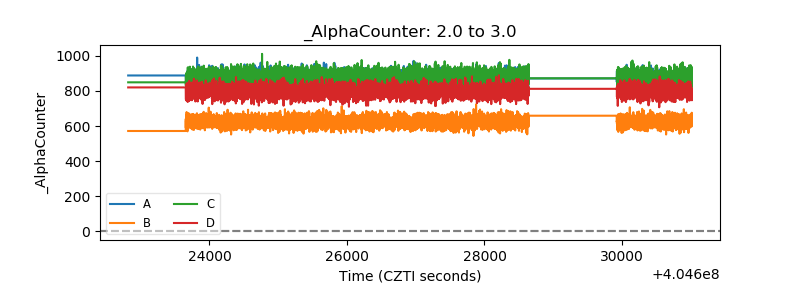 |
| _CPM_Rate |  |
| CZT Counter | 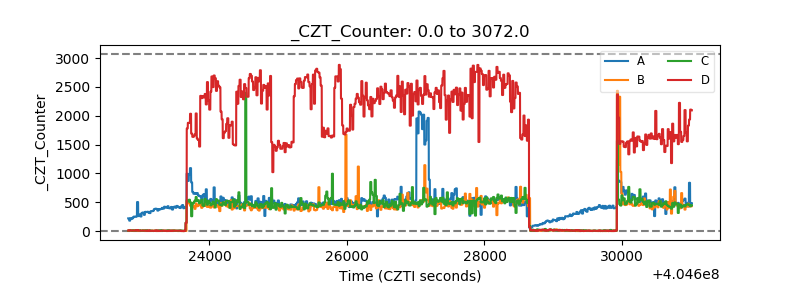 |
| +2.5 Volts monitor | 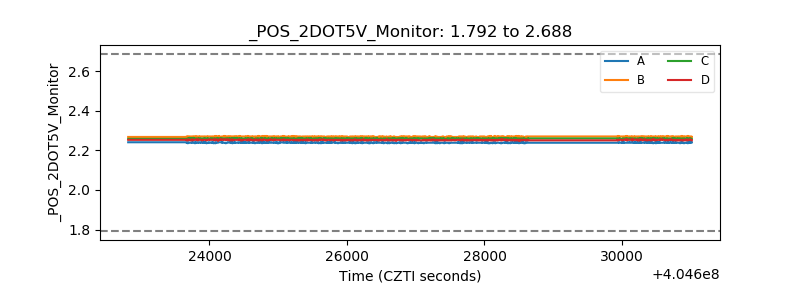 |
| +5 Volts monitor | 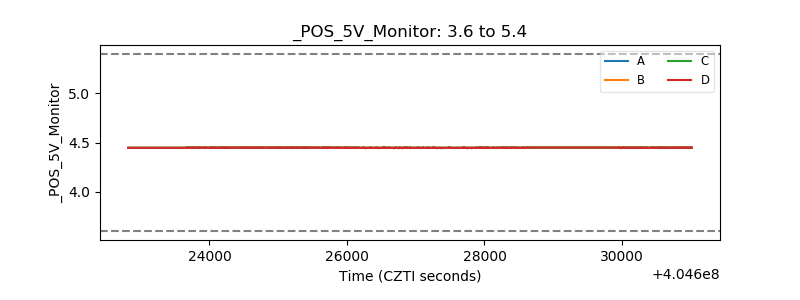 |
| _ROLL_ROT | 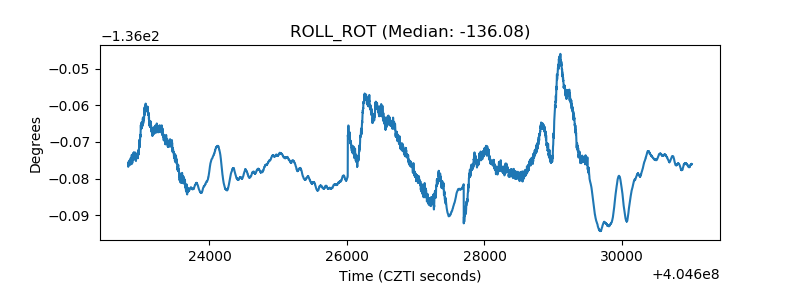 |
| _Roll_DEC | 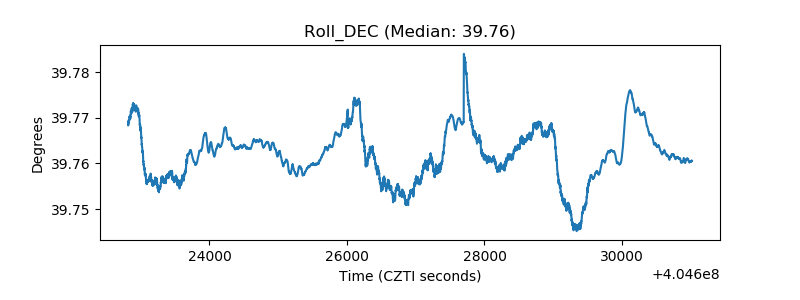 |
| _Roll_RA | 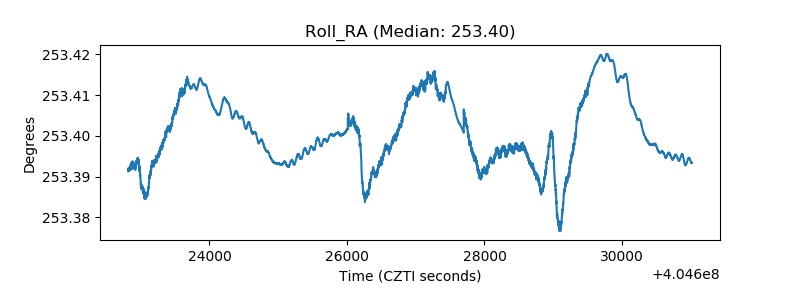 |
| Veto Counter | 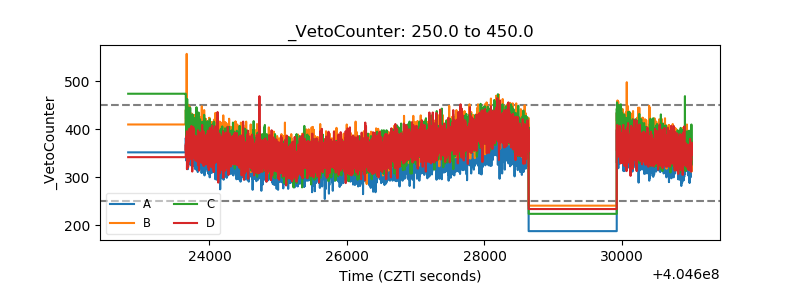 |