| Param | Original file | Final file |
|---|---|---|
| Filename | modeM0/AS1A07_145T01_9000005370_38296cztM0_level2.fits | modeM0/AS1A07_145T01_9000005370_38296cztM0_level2_quad_clean.evt |
| Size (bytes) | 1,091,612,160 | 160,761,600 |
| Size | 1.0 GB | 153.3 MB |
| Events in quadrant A | 5,556,356 | 1,198,456 |
| Events in quadrant B | 5,723,602 | 1,217,663 |
| Events in quadrant C | 5,358,031 | 1,163,967 |
| Events in quadrant D | 22,931,407 | 536,332 |
| Mode M9 | |||
|---|---|---|---|
| Quadrant | BADHDUFLAG | Total packets | Discarded packets |
| A | 0 | 30 | 0 |
| B | 0 | 30 | 0 |
| C | 0 | 30 | 0 |
| D | 0 | 31 | 0 |
| Mode SS | |||
|---|---|---|---|
| Quadrant | BADHDUFLAG | Total packets | Discarded packets |
| A | 0 | 222 | 0 |
| B | 0 | 222 | 0 |
| C | 0 | 222 | 0 |
| D | 0 | 222 | 0 |
| Mode M0 | |||
|---|---|---|---|
| Quadrant | BADHDUFLAG | Total packets | Discarded packets |
| A | 0 | 22962 | 4 |
| B | 0 | 24360 | 3 |
| C | 0 | 22456 | 3 |
| D | 0 | 75436 | 3 |
| Quadrant | Total seconds | Saturated seconds | Saturation percentage |
|---|---|---|---|
| A | 10840 | 13 | 0.119926% |
| B | 10840 | 232 | 2.140221% |
| C | 10840 | 32 | 0.295203% |
| D | 10840 | 6025 | 55.581181% |
Noise dominated data is calculated using 1-second bins in cleaned event files. If a bin has >2000 counts, and if more than 50% of those come from <1% of pixels, then it is considered to be noise-dominated and hence unusable.
| Quadrant | # 1 sec bins | Bins with >0 counts | Bins with >2000 counts | High rate bins dominated by noise | Noise dominated (total time) | Noise dominated (detector-on time) | Marked lightcurve |
|---|---|---|---|---|---|---|---|
| A | 13616 | 10842 | 3 | 3 | 0.02% | 0.03% | 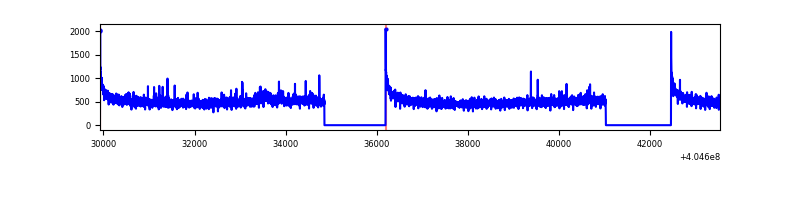 |
| B | 13616 | 10842 | 161 | 161 | 1.18% | 1.48% | 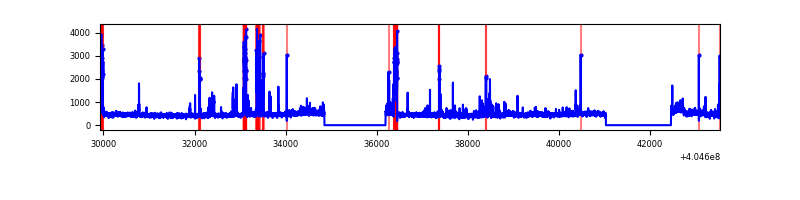 |
| C | 13616 | 10842 | 14 | 14 | 0.10% | 0.13% | 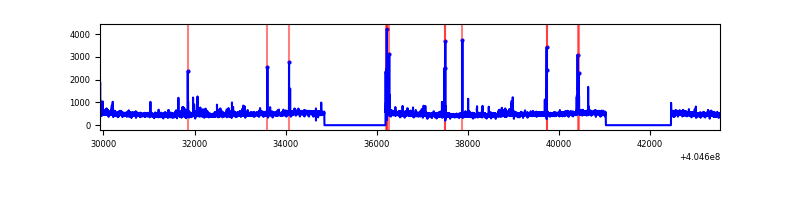 |
| D | 13616 | 10842 | 6052 | 6052 | 44.45% | 55.82% | 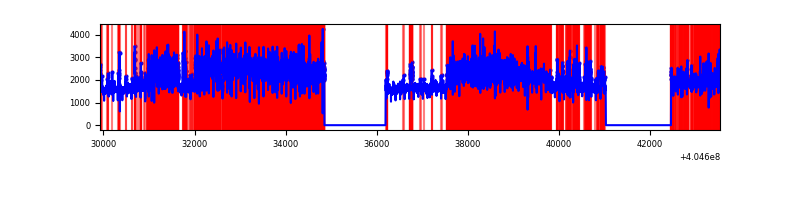 |
Top three noisy pixels from each quadrant. If the there are fewer than three noisy pixels in the level2.evt file, extra rows are filled as -1
| Pixel properties | Quadrant properties | ||||||
|---|---|---|---|---|---|---|---|
| Quadrant | DetID | PixID | Counts | Sigma | Mean | Median | Sigma |
| A | 10 | 83 | 710763 | 2925.62 | 1208 | 1183 | 242.5 |
| A | 12 | 16 | 68669 | 278.25 | 1208 | 1183 | 242.5 |
| A | 12 | 189 | 52906 | 213.26 | 1208 | 1183 | 242.5 |
| B | 5 | 184 | 589728 | 2581.16 | 1192 | 1159 | 228.0 |
| B | 0 | 183 | 106415 | 461.6 | 1192 | 1159 | 228.0 |
| B | 4 | 232 | 99194 | 429.93 | 1192 | 1159 | 228.0 |
| C | 15 | 214 | 453107 | 1654.49 | 1176 | 1183 | 273.2 |
| C | 15 | 208 | 177303 | 644.77 | 1176 | 1183 | 273.2 |
| C | 2 | 16 | 65385 | 235.04 | 1176 | 1183 | 273.2 |
| D | 10 | 203 | 16611852 | 70273.96 | 977 | 950 | 236.4 |
| D | 2 | 16 | 1461646 | 6179.61 | 977 | 950 | 236.4 |
| D | 12 | 235 | 388195 | 1638.28 | 977 | 950 | 236.4 |
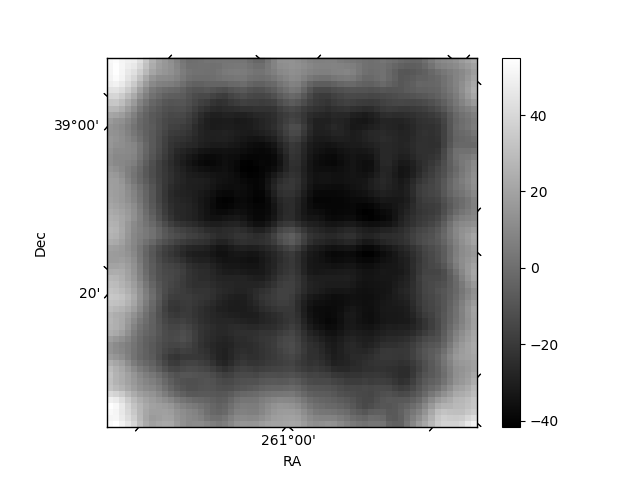
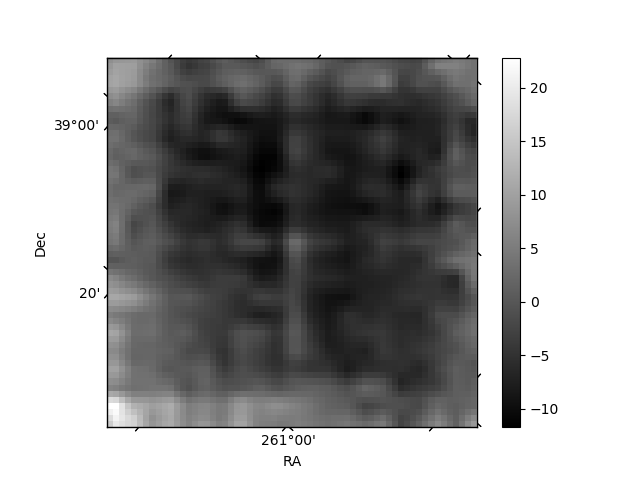
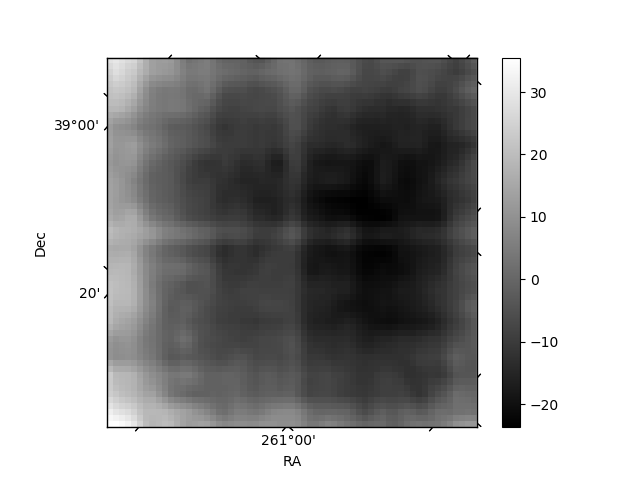
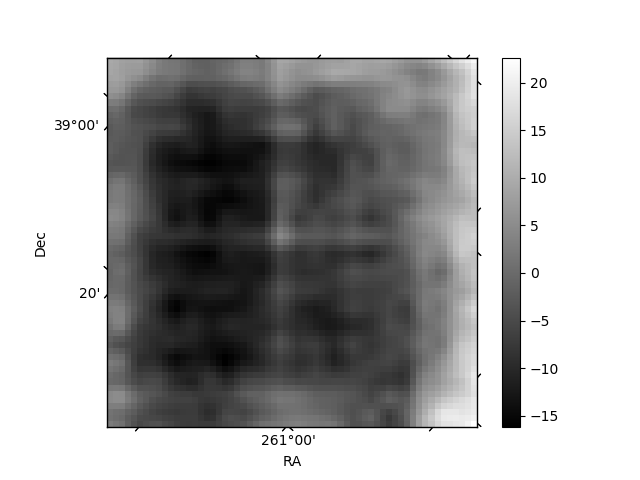
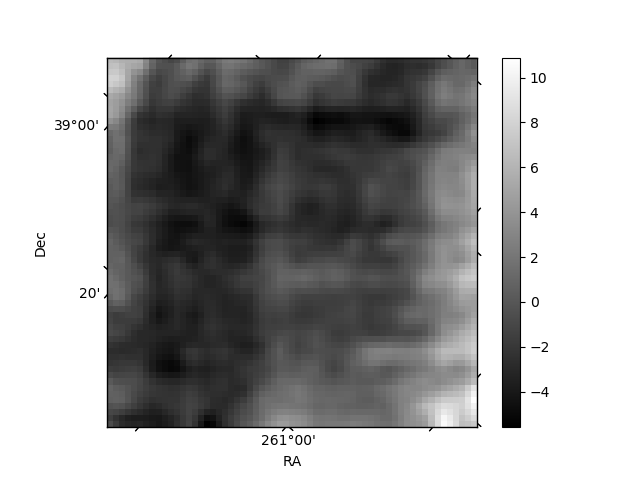
Histogram calculated using DETX and DETY for each event in the final _common_clean file
| Quadrant A | 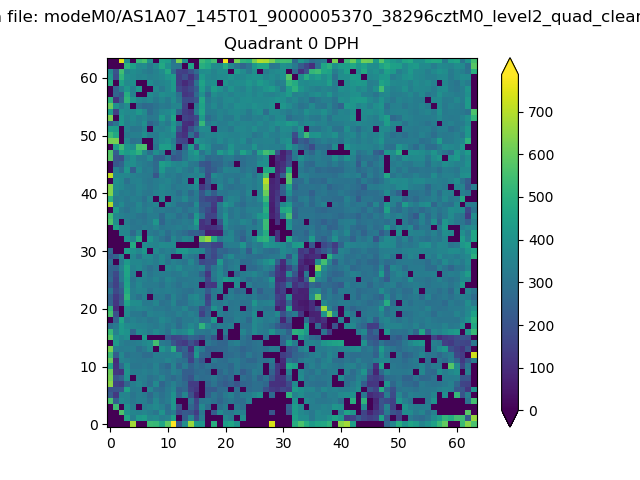 |
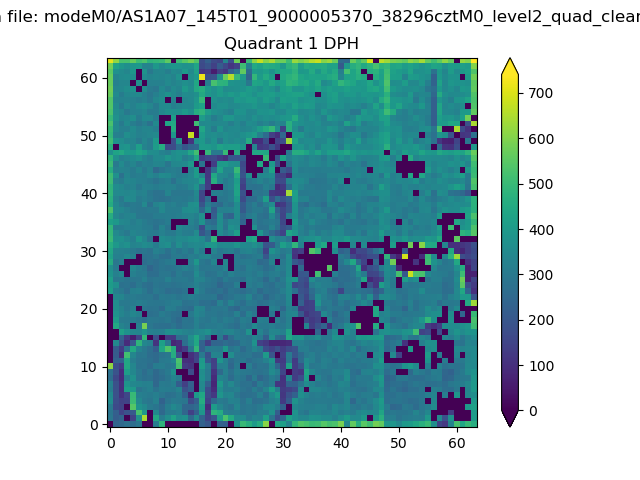 |
Quadrant B |
|---|---|---|---|
| Quadrant D | 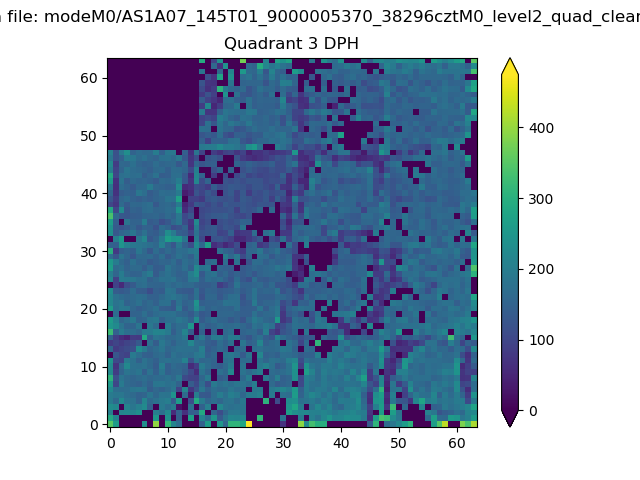 |
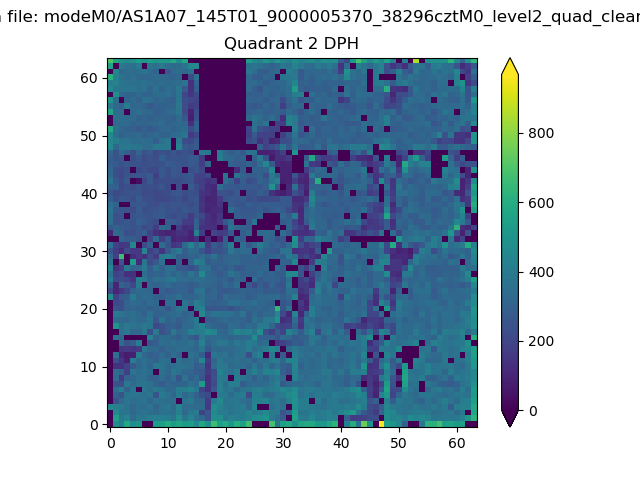 |
Quadrant C |
| Plot type | Count rate plots | Images |
|---|---|---|
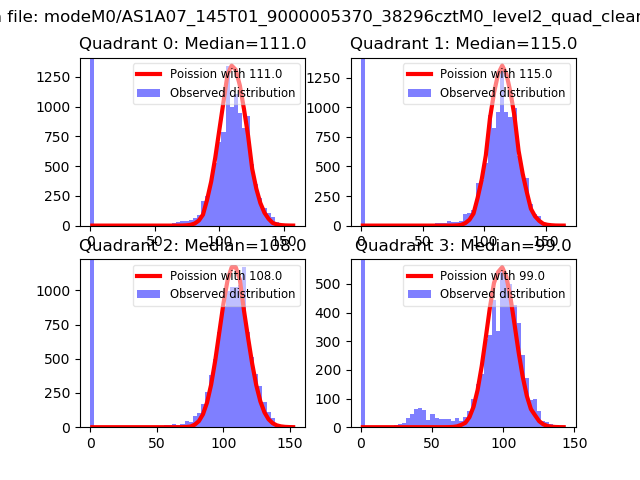
| Comparison with Poisson distribution Blue bars denote a histogram of data divided into 1 sec bins. Red curve is a Poisson curve with rate = median count rate of data. |
 |
 |
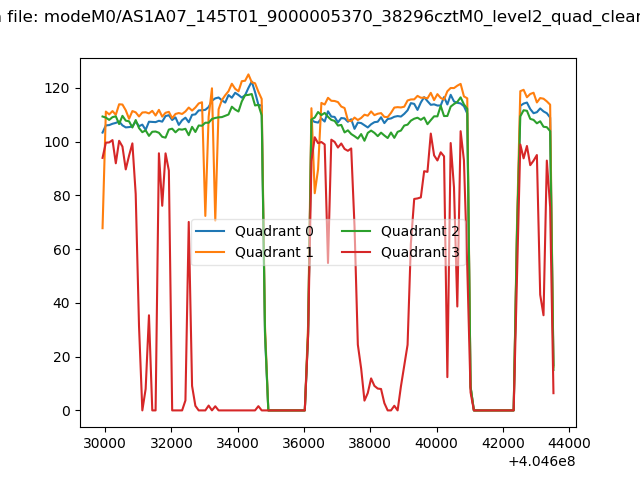
| Quadrant-wise count rates Data is divided into 100 sec bins |
 |
|
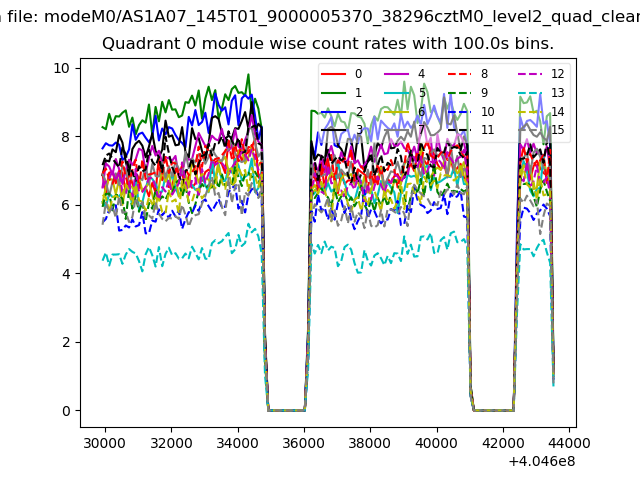
| Module-wise count rates for Quadrant A Data is divided into 100 sec bins |
 |
 |
| Module-wise count rates for Quadrant B Data is divided into 100 sec bins |
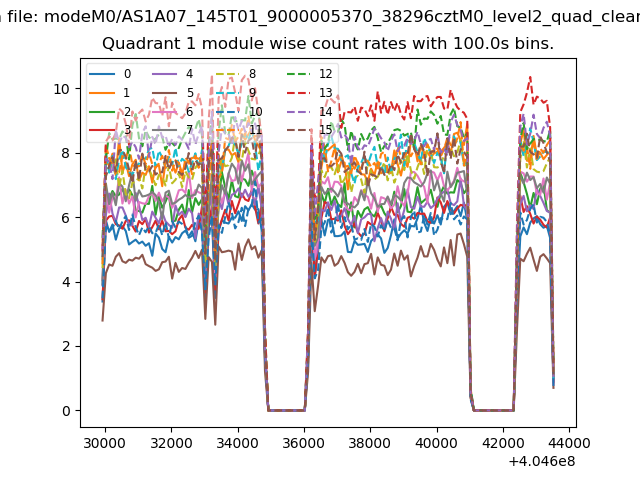 |
 |
| Module-wise count rates for Quadrant C Data is divided into 100 sec bins |
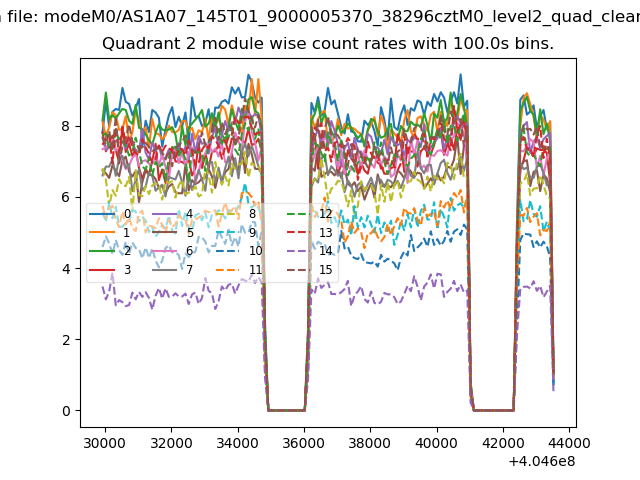 |
 |
| Module-wise count rates for Quadrant D Data is divided into 100 sec bins |
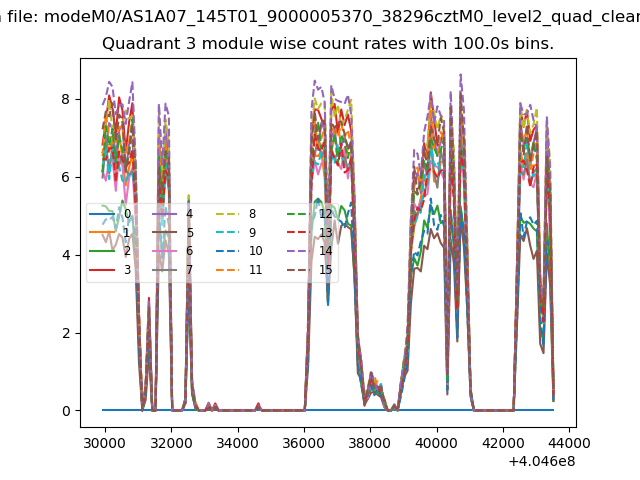 |
 |
| Parameter | Plot |
|---|---|
| CZT HV Monitor | 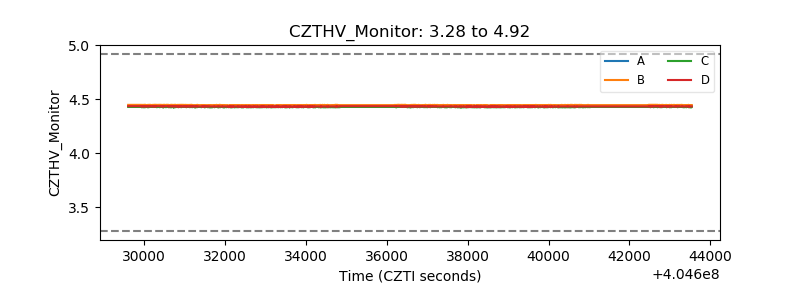 |
| D_VDD | 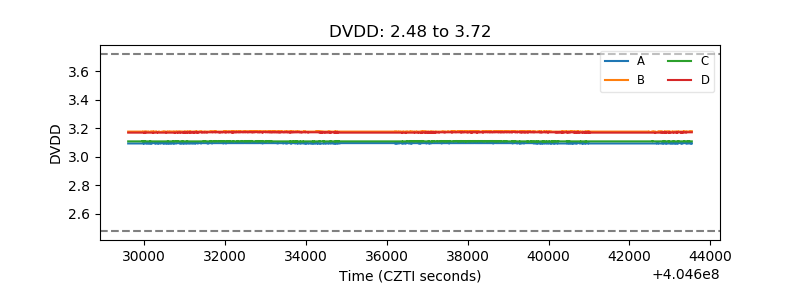 |
| Temperature 1 | 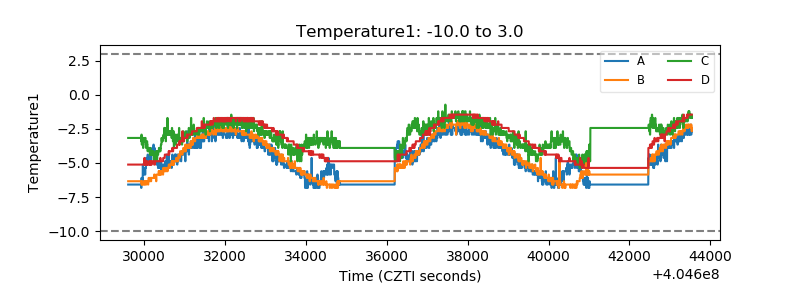 |
| Veto HV Monitor | 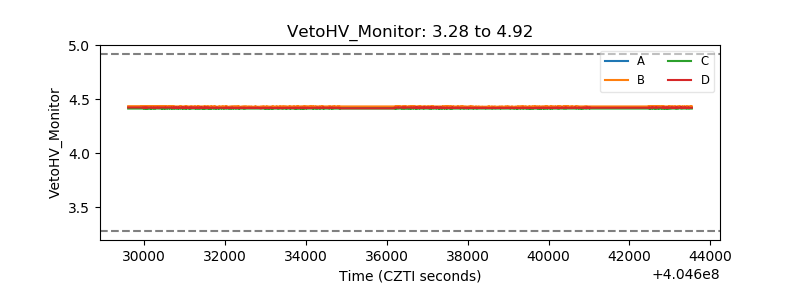 |
| Veto LLD | 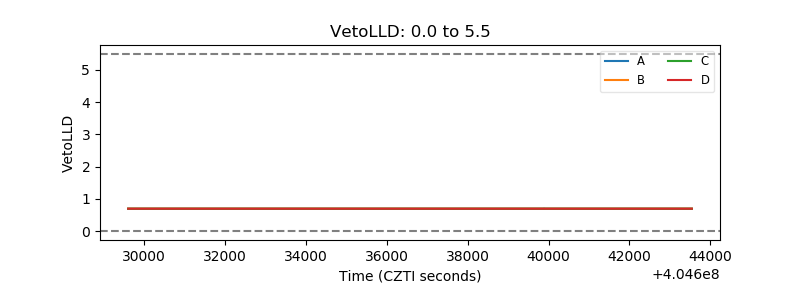 |
| Alpha Counter |  |
| _CPM_Rate | 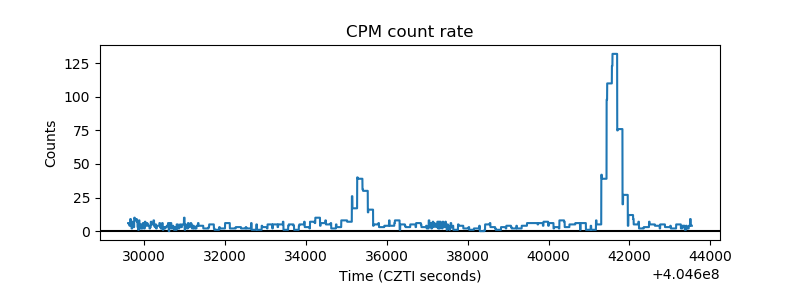 |
| CZT Counter | 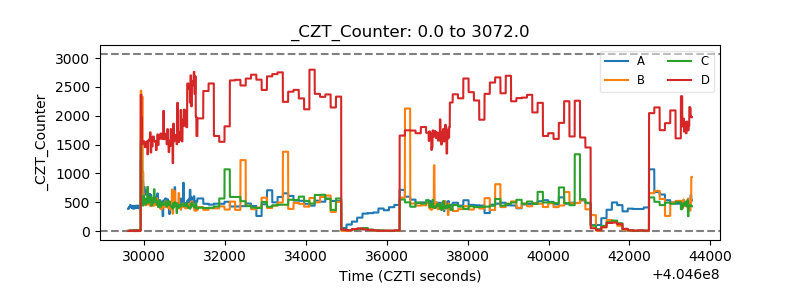 |
| +2.5 Volts monitor | 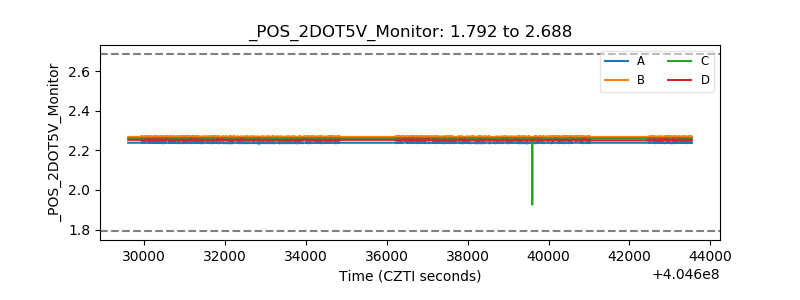 |
| +5 Volts monitor | 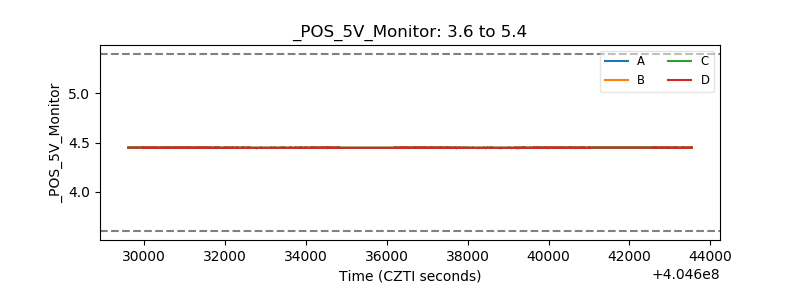 |
| _ROLL_ROT | 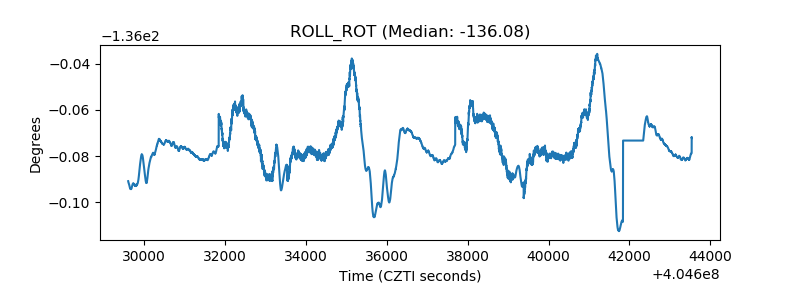 |
| _Roll_DEC | 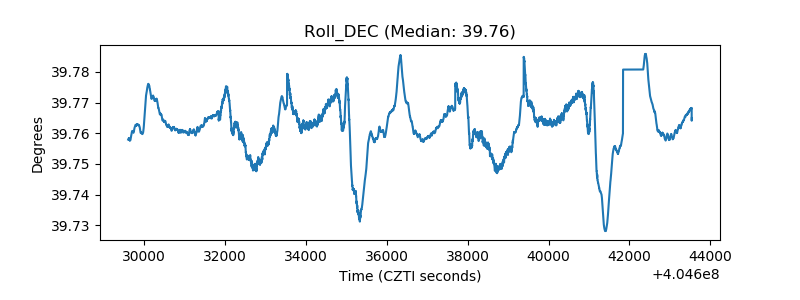 |
| _Roll_RA |  |
| Veto Counter | 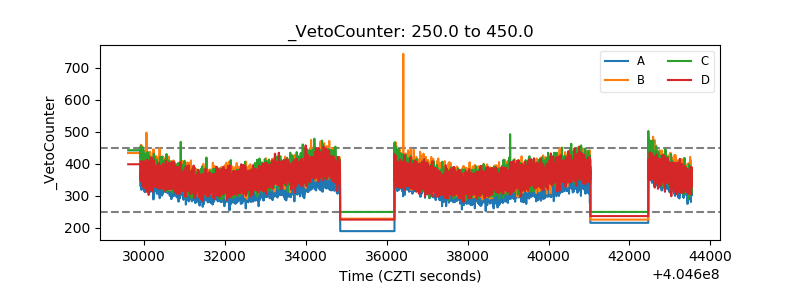 |