| Param | Original file | Final file |
|---|---|---|
| Filename | modeM0/AS1A07_145T01_9000005370_38297cztM0_level2.fits | modeM0/AS1A07_145T01_9000005370_38297cztM0_level2_quad_clean.evt |
| Size (bytes) | 558,025,920 | 88,009,920 |
| Size | 532.2 MB | 83.9 MB |
| Events in quadrant A | 2,959,588 | 644,691 |
| Events in quadrant B | 2,939,865 | 655,238 |
| Events in quadrant C | 2,808,646 | 619,252 |
| Events in quadrant D | 11,505,233 | 346,608 |
| Mode M9 | |||
|---|---|---|---|
| Quadrant | BADHDUFLAG | Total packets | Discarded packets |
| A | 0 | 16 | 0 |
| B | 0 | 16 | 0 |
| C | 0 | 16 | 0 |
| D | 0 | 17 | 0 |
| Mode SS | |||
|---|---|---|---|
| Quadrant | BADHDUFLAG | Total packets | Discarded packets |
| A | 0 | 116 | 0 |
| B | 0 | 116 | 0 |
| C | 0 | 116 | 0 |
| D | 0 | 116 | 0 |
| Mode M0 | |||
|---|---|---|---|
| Quadrant | BADHDUFLAG | Total packets | Discarded packets |
| A | 0 | 12203 | 3 |
| B | 0 | 12531 | 2 |
| C | 0 | 11844 | 2 |
| D | 0 | 38130 | 2 |
| Quadrant | Total seconds | Saturated seconds | Saturation percentage |
|---|---|---|---|
| A | 5704 | 14 | 0.245442% |
| B | 5704 | 61 | 1.069425% |
| C | 5704 | 28 | 0.490884% |
| D | 5704 | 2775 | 48.650070% |
Noise dominated data is calculated using 1-second bins in cleaned event files. If a bin has >2000 counts, and if more than 50% of those come from <1% of pixels, then it is considered to be noise-dominated and hence unusable.
| Quadrant | # 1 sec bins | Bins with >0 counts | Bins with >2000 counts | High rate bins dominated by noise | Noise dominated (total time) | Noise dominated (detector-on time) | Marked lightcurve |
|---|---|---|---|---|---|---|---|
| A | 7257 | 5705 | 5 | 5 | 0.07% | 0.09% | 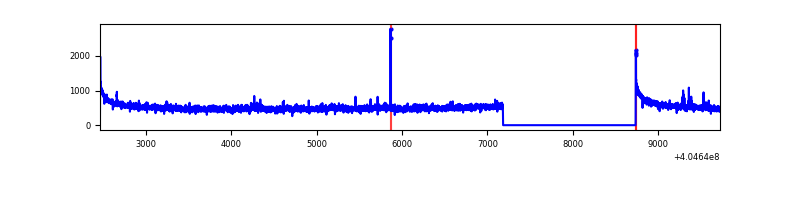 |
| B | 7257 | 5705 | 34 | 34 | 0.47% | 0.60% | 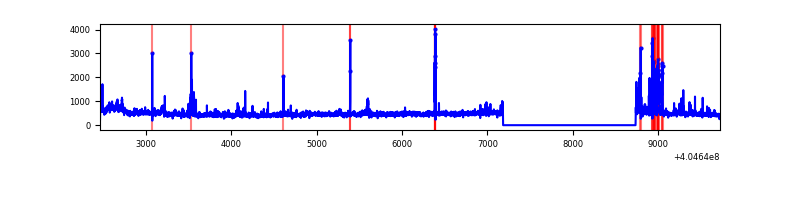 |
| C | 7257 | 5705 | 20 | 20 | 0.28% | 0.35% | 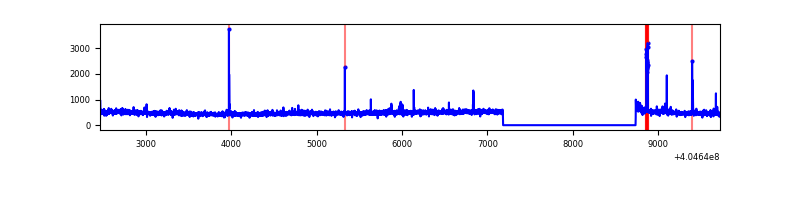 |
| D | 7257 | 5705 | 2978 | 2978 | 41.04% | 52.20% | 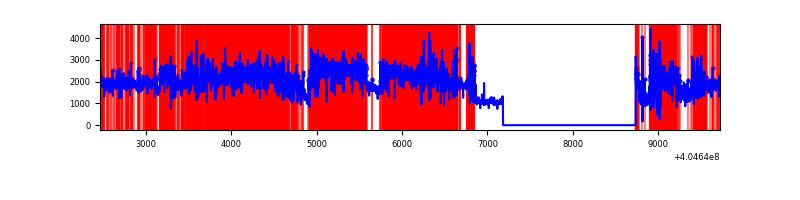 |
Top three noisy pixels from each quadrant. If the there are fewer than three noisy pixels in the level2.evt file, extra rows are filled as -1
| Pixel properties | Quadrant properties | ||||||
|---|---|---|---|---|---|---|---|
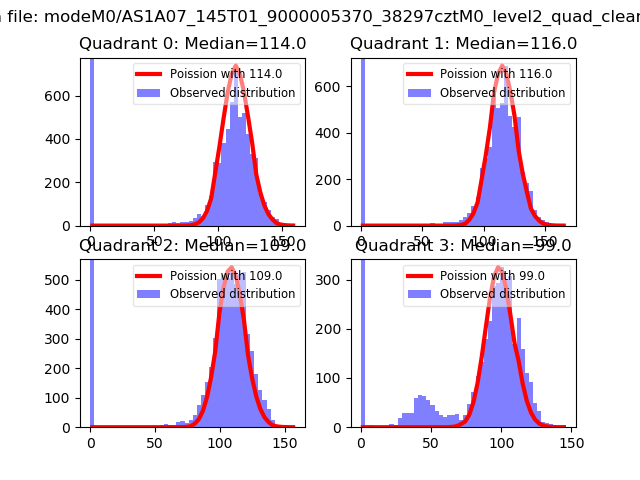
| Quadrant | DetID | PixID | Counts | Sigma | Mean | Median | Sigma |
| A | 10 | 83 | 399892 | 3101.28 | 635 | 620 | 128.7 |
| A | 12 | 189 | 53220 | 408.56 | 635 | 620 | 128.7 |
| A | 13 | 6 | 22022 | 166.24 | 635 | 620 | 128.7 |
| B | 5 | 184 | 228765 | 1877.54 | 627 | 610 | 121.5 |
| B | 0 | 183 | 65540 | 534.32 | 627 | 610 | 121.5 |
| B | 0 | 199 | 54262 | 441.51 | 627 | 610 | 121.5 |
| C | 15 | 214 | 240032 | 1674.49 | 614 | 616 | 143.0 |
| C | 2 | 16 | 76301 | 529.35 | 614 | 616 | 143.0 |
| C | 15 | 208 | 54890 | 379.6 | 614 | 616 | 143.0 |
| D | 10 | 203 | 7219895 | 54863.52 | 543 | 527 | 131.6 |
| D | 2 | 16 | 1514882 | 11508.33 | 543 | 527 | 131.6 |
| D | 13 | 138 | 275914 | 2092.8 | 543 | 527 | 131.6 |
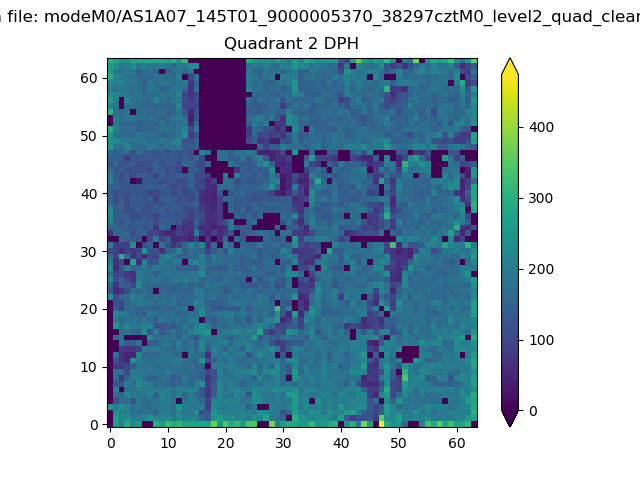
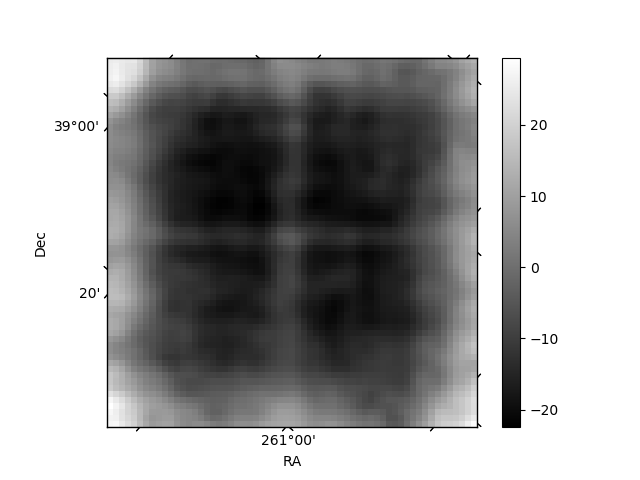
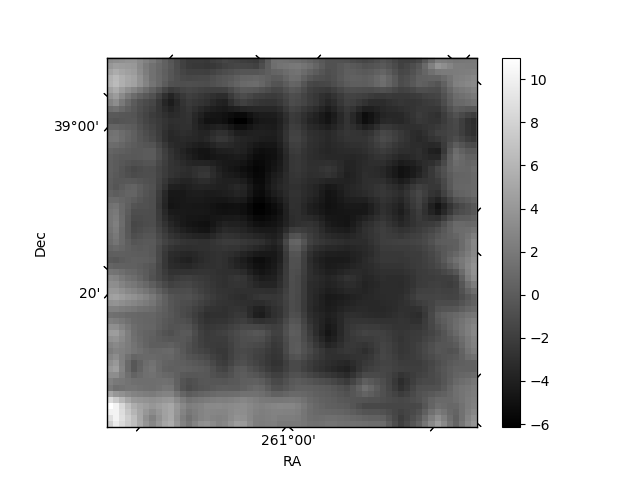
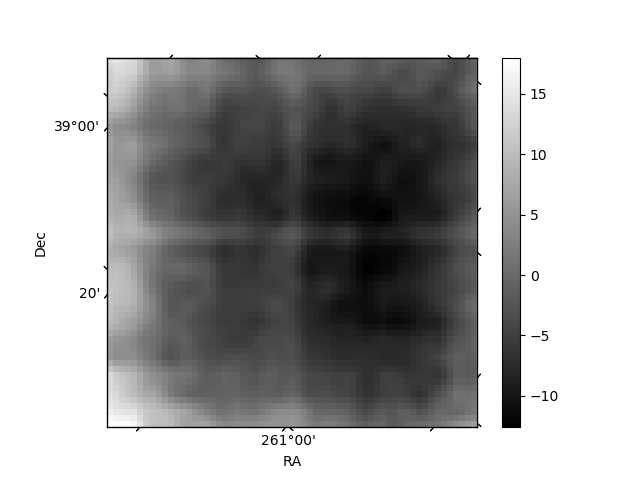
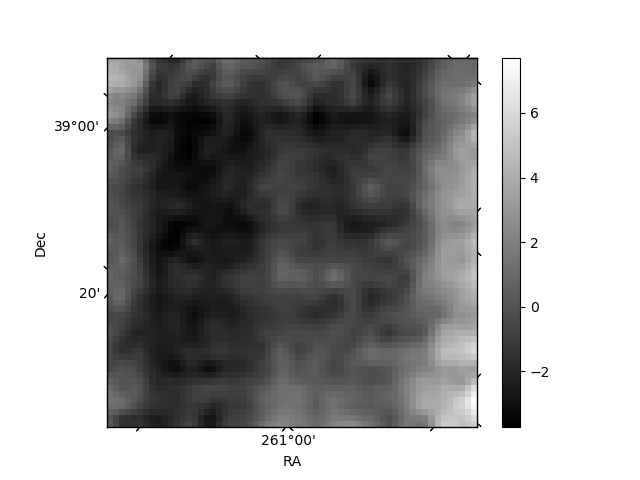
Histogram calculated using DETX and DETY for each event in the final _common_clean file
| Quadrant A | 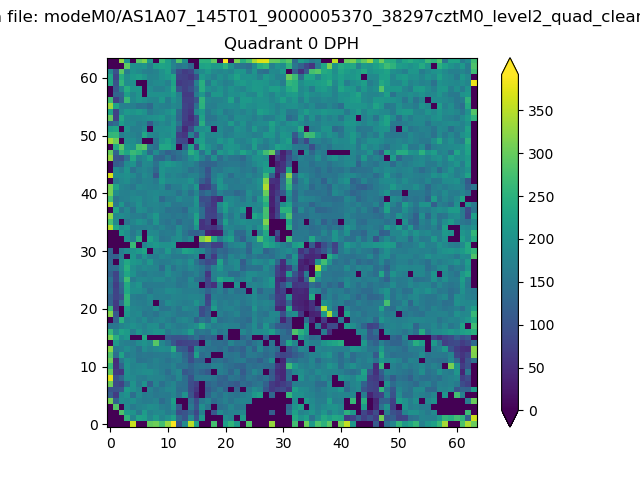 |
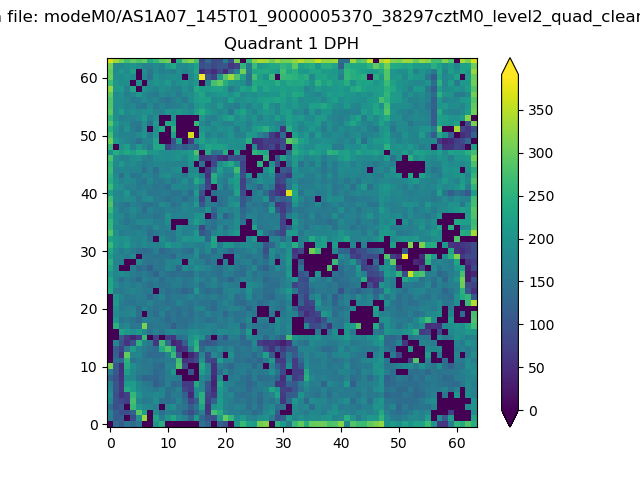 |
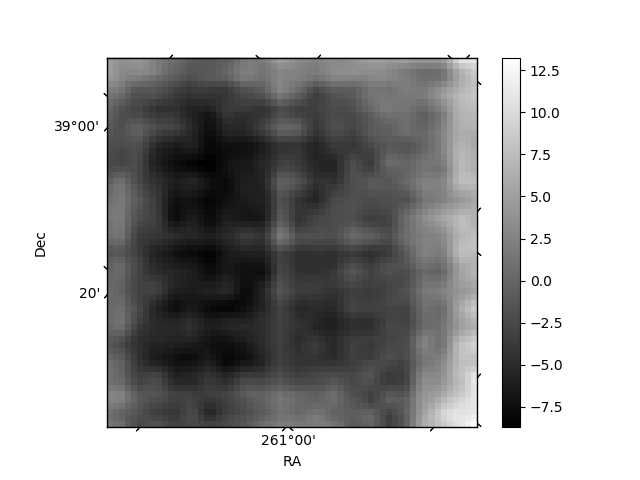
Quadrant B |
|---|---|---|---|
| Quadrant D | 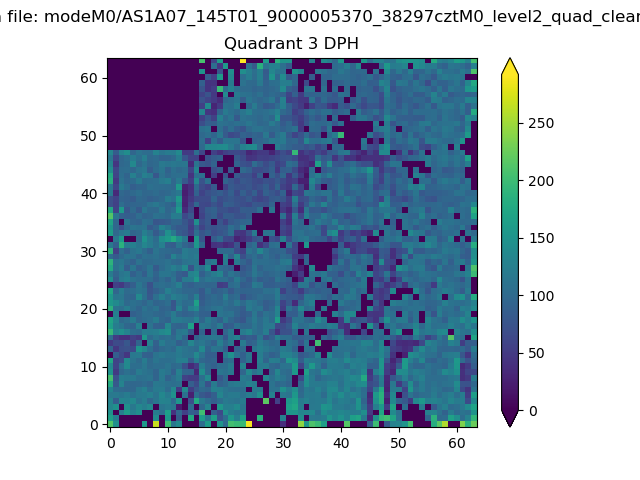 |
 |
Quadrant C |
| Plot type | Count rate plots | Images |
|---|---|---|
| Comparison with Poisson distribution Blue bars denote a histogram of data divided into 1 sec bins. Red curve is a Poisson curve with rate = median count rate of data. |
 |
 |
| Quadrant-wise count rates Data is divided into 100 sec bins |
 |
|
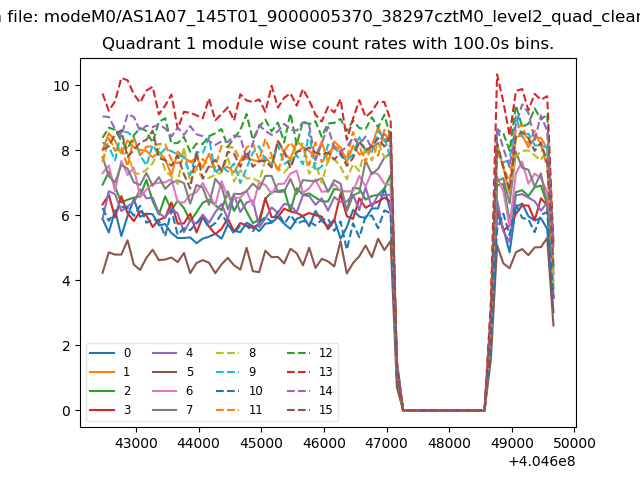
| Module-wise count rates for Quadrant A Data is divided into 100 sec bins |
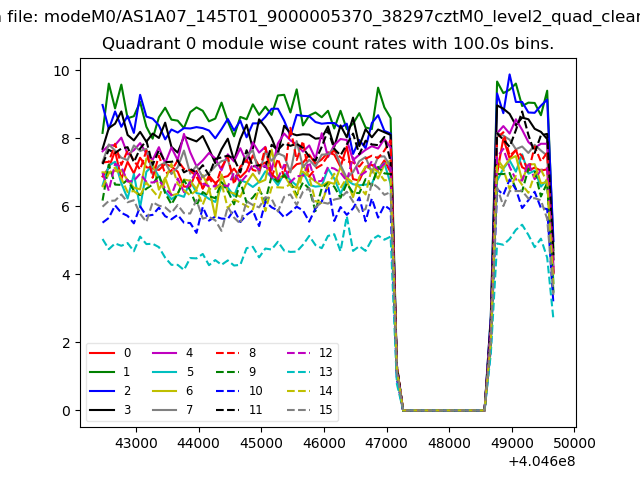 |
 |
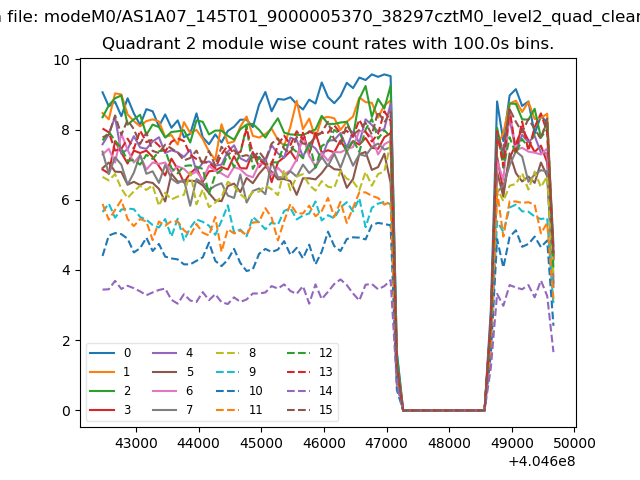
| Module-wise count rates for Quadrant B Data is divided into 100 sec bins |
 |
 |
| Module-wise count rates for Quadrant C Data is divided into 100 sec bins |
 |
 |
| Module-wise count rates for Quadrant D Data is divided into 100 sec bins |
 |
 |
| Parameter | Plot |
|---|---|
| CZT HV Monitor |  |
| D_VDD | 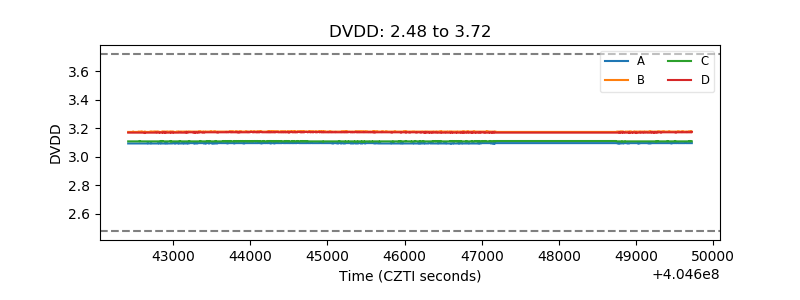 |
| Temperature 1 | 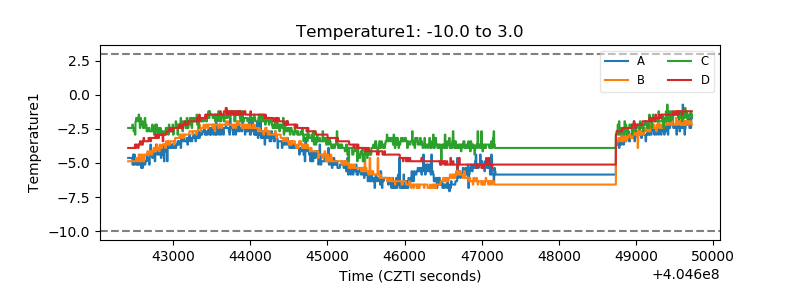 |
| Veto HV Monitor | 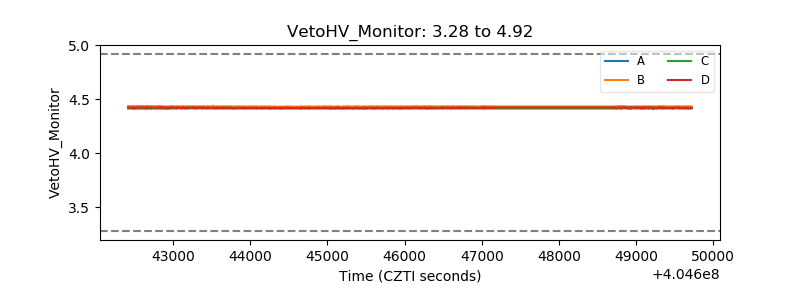 |
| Veto LLD | 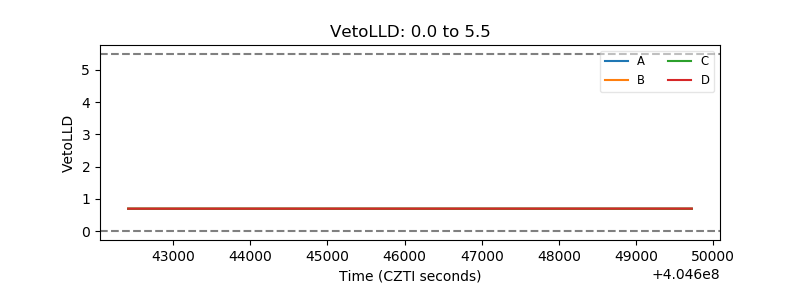 |
| Alpha Counter | 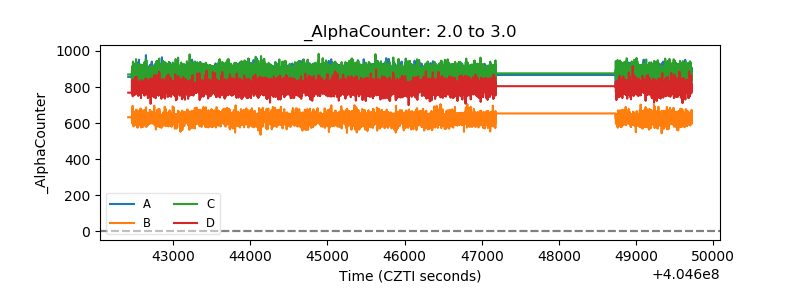 |
| _CPM_Rate | 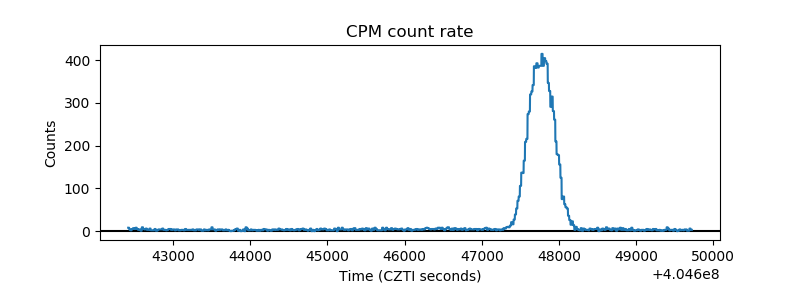 |
| CZT Counter | 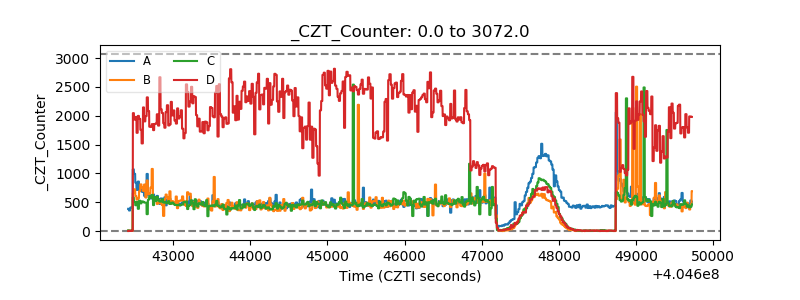 |
| +2.5 Volts monitor | 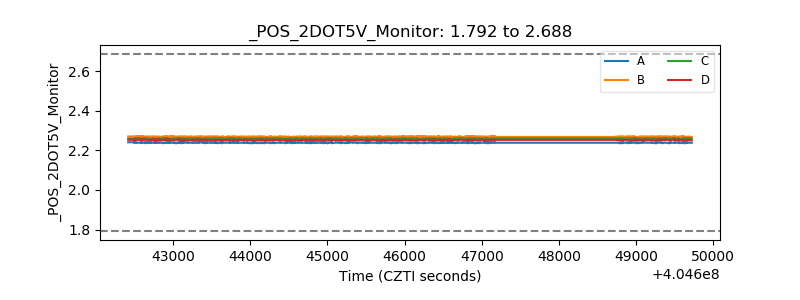 |
| +5 Volts monitor | 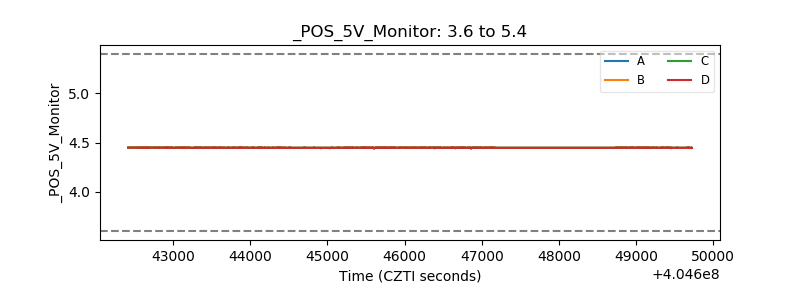 |
| _ROLL_ROT | 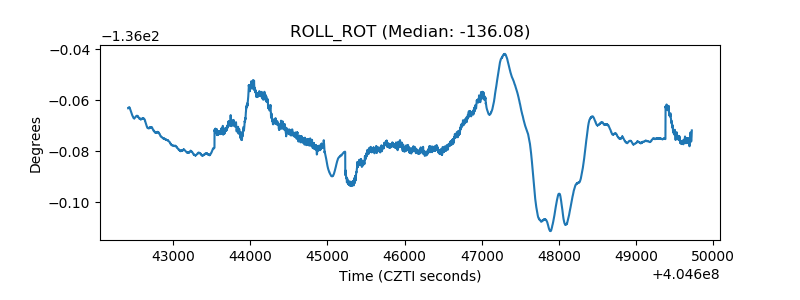 |
| _Roll_DEC | 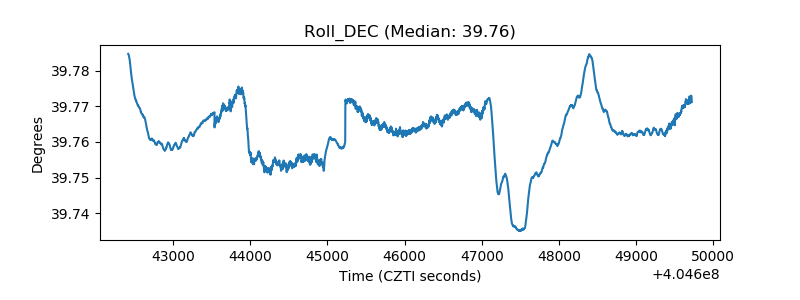 |
| _Roll_RA | 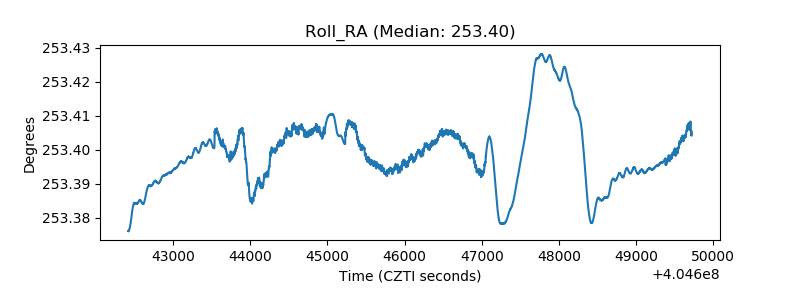 |
| Veto Counter |  |