| Param | Original file | Final file |
|---|---|---|
| Filename | modeM0/AS1A07_145T01_9000005370_38298cztM0_level2.fits | modeM0/AS1A07_145T01_9000005370_38298cztM0_level2_quad_clean.evt |
| Size (bytes) | 575,452,800 | 76,677,120 |
| Size | 548.8 MB | 73.1 MB |
| Events in quadrant A | 2,713,957 | 613,987 |
| Events in quadrant B | 2,810,953 | 623,674 |
| Events in quadrant C | 2,833,259 | 586,621 |
| Events in quadrant D | 12,527,982 | 123,918 |
| Mode M9 | |||
|---|---|---|---|
| Quadrant | BADHDUFLAG | Total packets | Discarded packets |
| A | 0 | 17 | 0 |
| B | 0 | 17 | 0 |
| C | 0 | 17 | 0 |
| D | 0 | 17 | 0 |
| Mode SS | |||
|---|---|---|---|
| Quadrant | BADHDUFLAG | Total packets | Discarded packets |
| A | 0 | 108 | 0 |
| B | 0 | 108 | 0 |
| C | 0 | 108 | 0 |
| D | 0 | 108 | 0 |
| Mode M0 | |||
|---|---|---|---|
| Quadrant | BADHDUFLAG | Total packets | Discarded packets |
| A | 0 | 11372 | 2 |
| B | 0 | 11987 | 1 |
| C | 0 | 11670 | 1 |
| D | 0 | 40832 | 1 |
| Quadrant | Total seconds | Saturated seconds | Saturation percentage |
|---|---|---|---|
| A | 5335 | 16 | 0.299906% |
| B | 5335 | 68 | 1.274602% |
| C | 5335 | 62 | 1.162137% |
| D | 5335 | 4260 | 79.850047% |
Noise dominated data is calculated using 1-second bins in cleaned event files. If a bin has >2000 counts, and if more than 50% of those come from <1% of pixels, then it is considered to be noise-dominated and hence unusable.
| Quadrant | # 1 sec bins | Bins with >0 counts | Bins with >2000 counts | High rate bins dominated by noise | Noise dominated (total time) | Noise dominated (detector-on time) | Marked lightcurve |
|---|---|---|---|---|---|---|---|
| A | 7036 | 5336 | 2 | 2 | 0.03% | 0.04% | 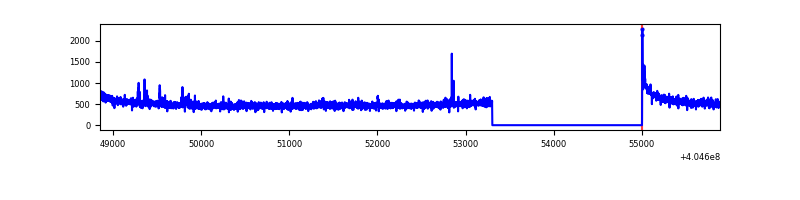 |
| B | 7036 | 5336 | 36 | 36 | 0.51% | 0.67% | 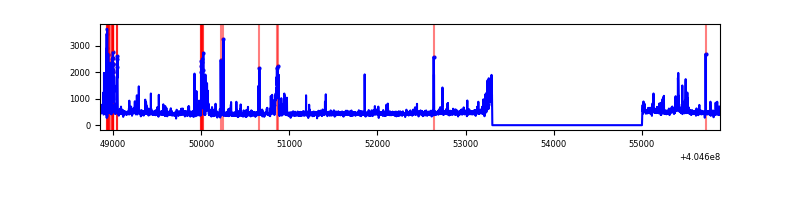 |
| C | 7036 | 5336 | 49 | 49 | 0.70% | 0.92% | 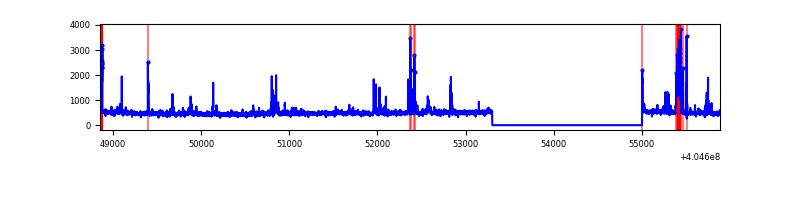 |
| D | 7036 | 5336 | 4276 | 4276 | 60.77% | 80.13% | 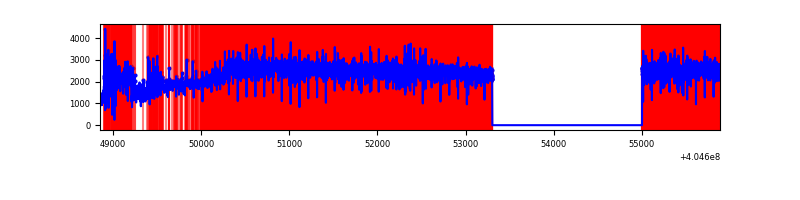 |
Top three noisy pixels from each quadrant. If the there are fewer than three noisy pixels in the level2.evt file, extra rows are filled as -1
| Pixel properties | Quadrant properties | ||||||
|---|---|---|---|---|---|---|---|
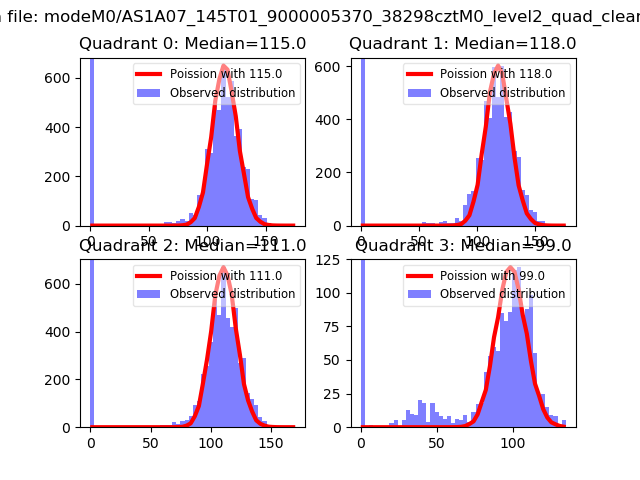
| Quadrant | DetID | PixID | Counts | Sigma | Mean | Median | Sigma |
| A | 10 | 83 | 357814 | 2962.93 | 593 | 582 | 120.6 |
| A | 12 | 189 | 46886 | 384.05 | 593 | 582 | 120.6 |
| A | 13 | 6 | 9229 | 71.72 | 593 | 582 | 120.6 |
| B | 5 | 184 | 298657 | 2648.48 | 589 | 574 | 112.5 |
| B | 5 | 172 | 44898 | 393.82 | 589 | 574 | 112.5 |
| B | 0 | 189 | 28107 | 244.63 | 589 | 574 | 112.5 |
| C | 15 | 214 | 223184 | 1654.61 | 577 | 580 | 134.5 |
| C | 2 | 16 | 209613 | 1553.74 | 577 | 580 | 134.5 |
| C | 14 | 254 | 116218 | 859.54 | 577 | 580 | 134.5 |
| D | 10 | 203 | 9501507 | 96822.37 | 407 | 395 | 98.1 |
| D | 2 | 16 | 864911 | 8809.97 | 407 | 395 | 98.1 |
| D | 13 | 138 | 220872 | 2246.8 | 407 | 395 | 98.1 |
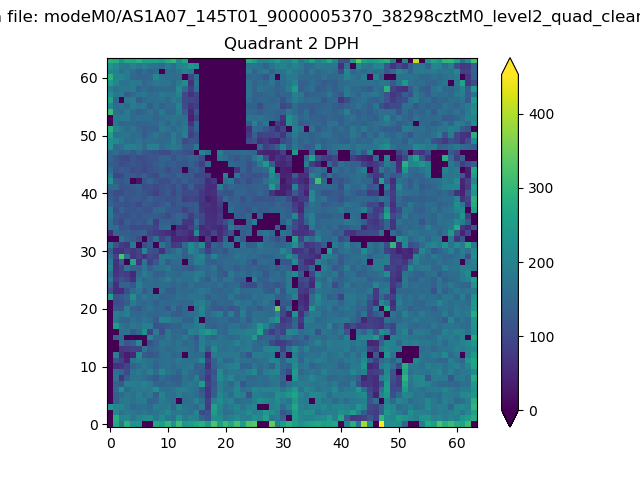
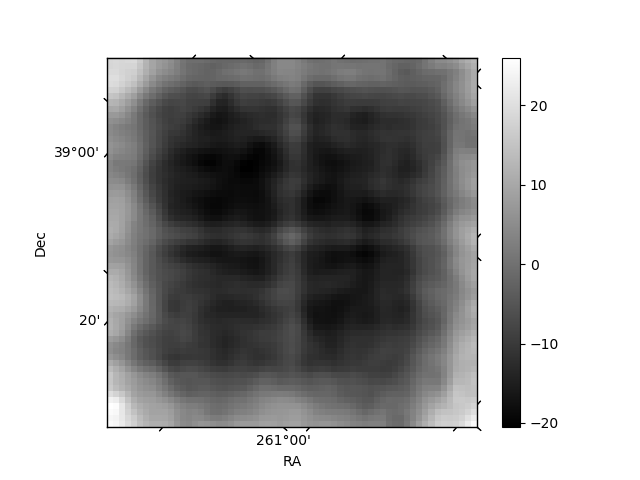
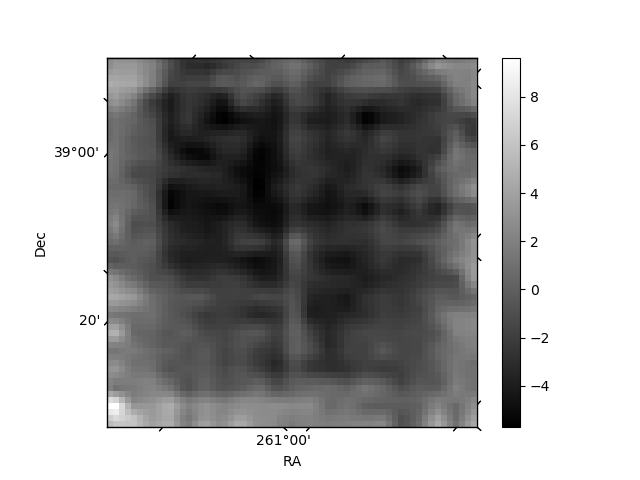
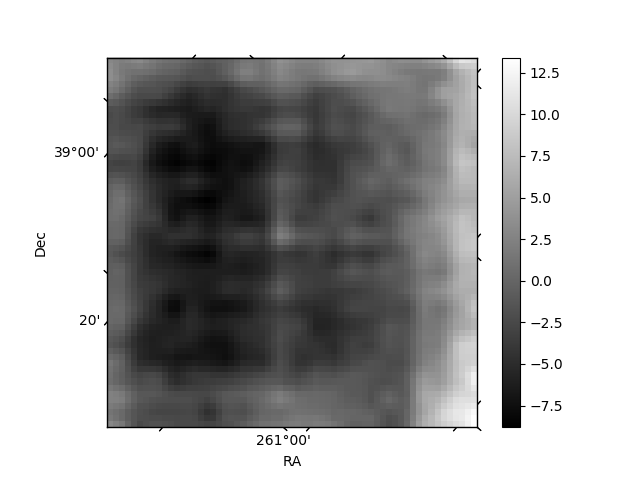
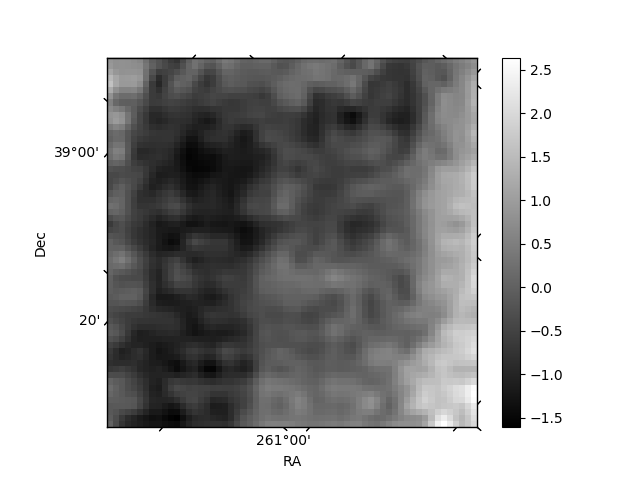
Histogram calculated using DETX and DETY for each event in the final _common_clean file
| Quadrant A | 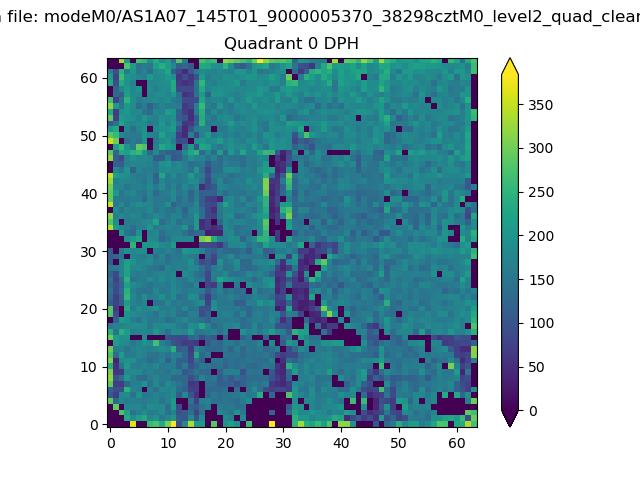 |
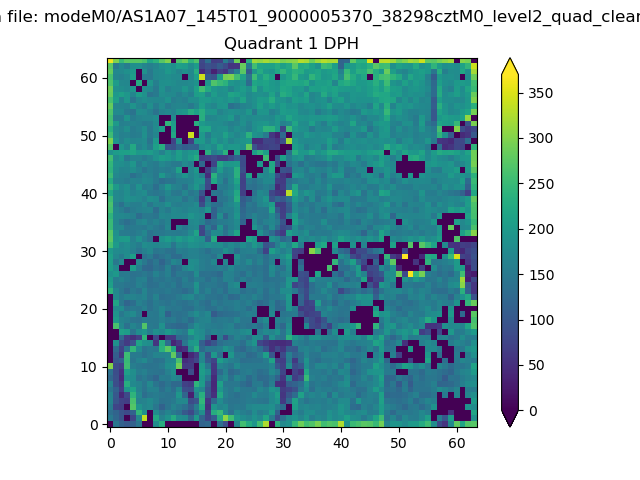 |
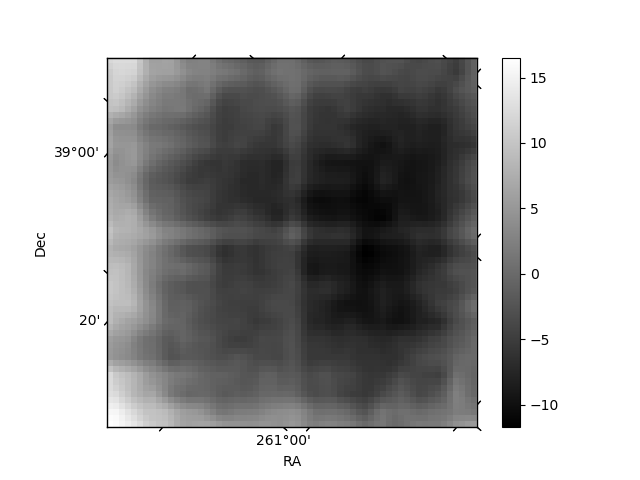
Quadrant B |
|---|---|---|---|
| Quadrant D | 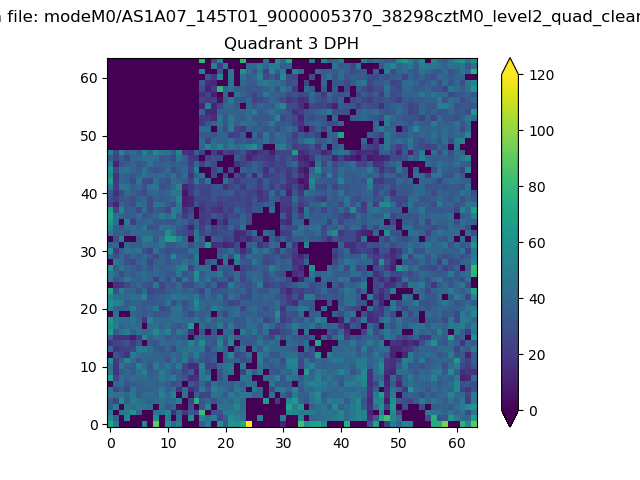 |
 |
Quadrant C |
| Plot type | Count rate plots | Images |
|---|---|---|
| Comparison with Poisson distribution Blue bars denote a histogram of data divided into 1 sec bins. Red curve is a Poisson curve with rate = median count rate of data. |
 |
 |
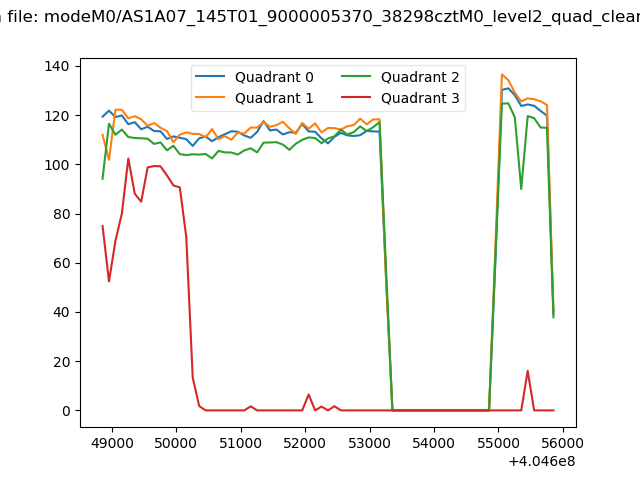
| Quadrant-wise count rates Data is divided into 100 sec bins |
 |
|
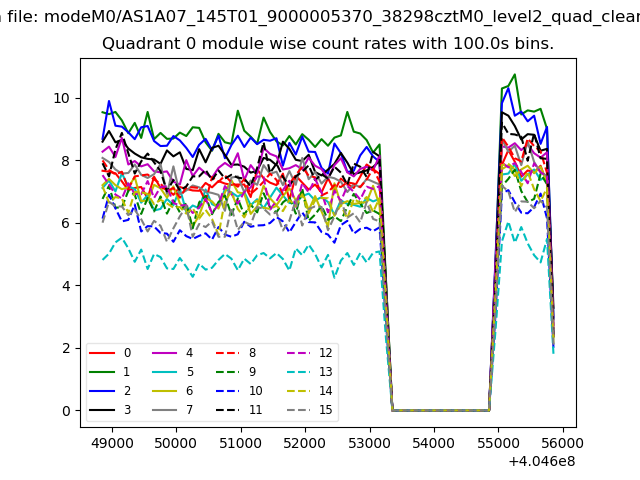
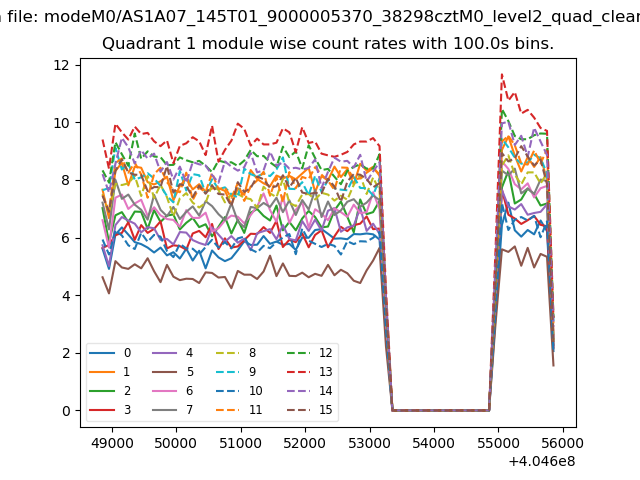
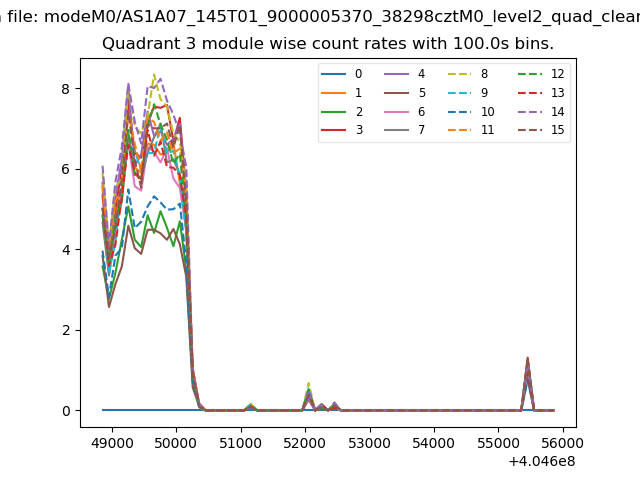
| Module-wise count rates for Quadrant A Data is divided into 100 sec bins |
 |
 |
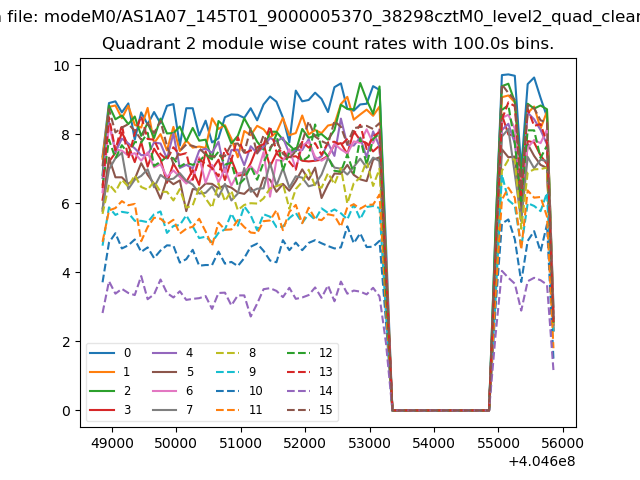
| Module-wise count rates for Quadrant B Data is divided into 100 sec bins |
 |
 |
| Module-wise count rates for Quadrant C Data is divided into 100 sec bins |
 |
 |
| Module-wise count rates for Quadrant D Data is divided into 100 sec bins |
 |
 |
| Parameter | Plot |
|---|---|
| CZT HV Monitor | 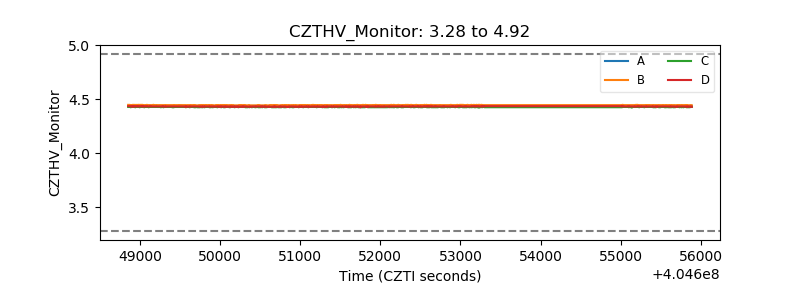 |
| D_VDD | 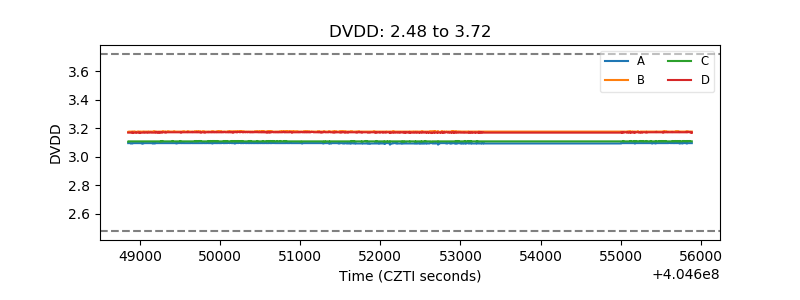 |
| Temperature 1 | 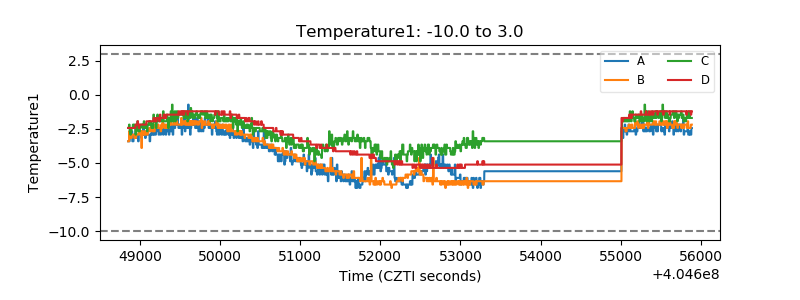 |
| Veto HV Monitor | 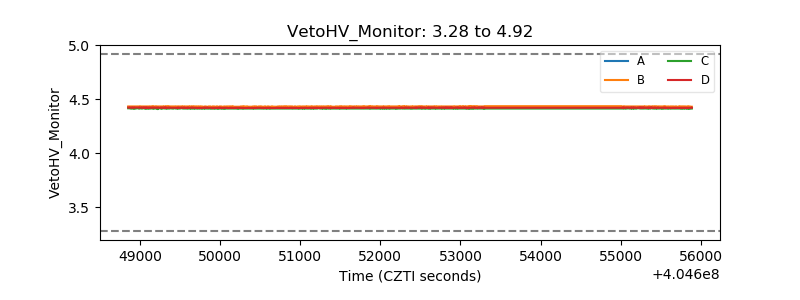 |
| Veto LLD | 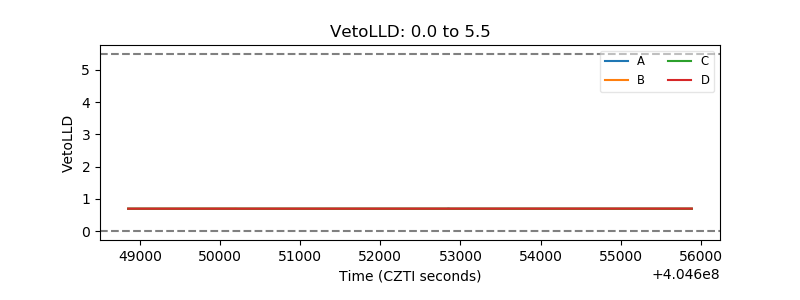 |
| Alpha Counter | 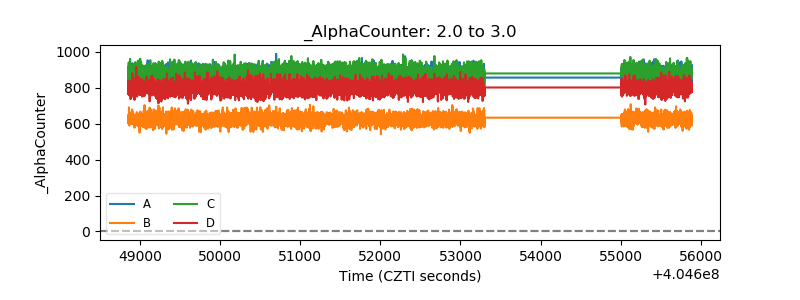 |
| _CPM_Rate | 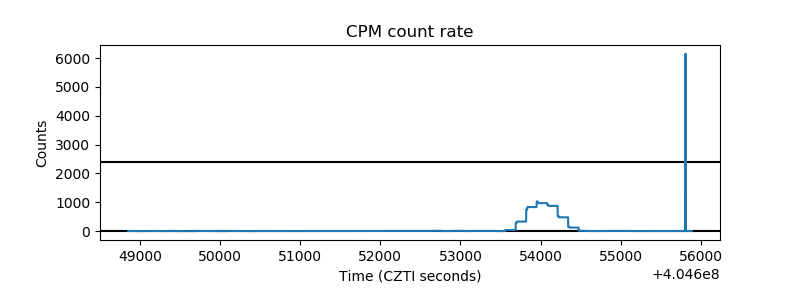 |
| CZT Counter | 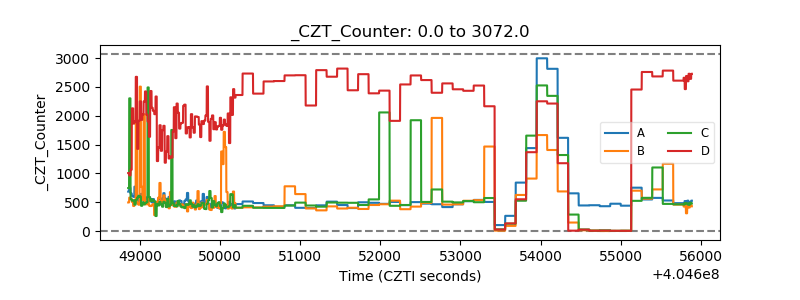 |
| +2.5 Volts monitor | 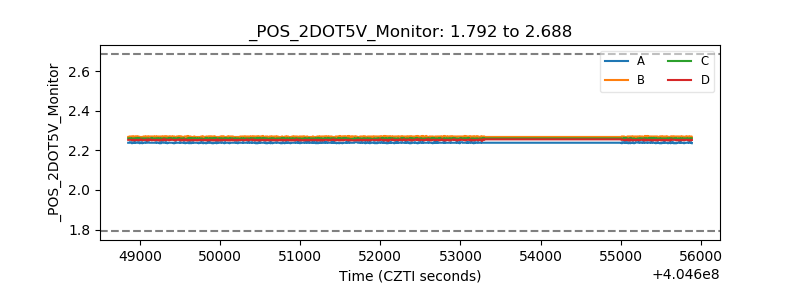 |
| +5 Volts monitor | 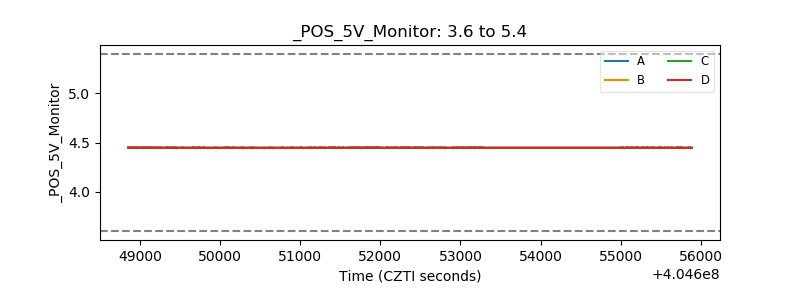 |
| _ROLL_ROT | 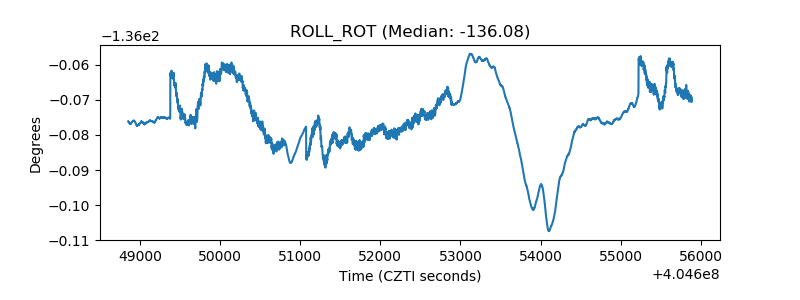 |
| _Roll_DEC | 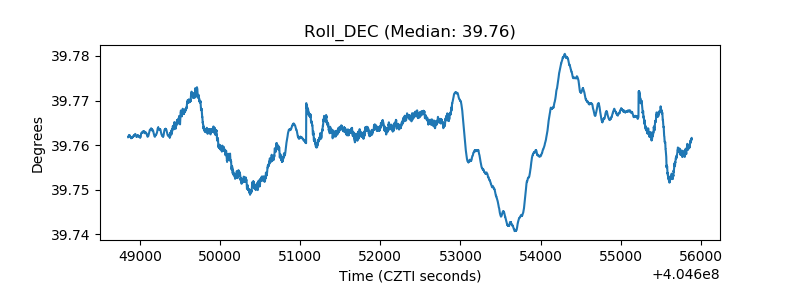 |
| _Roll_RA | 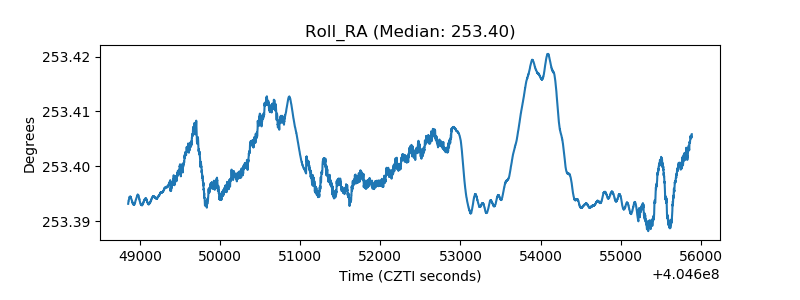 |
| Veto Counter | 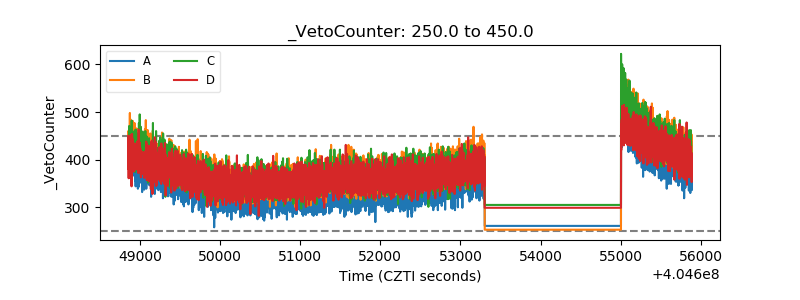 |