| Param | Original file | Final file |
|---|---|---|
| Filename | modeM0/AS1A07_145T01_9000005370_38300cztM0_level2.fits | modeM0/AS1A07_145T01_9000005370_38300cztM0_level2_quad_clean.evt |
| Size (bytes) | 545,558,400 | 77,575,680 |
| Size | 520.3 MB | 74.0 MB |
| Events in quadrant A | 2,632,608 | 607,034 |
| Events in quadrant B | 2,586,261 | 619,867 |
| Events in quadrant C | 2,714,626 | 581,639 |
| Events in quadrant D | 11,865,278 | 183,556 |
| Mode M9 | |||
|---|---|---|---|
| Quadrant | BADHDUFLAG | Total packets | Discarded packets |
| A | 0 | 18 | 0 |
| B | 0 | 18 | 0 |
| C | 0 | 18 | 0 |
| D | 0 | 18 | 0 |
| Mode SS | |||
|---|---|---|---|
| Quadrant | BADHDUFLAG | Total packets | Discarded packets |
| A | 0 | 104 | 0 |
| B | 0 | 104 | 0 |
| C | 0 | 104 | 0 |
| D | 0 | 104 | 0 |
| Mode M0 | |||
|---|---|---|---|
| Quadrant | BADHDUFLAG | Total packets | Discarded packets |
| A | 0 | 10879 | 2 |
| B | 0 | 10991 | 1 |
| C | 0 | 11129 | 1 |
| D | 0 | 38695 | 1 |
| Quadrant | Total seconds | Saturated seconds | Saturation percentage |
|---|---|---|---|
| A | 5089 | 7 | 0.137552% |
| B | 5089 | 29 | 0.569857% |
| C | 5089 | 62 | 1.218314% |
| D | 5089 | 3720 | 73.098841% |
Noise dominated data is calculated using 1-second bins in cleaned event files. If a bin has >2000 counts, and if more than 50% of those come from <1% of pixels, then it is considered to be noise-dominated and hence unusable.
| Quadrant | # 1 sec bins | Bins with >0 counts | Bins with >2000 counts | High rate bins dominated by noise | Noise dominated (total time) | Noise dominated (detector-on time) | Marked lightcurve |
|---|---|---|---|---|---|---|---|
| A | 6911 | 5090 | 3 | 3 | 0.04% | 0.06% | 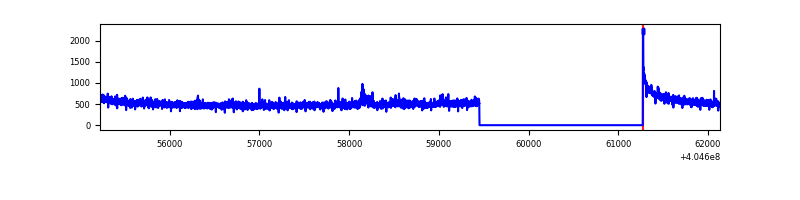 |
| B | 6911 | 5090 | 16 | 16 | 0.23% | 0.31% | 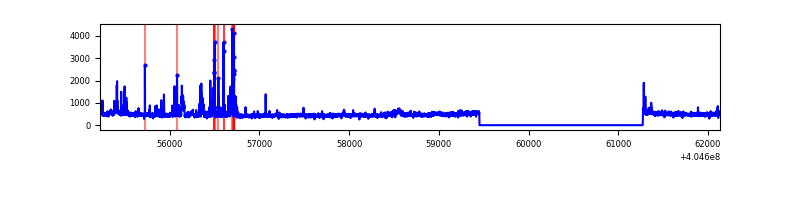 |
| C | 6911 | 5090 | 50 | 50 | 0.72% | 0.98% | 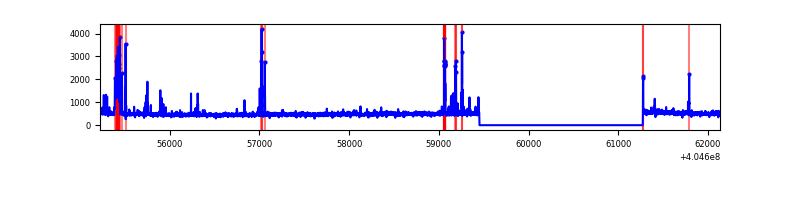 |
| D | 6911 | 5090 | 3994 | 3994 | 57.79% | 78.47% | 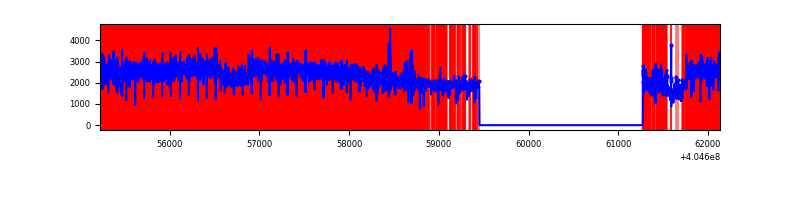 |
Top three noisy pixels from each quadrant. If the there are fewer than three noisy pixels in the level2.evt file, extra rows are filled as -1
| Pixel properties | Quadrant properties | ||||||
|---|---|---|---|---|---|---|---|
| Quadrant | DetID | PixID | Counts | Sigma | Mean | Median | Sigma |
| A | 10 | 83 | 331224 | 2849.98 | 576 | 565 | 116.0 |
| A | 12 | 189 | 61222 | 522.81 | 576 | 565 | 116.0 |
| A | 13 | 6 | 8685 | 69.99 | 576 | 565 | 116.0 |
| B | 5 | 172 | 170438 | 1548.06 | 574 | 560 | 109.7 |
| B | 0 | 183 | 34538 | 309.63 | 574 | 560 | 109.7 |
| B | 15 | 85 | 34083 | 305.49 | 574 | 560 | 109.7 |
| C | 15 | 214 | 209687 | 1607.93 | 563 | 567 | 130.1 |
| C | 2 | 16 | 201661 | 1546.22 | 563 | 567 | 130.1 |
| C | 14 | 254 | 77631 | 592.55 | 563 | 567 | 130.1 |
| D | 10 | 203 | 8528944 | 82246.96 | 419 | 405 | 103.7 |
| D | 2 | 16 | 860682 | 8296.28 | 419 | 405 | 103.7 |
| D | 12 | 235 | 576491 | 5555.62 | 419 | 405 | 103.7 |
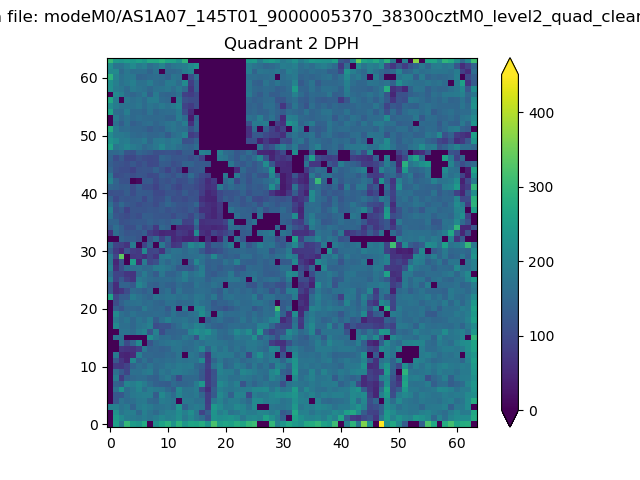
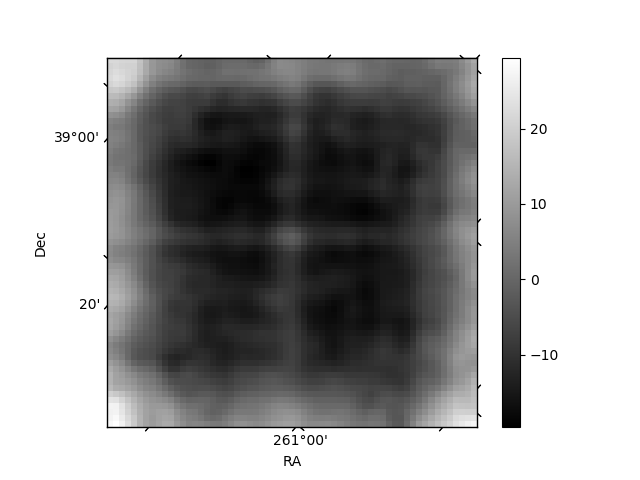
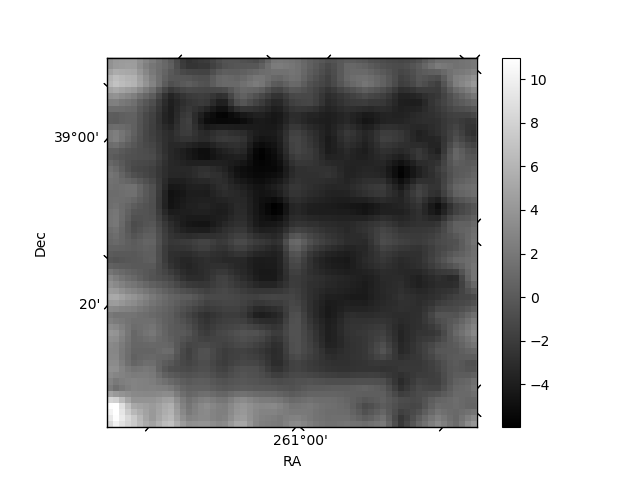
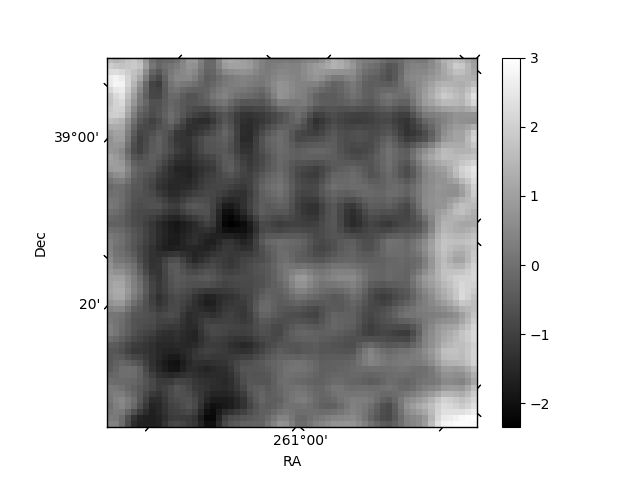
Histogram calculated using DETX and DETY for each event in the final _common_clean file
| Quadrant A | 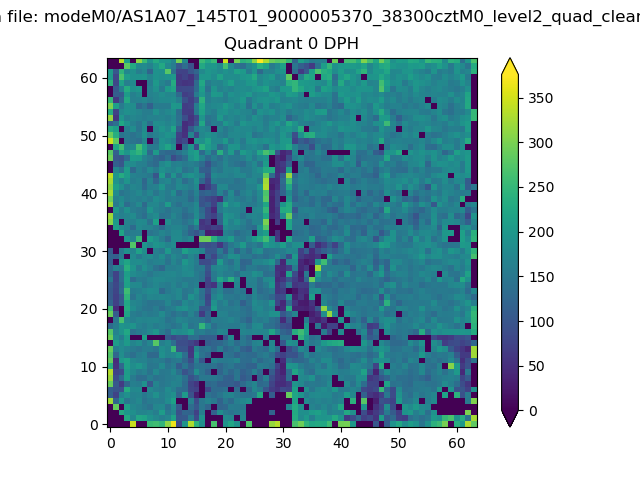 |
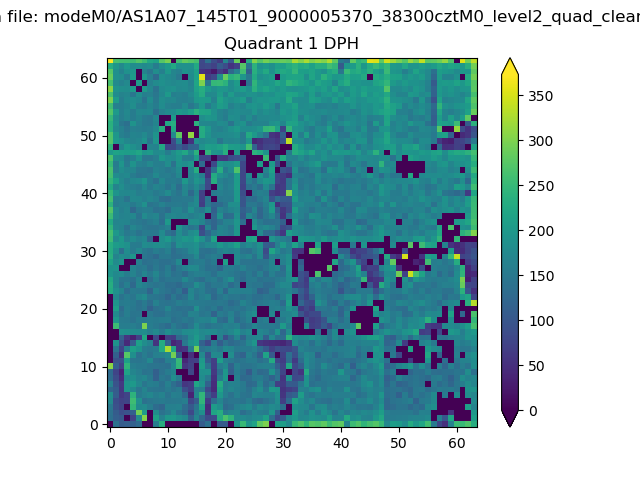 |
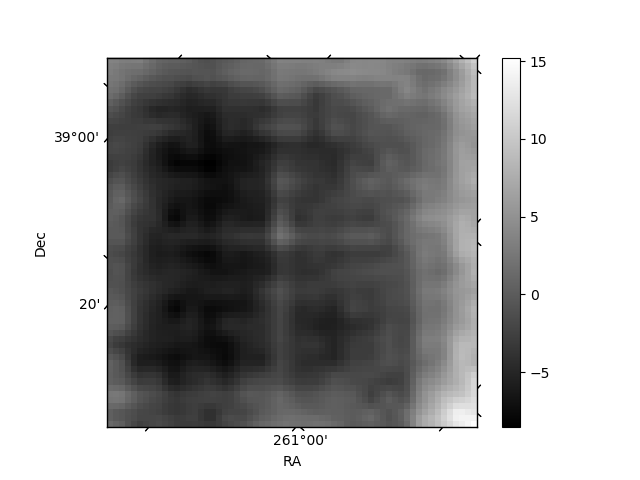
Quadrant B |
|---|---|---|---|
| Quadrant D | 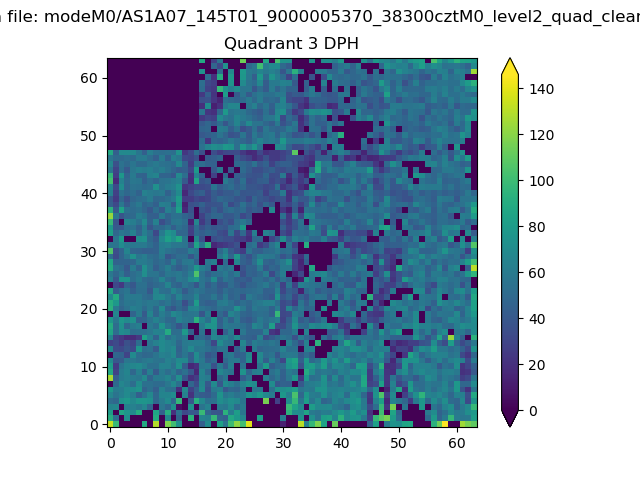 |
 |
Quadrant C |
| Plot type | Count rate plots | Images |
|---|---|---|
| Comparison with Poisson distribution Blue bars denote a histogram of data divided into 1 sec bins. Red curve is a Poisson curve with rate = median count rate of data. |
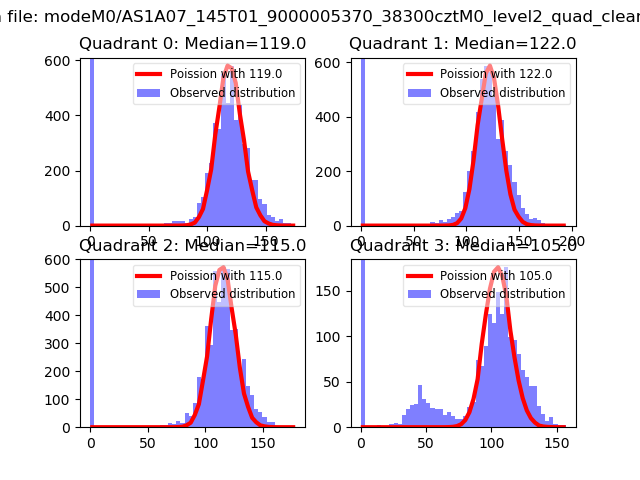 |
 |
| Quadrant-wise count rates Data is divided into 100 sec bins |
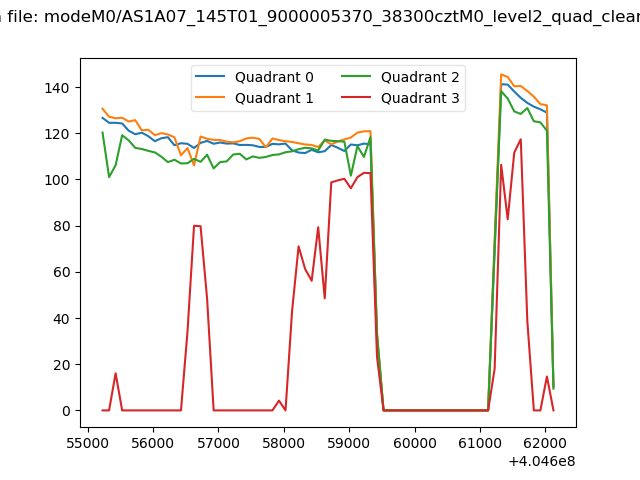 |
|
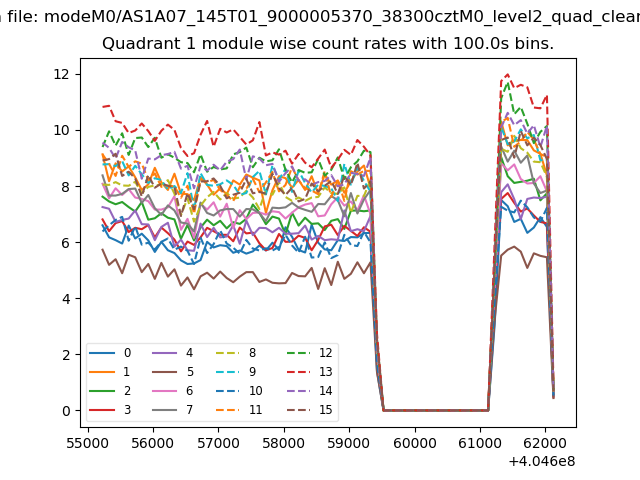
| Module-wise count rates for Quadrant A Data is divided into 100 sec bins |
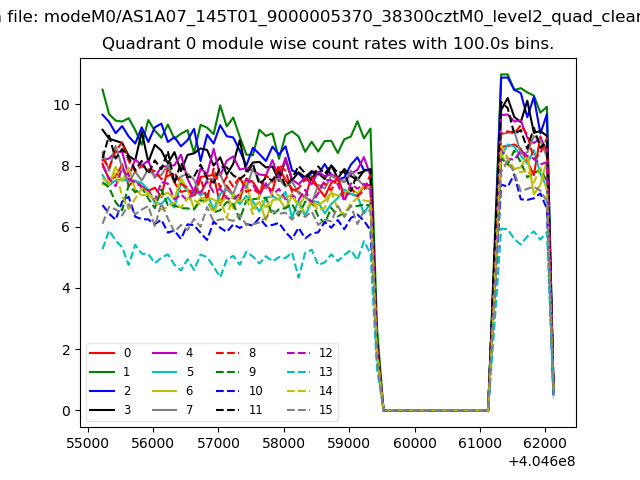 |
 |
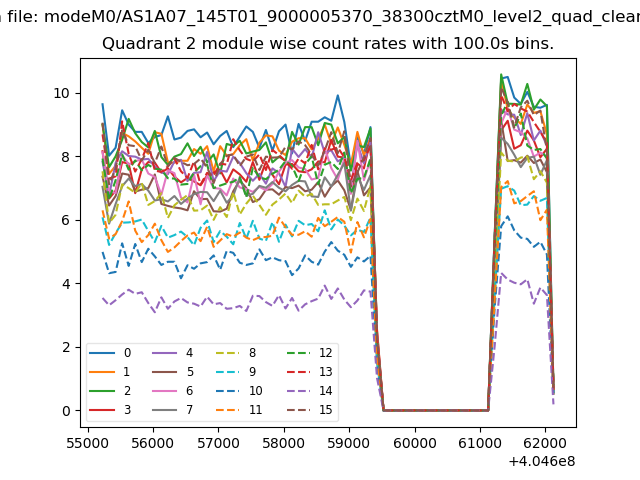
| Module-wise count rates for Quadrant B Data is divided into 100 sec bins |
 |
 |
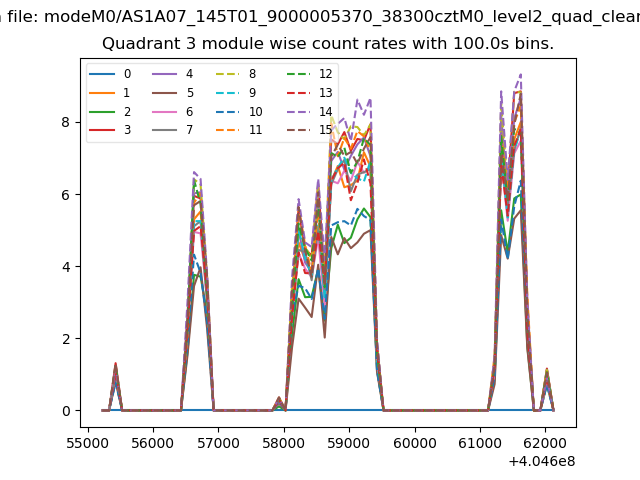
| Module-wise count rates for Quadrant C Data is divided into 100 sec bins |
 |
 |
| Module-wise count rates for Quadrant D Data is divided into 100 sec bins |
 |
 |
| Parameter | Plot |
|---|---|
| CZT HV Monitor | 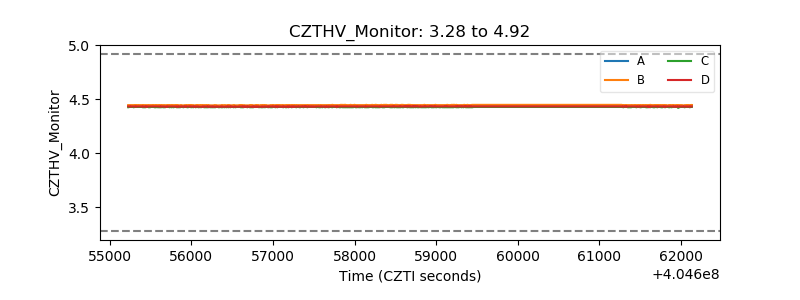 |
| D_VDD | 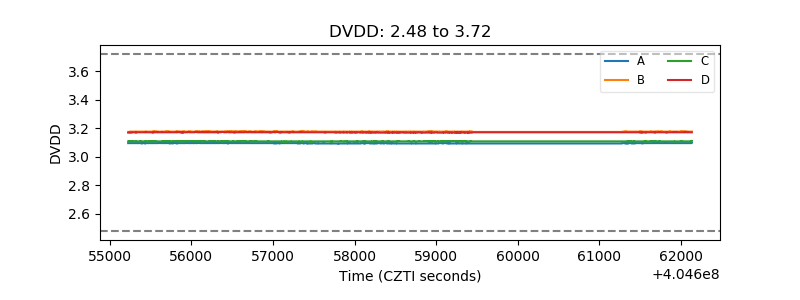 |
| Temperature 1 | 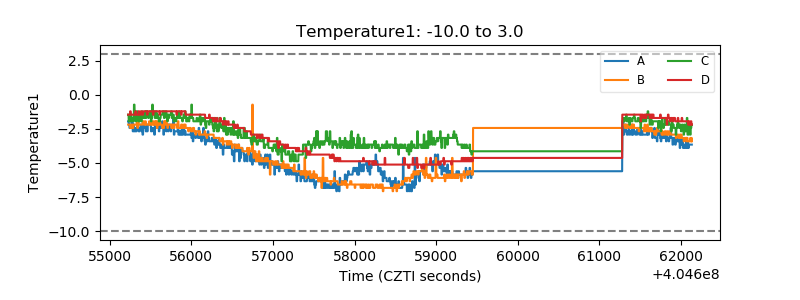 |
| Veto HV Monitor | 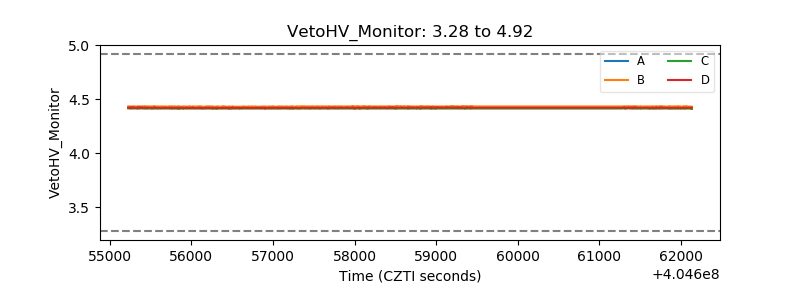 |
| Veto LLD | 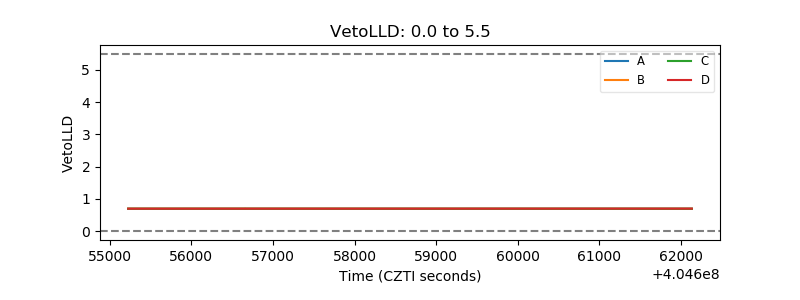 |
| Alpha Counter | 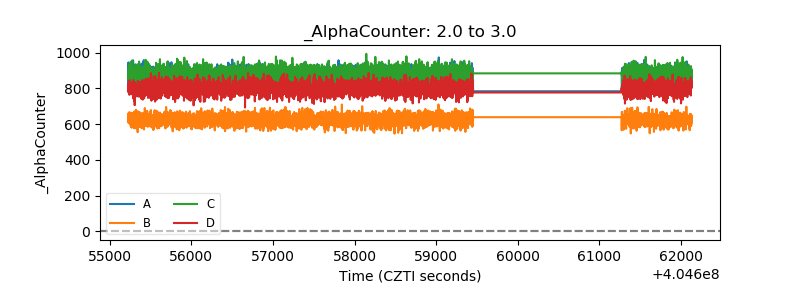 |
| _CPM_Rate | 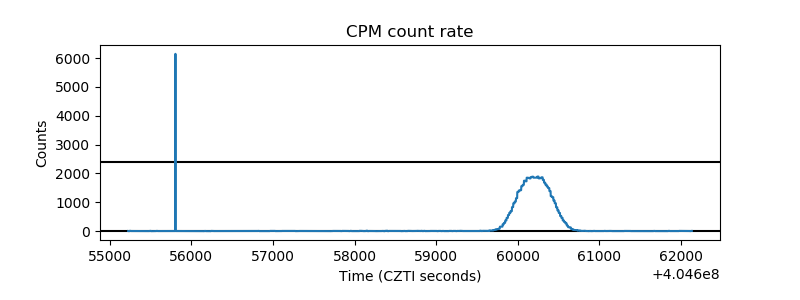 |
| CZT Counter | 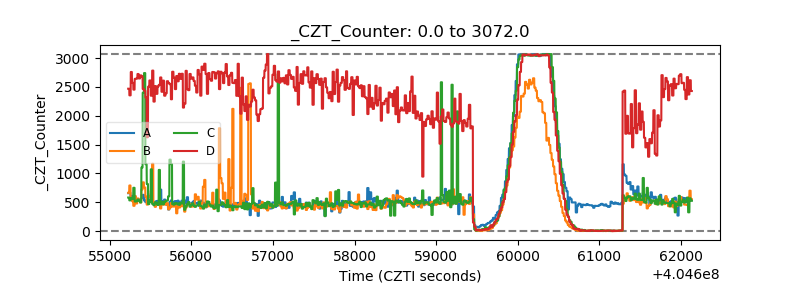 |
| +2.5 Volts monitor | 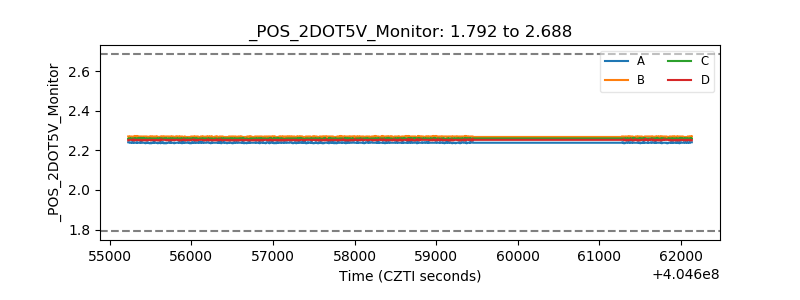 |
| +5 Volts monitor | 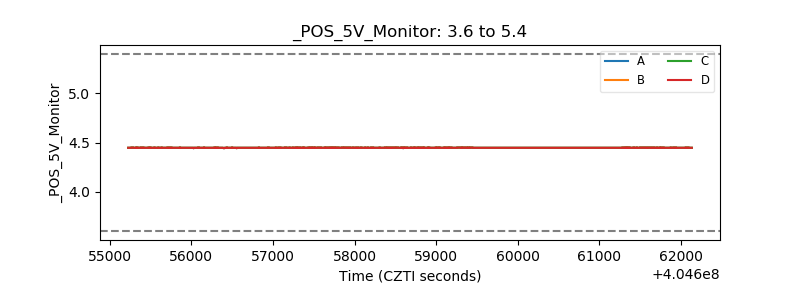 |
| _ROLL_ROT | 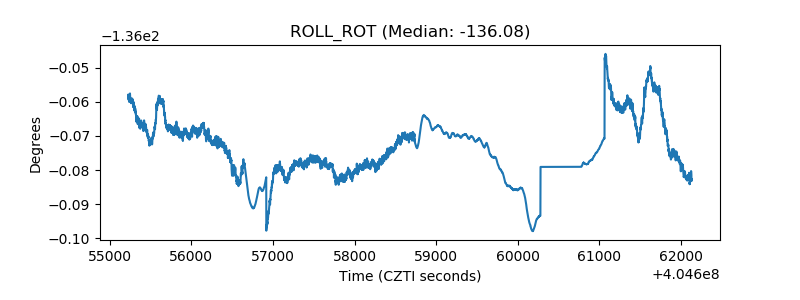 |
| _Roll_DEC | 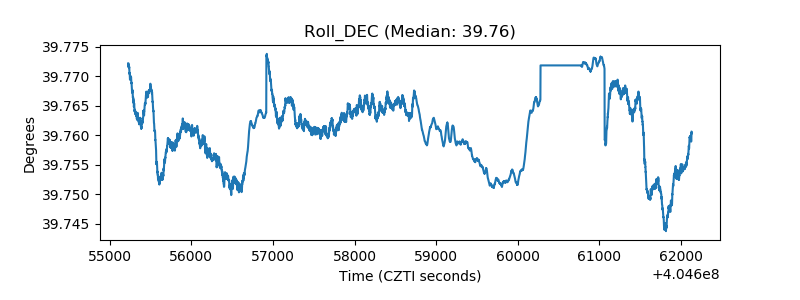 |
| _Roll_RA | 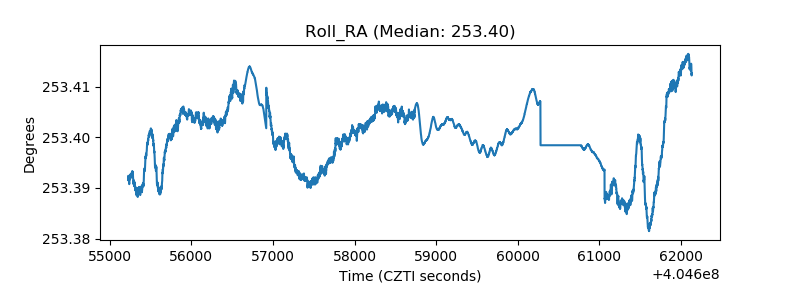 |
| Veto Counter | 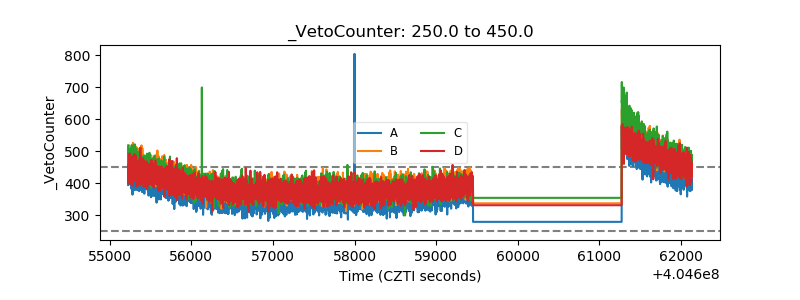 |