| Param | Original file | Final file |
|---|---|---|
| Filename | modeM0/AS1A07_145T01_9000005370_38301cztM0_level2.fits | modeM0/AS1A07_145T01_9000005370_38301cztM0_level2_quad_clean.evt |
| Size (bytes) | 563,100,480 | 87,405,120 |
| Size | 537.0 MB | 83.4 MB |
| Events in quadrant A | 2,849,315 | 664,818 |
| Events in quadrant B | 3,071,297 | 667,786 |
| Events in quadrant C | 3,165,185 | 644,746 |
| Events in quadrant D | 11,344,671 | 296,534 |
| Mode M9 | |||
|---|---|---|---|
| Quadrant | BADHDUFLAG | Total packets | Discarded packets |
| A | 0 | 24 | 0 |
| B | 0 | 24 | 0 |
| C | 0 | 24 | 0 |
| D | 0 | 25 | 0 |
| Mode SS | |||
|---|---|---|---|
| Quadrant | BADHDUFLAG | Total packets | Discarded packets |
| A | 0 | 108 | 0 |
| B | 0 | 108 | 0 |
| C | 0 | 108 | 0 |
| D | 0 | 108 | 0 |
| Mode M0 | |||
|---|---|---|---|
| Quadrant | BADHDUFLAG | Total packets | Discarded packets |
| A | 0 | 11655 | 3 |
| B | 0 | 12456 | 2 |
| C | 0 | 12572 | 2 |
| D | 0 | 37400 | 2 |
| Quadrant | Total seconds | Saturated seconds | Saturation percentage |
|---|---|---|---|
| A | 5325 | 14 | 0.262911% |
| B | 5325 | 157 | 2.948357% |
| C | 5325 | 81 | 1.521127% |
| D | 5325 | 3092 | 58.065728% |
Noise dominated data is calculated using 1-second bins in cleaned event files. If a bin has >2000 counts, and if more than 50% of those come from <1% of pixels, then it is considered to be noise-dominated and hence unusable.
| Quadrant | # 1 sec bins | Bins with >0 counts | Bins with >2000 counts | High rate bins dominated by noise | Noise dominated (total time) | Noise dominated (detector-on time) | Marked lightcurve |
|---|---|---|---|---|---|---|---|
| A | 7268 | 5326 | 8 | 8 | 0.11% | 0.15% | 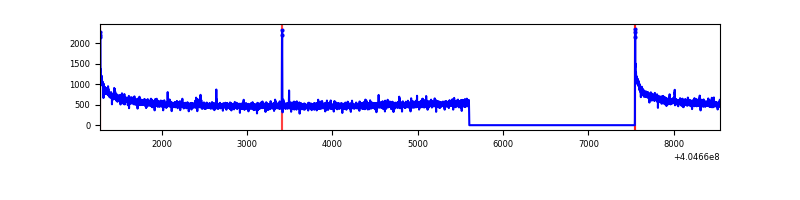 |
| B | 7268 | 5326 | 100 | 100 | 1.38% | 1.88% | 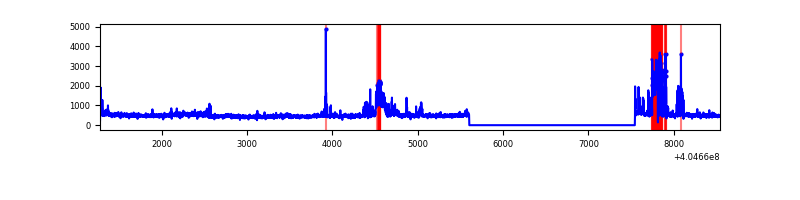 |
| C | 7268 | 5326 | 80 | 80 | 1.10% | 1.50% | 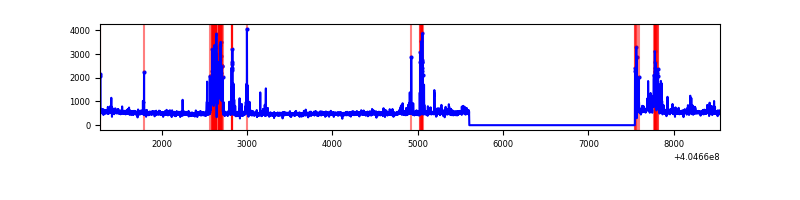 |
| D | 7268 | 5326 | 3535 | 3535 | 48.64% | 66.37% | 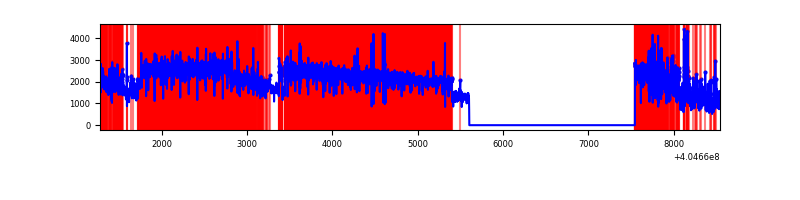 |
Top three noisy pixels from each quadrant. If the there are fewer than three noisy pixels in the level2.evt file, extra rows are filled as -1
| Pixel properties | Quadrant properties | ||||||
|---|---|---|---|---|---|---|---|
| Quadrant | DetID | PixID | Counts | Sigma | Mean | Median | Sigma |
| A | 10 | 83 | 397086 | 3162.65 | 621 | 610 | 125.4 |
| A | 12 | 189 | 25565 | 199.06 | 621 | 610 | 125.4 |
| A | 7 | 3 | 9206 | 68.57 | 621 | 610 | 125.4 |
| B | 5 | 172 | 303656 | 2594.68 | 612 | 597 | 116.8 |
| B | 5 | 184 | 213208 | 1820.29 | 612 | 597 | 116.8 |
| B | 0 | 183 | 66123 | 561.01 | 612 | 597 | 116.8 |
| C | 14 | 254 | 325110 | 2272.07 | 614 | 619 | 142.8 |
| C | 15 | 214 | 223146 | 1558.12 | 614 | 619 | 142.8 |
| C | 2 | 16 | 120370 | 838.49 | 614 | 619 | 142.8 |
| D | 10 | 203 | 7182249 | 58083.99 | 511 | 498 | 123.6 |
| D | 2 | 16 | 1128820 | 9125.55 | 511 | 498 | 123.6 |
| D | 12 | 235 | 605621 | 4894.07 | 511 | 498 | 123.6 |
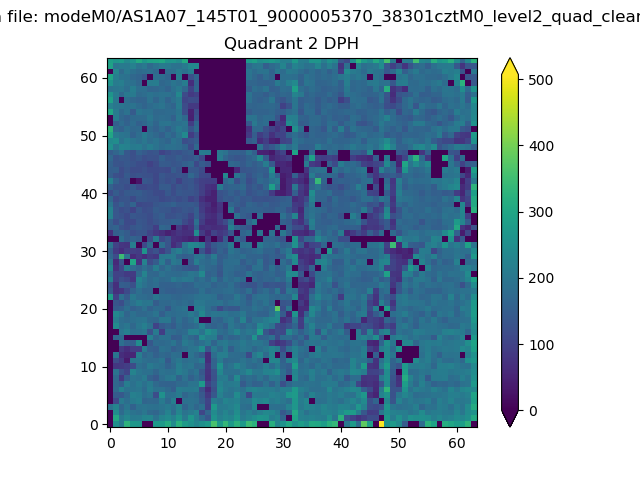
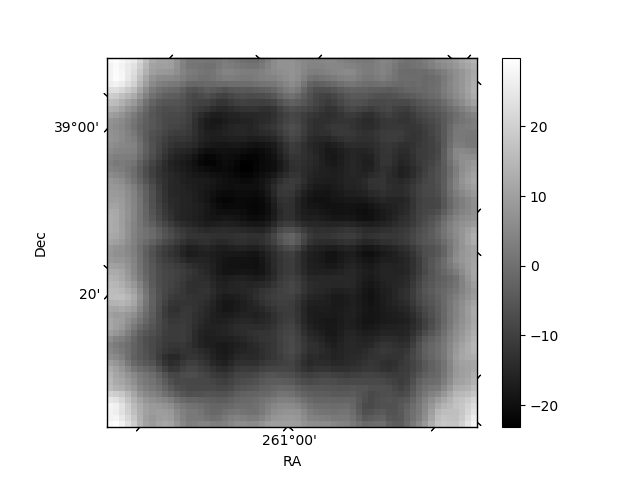
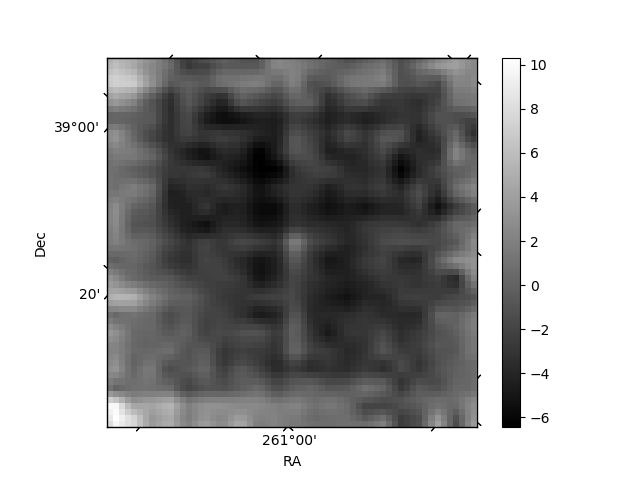
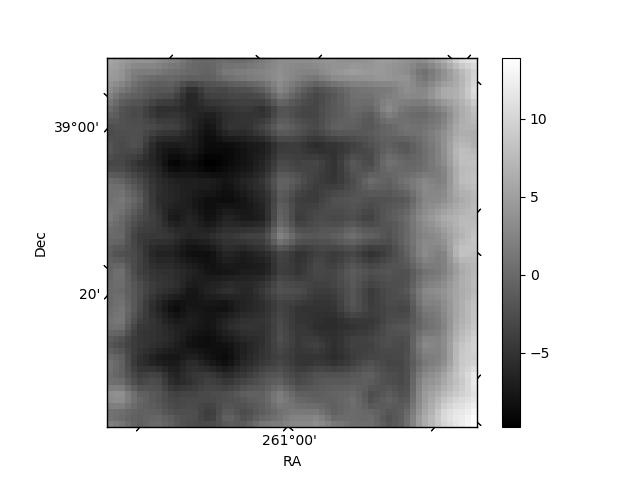
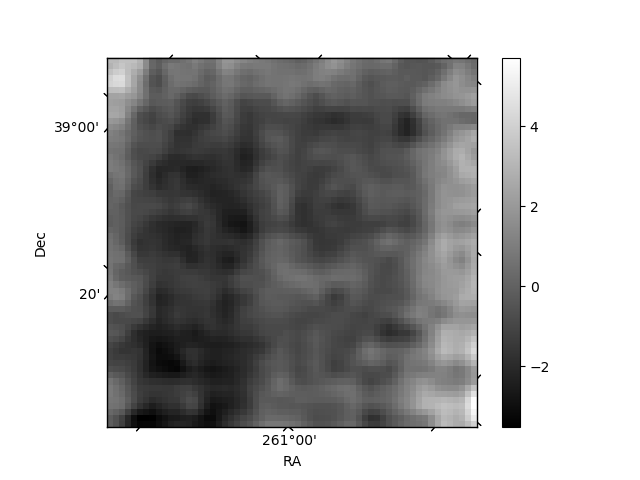
Histogram calculated using DETX and DETY for each event in the final _common_clean file
| Quadrant A | 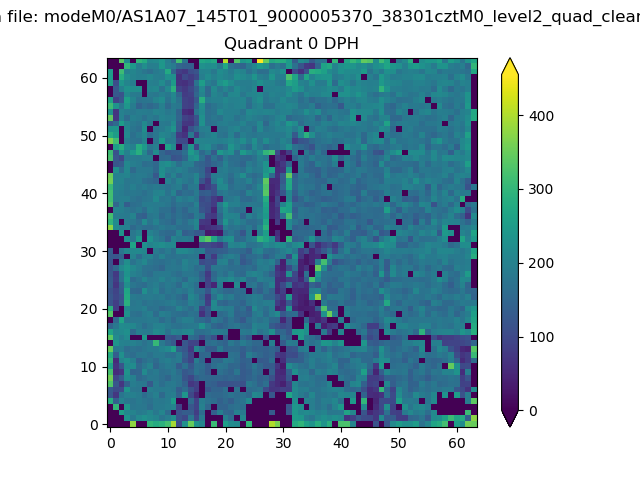 |
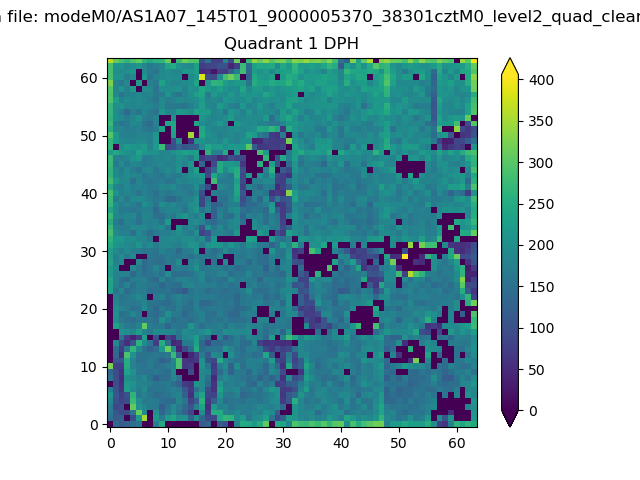 |
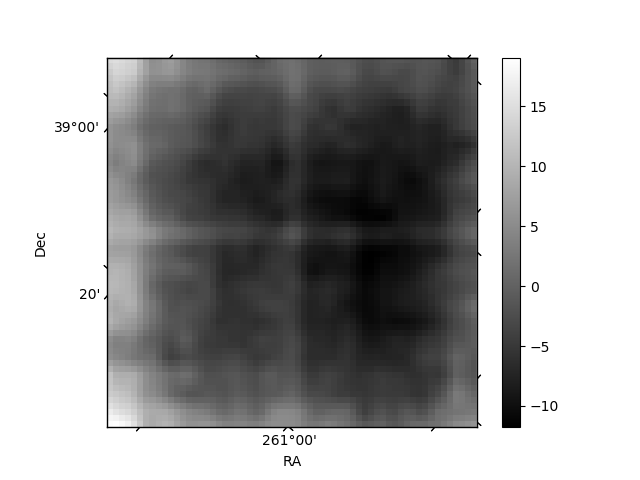
Quadrant B |
|---|---|---|---|
| Quadrant D | 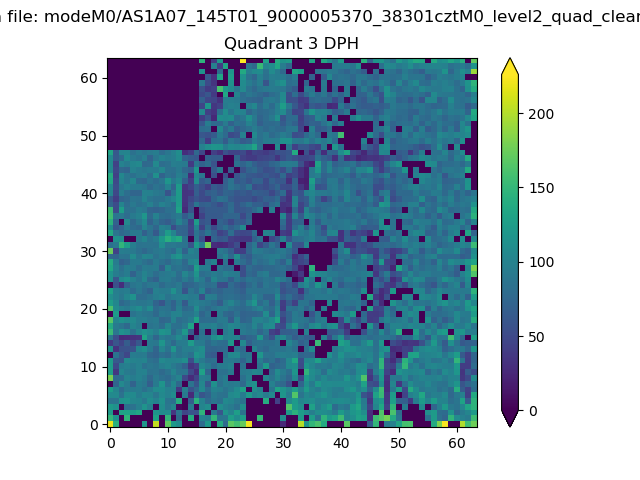 |
 |
Quadrant C |
| Plot type | Count rate plots | Images |
|---|---|---|
| Comparison with Poisson distribution Blue bars denote a histogram of data divided into 1 sec bins. Red curve is a Poisson curve with rate = median count rate of data. |
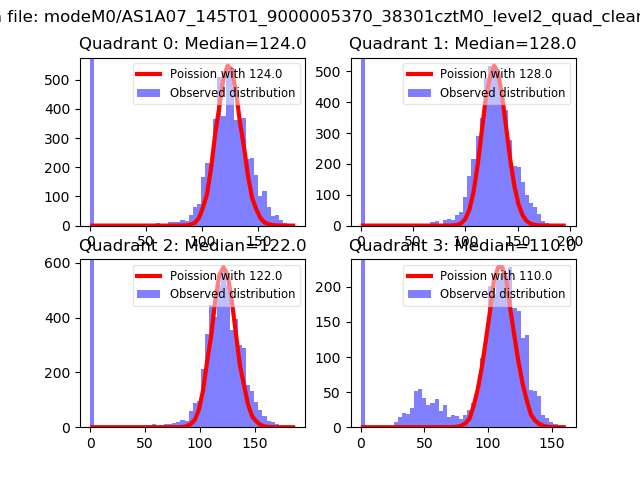 |
 |
| Quadrant-wise count rates Data is divided into 100 sec bins |
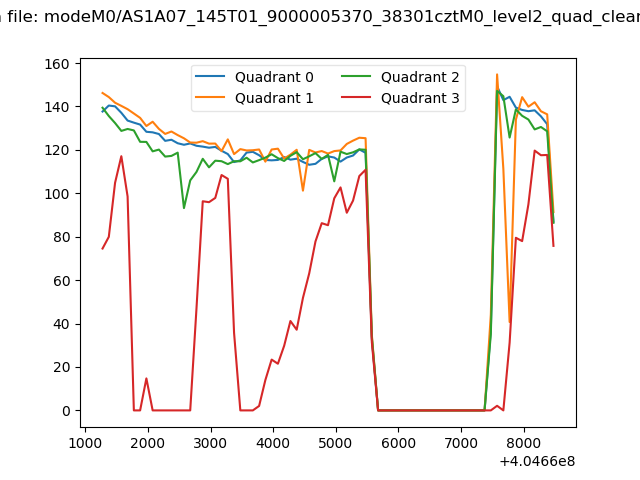 |
|
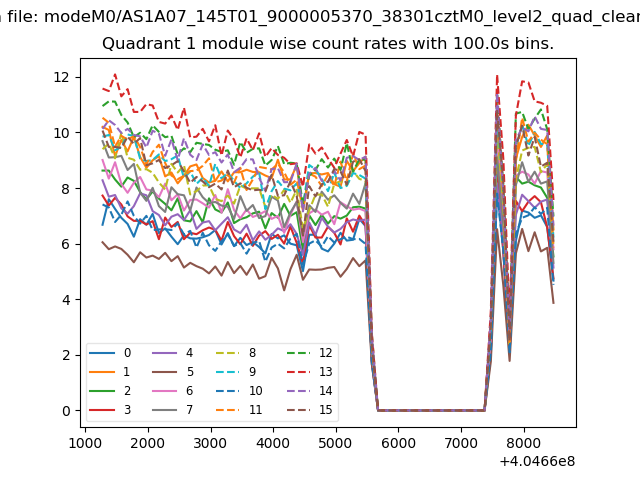
| Module-wise count rates for Quadrant A Data is divided into 100 sec bins |
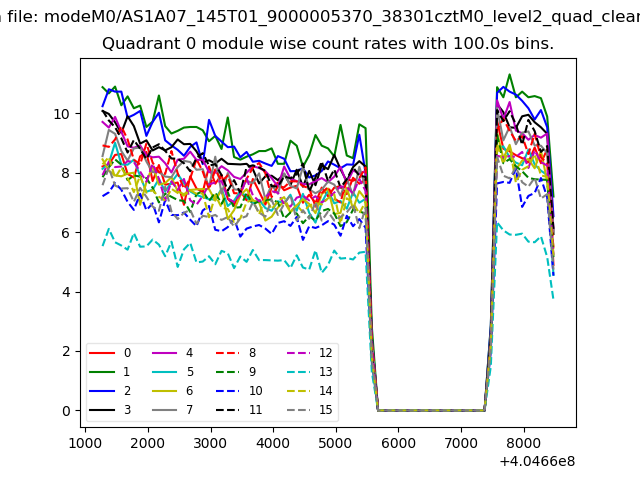 |
 |
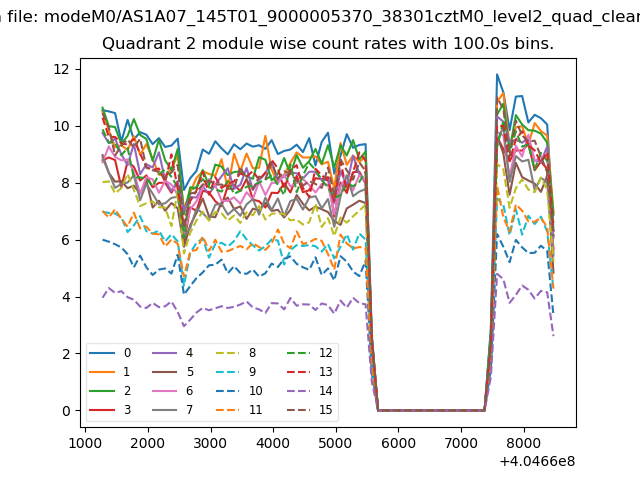
| Module-wise count rates for Quadrant B Data is divided into 100 sec bins |
 |
 |
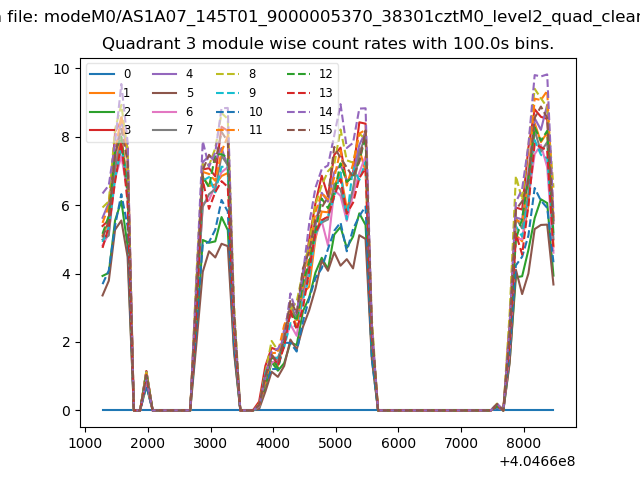
| Module-wise count rates for Quadrant C Data is divided into 100 sec bins |
 |
 |
| Module-wise count rates for Quadrant D Data is divided into 100 sec bins |
 |
 |
| Parameter | Plot |
|---|---|
| CZT HV Monitor | 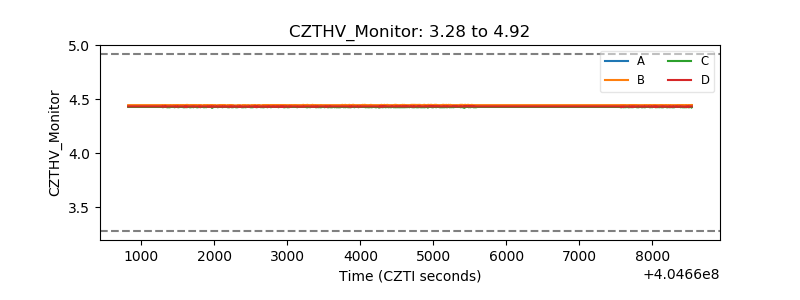 |
| D_VDD | 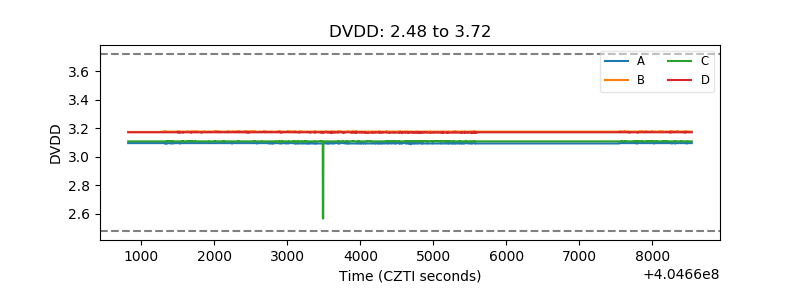 |
| Temperature 1 | 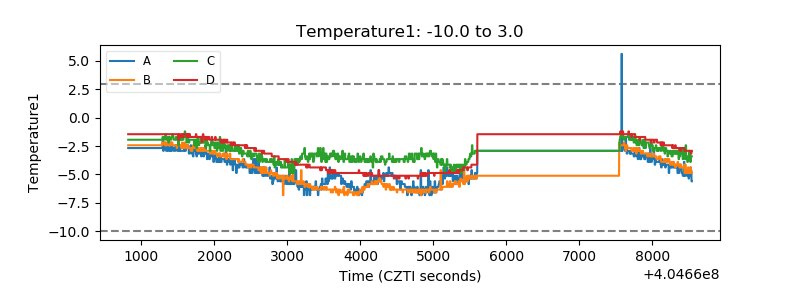 |
| Veto HV Monitor | 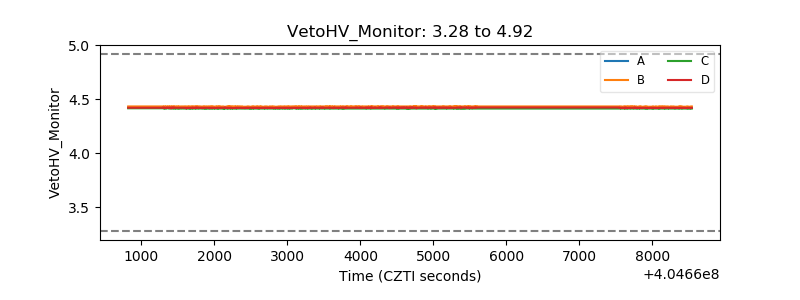 |
| Veto LLD | 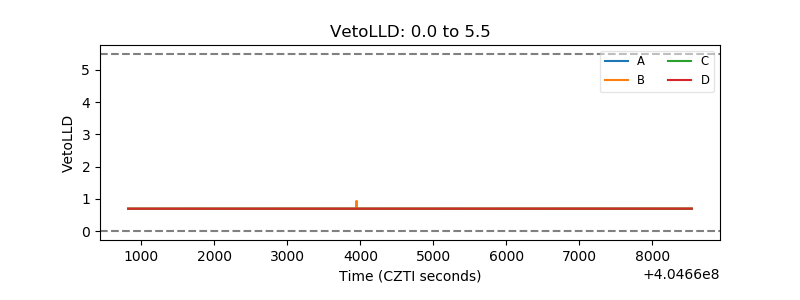 |
| Alpha Counter | 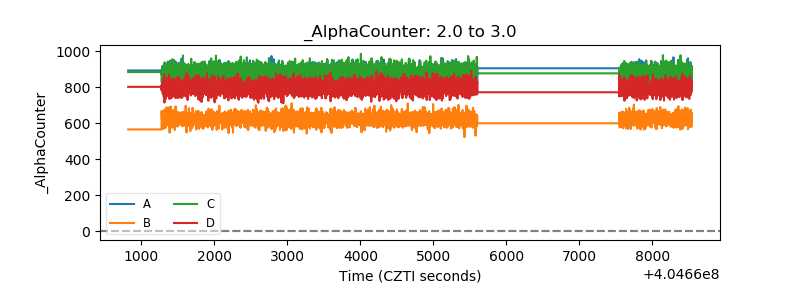 |
| _CPM_Rate | 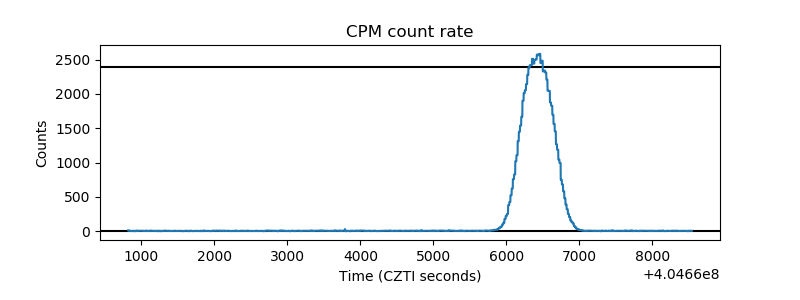 |
| CZT Counter | 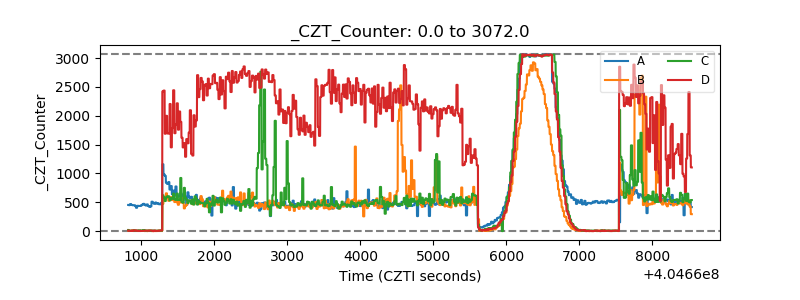 |
| +2.5 Volts monitor |  |
| +5 Volts monitor | 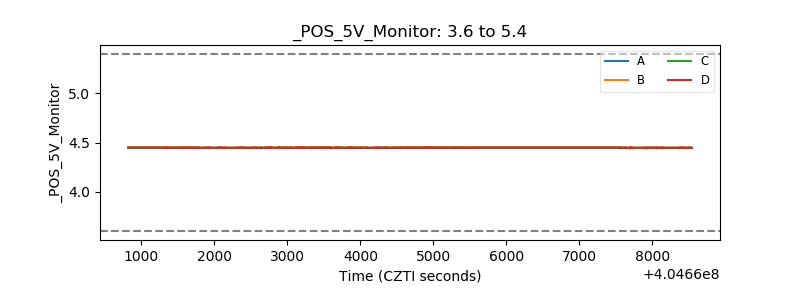 |
| _ROLL_ROT | 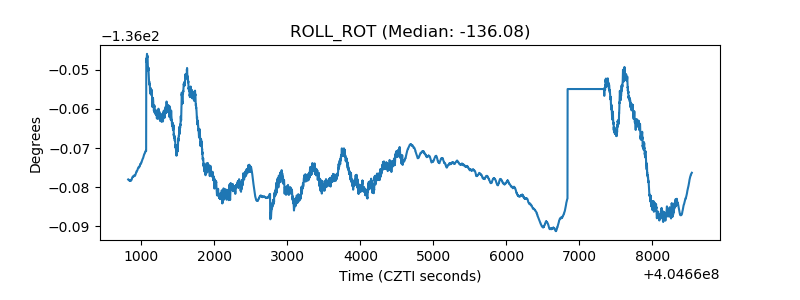 |
| _Roll_DEC | 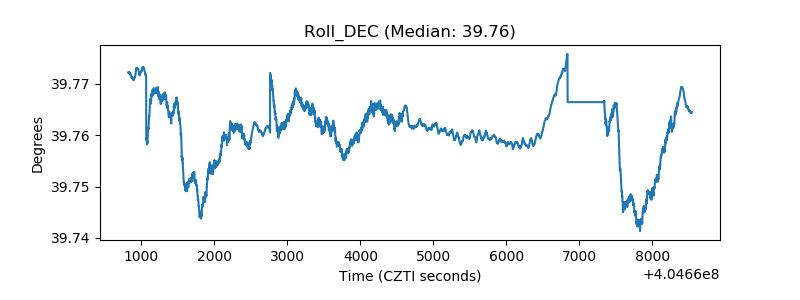 |
| _Roll_RA | 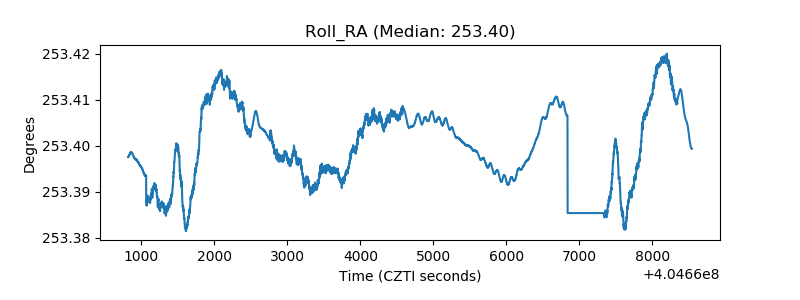 |
| Veto Counter | 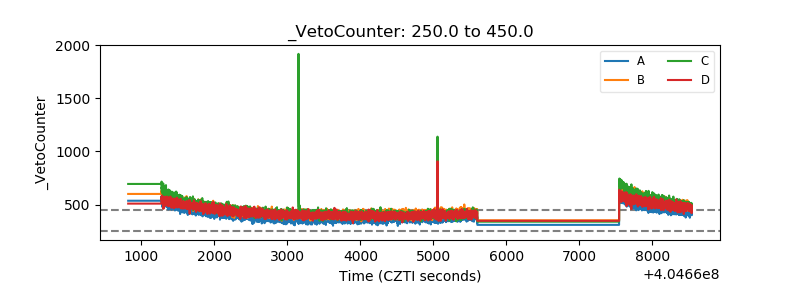 |