| Param | Original file | Final file |
|---|---|---|
| Filename | modeM0/AS1A07_145T01_9000005370_38302cztM0_level2.fits | modeM0/AS1A07_145T01_9000005370_38302cztM0_level2_quad_clean.evt |
| Size (bytes) | 423,792,000 | 90,613,440 |
| Size | 404.2 MB | 86.4 MB |
| Events in quadrant A | 2,718,563 | 641,464 |
| Events in quadrant B | 3,681,053 | 613,461 |
| Events in quadrant C | 2,990,243 | 633,645 |
| Events in quadrant D | 5,908,833 | 504,542 |
| Mode M9 | |||
|---|---|---|---|
| Quadrant | BADHDUFLAG | Total packets | Discarded packets |
| A | 0 | 21 | 0 |
| B | 0 | 21 | 0 |
| C | 0 | 21 | 0 |
| D | 0 | 22 | 0 |
| Mode SS | |||
|---|---|---|---|
| Quadrant | BADHDUFLAG | Total packets | Discarded packets |
| A | 0 | 102 | 0 |
| B | 0 | 102 | 0 |
| C | 0 | 102 | 0 |
| D | 0 | 102 | 0 |
| Mode M0 | |||
|---|---|---|---|
| Quadrant | BADHDUFLAG | Total packets | Discarded packets |
| A | 0 | 11030 | 3 |
| B | 0 | 14209 | 2 |
| C | 0 | 11830 | 2 |
| D | 0 | 21088 | 2 |
| Quadrant | Total seconds | Saturated seconds | Saturation percentage |
|---|---|---|---|
| A | 5002 | 16 | 0.319872% |
| B | 5002 | 442 | 8.836465% |
| C | 5002 | 55 | 1.099560% |
| D | 5002 | 758 | 15.153938% |
Noise dominated data is calculated using 1-second bins in cleaned event files. If a bin has >2000 counts, and if more than 50% of those come from <1% of pixels, then it is considered to be noise-dominated and hence unusable.
| Quadrant | # 1 sec bins | Bins with >0 counts | Bins with >2000 counts | High rate bins dominated by noise | Noise dominated (total time) | Noise dominated (detector-on time) | Marked lightcurve |
|---|---|---|---|---|---|---|---|
| A | 7065 | 5003 | 7 | 7 | 0.10% | 0.14% | 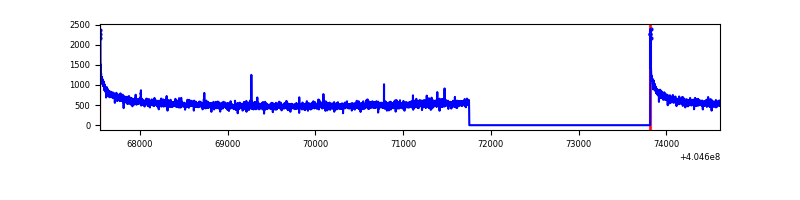 |
| B | 7065 | 5003 | 289 | 289 | 4.09% | 5.78% | 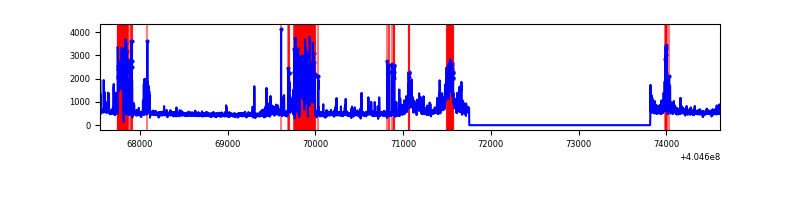 |
| C | 7065 | 5003 | 50 | 50 | 0.71% | 1.00% | 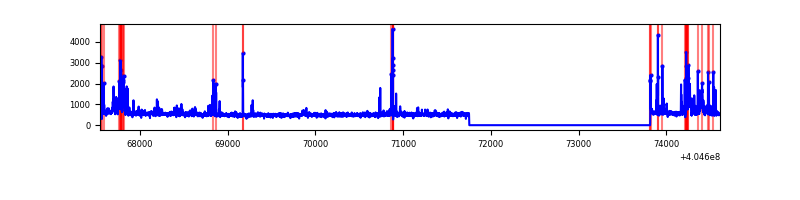 |
| D | 7065 | 5003 | 626 | 626 | 8.86% | 12.51% | 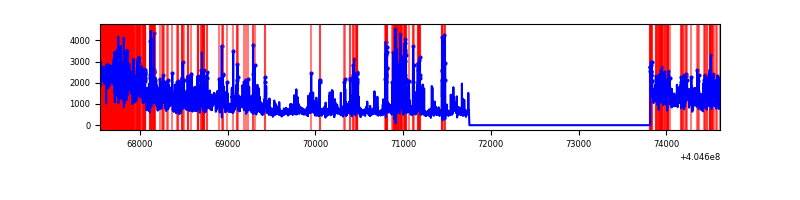 |
Top three noisy pixels from each quadrant. If the there are fewer than three noisy pixels in the level2.evt file, extra rows are filled as -1
| Pixel properties | Quadrant properties | ||||||
|---|---|---|---|---|---|---|---|
| Quadrant | DetID | PixID | Counts | Sigma | Mean | Median | Sigma |
| A | 10 | 83 | 379609 | 3181.56 | 593 | 582 | 119.1 |
| A | 12 | 189 | 30753 | 253.26 | 593 | 582 | 119.1 |
| A | 13 | 6 | 9463 | 74.55 | 593 | 582 | 119.1 |
| B | 5 | 184 | 809665 | 7389.89 | 574 | 560 | 109.5 |
| B | 5 | 172 | 409819 | 3737.93 | 574 | 560 | 109.5 |
| B | 15 | 85 | 76423 | 692.89 | 574 | 560 | 109.5 |
| C | 2 | 16 | 302543 | 2207.61 | 592 | 597 | 136.8 |
| C | 15 | 214 | 209981 | 1530.86 | 592 | 597 | 136.8 |
| C | 15 | 208 | 78123 | 566.81 | 592 | 597 | 136.8 |
| D | 2 | 16 | 1675970 | 12408.46 | 558 | 544 | 135.0 |
| D | 12 | 235 | 590818 | 4371.66 | 558 | 544 | 135.0 |
| D | 10 | 203 | 568315 | 4205.0 | 558 | 544 | 135.0 |
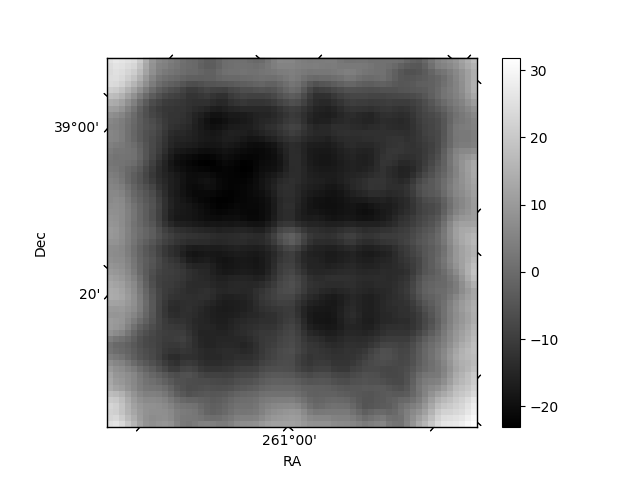
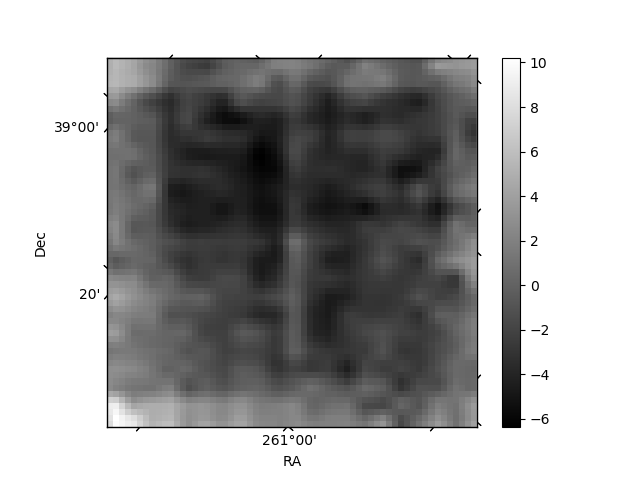
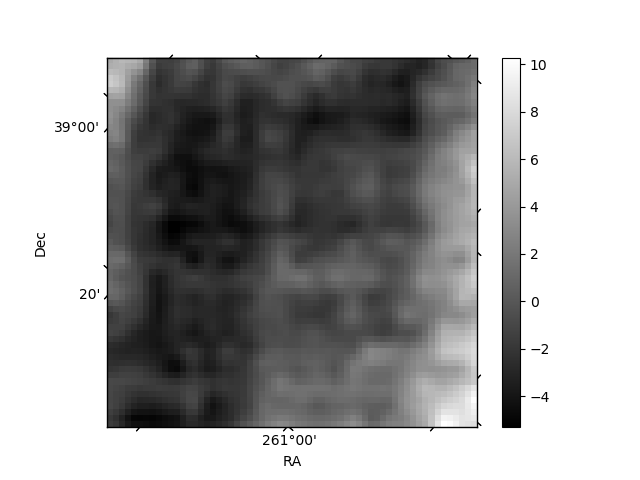
Histogram calculated using DETX and DETY for each event in the final _common_clean file
| Quadrant A | 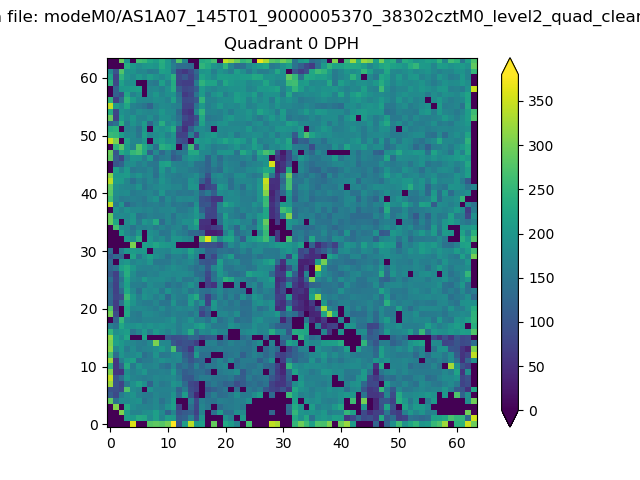 |
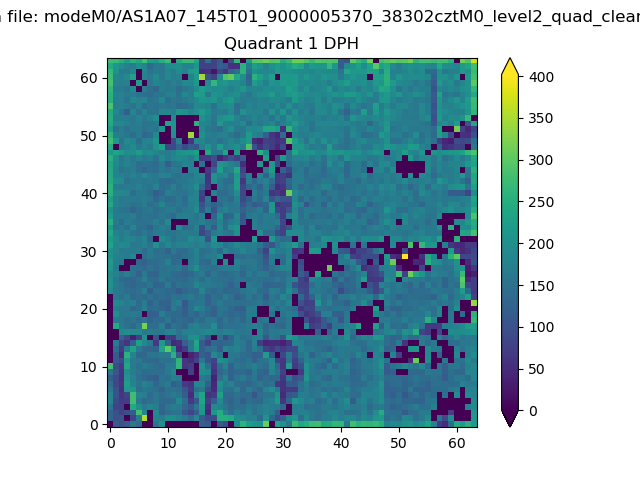 |
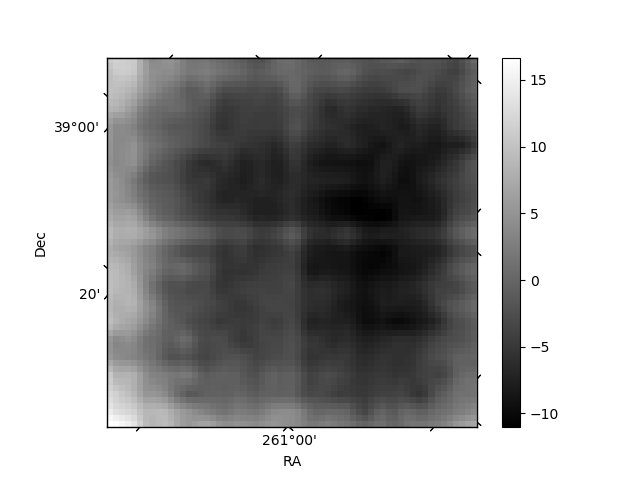
Quadrant B |
|---|---|---|---|
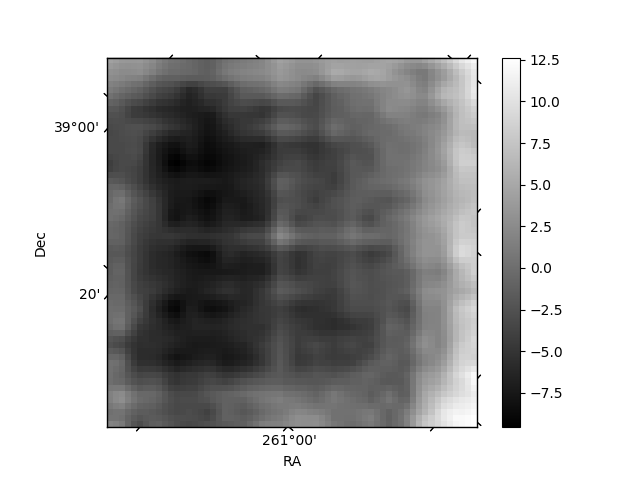
| Quadrant D | 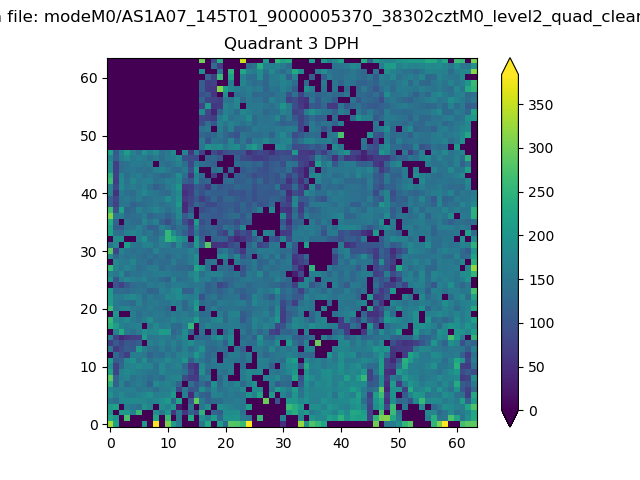 |
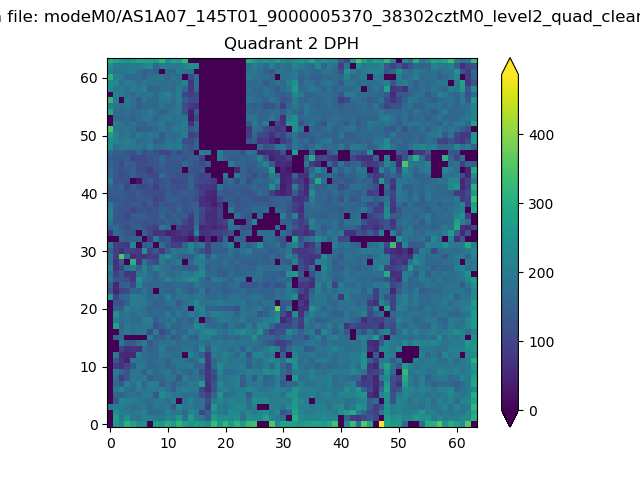 |
Quadrant C |
| Plot type | Count rate plots | Images |
|---|---|---|
| Comparison with Poisson distribution Blue bars denote a histogram of data divided into 1 sec bins. Red curve is a Poisson curve with rate = median count rate of data. |
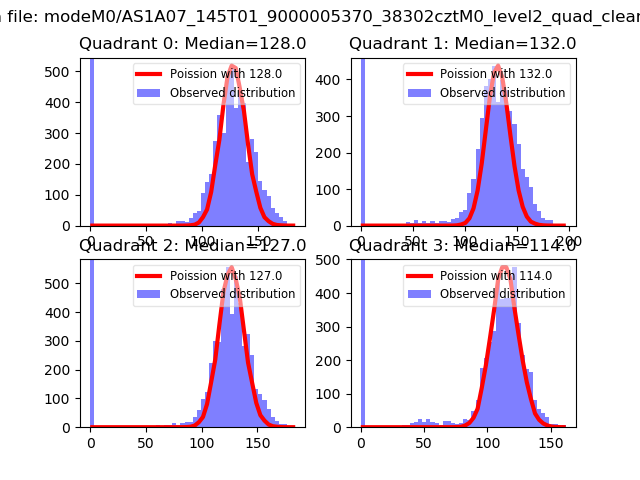 |
 |
| Quadrant-wise count rates Data is divided into 100 sec bins |
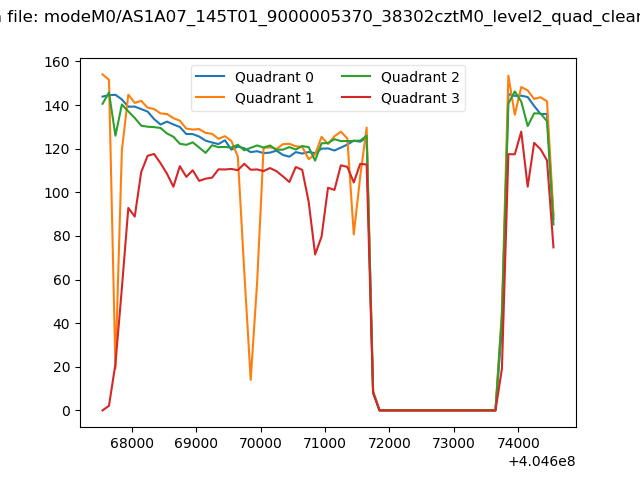 |
|
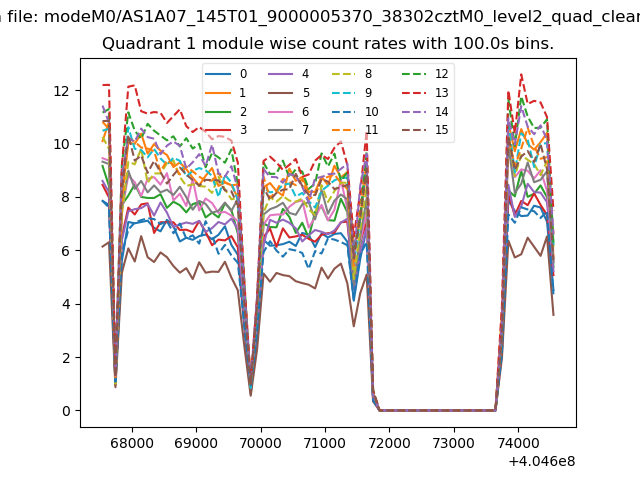
| Module-wise count rates for Quadrant A Data is divided into 100 sec bins |
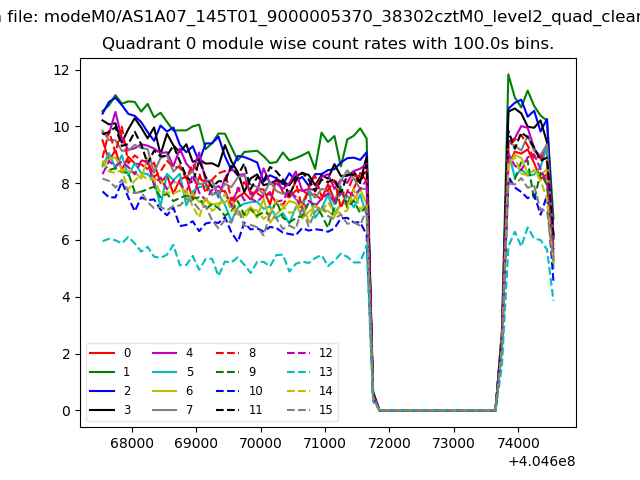 |
 |
| Module-wise count rates for Quadrant B Data is divided into 100 sec bins |
 |
 |
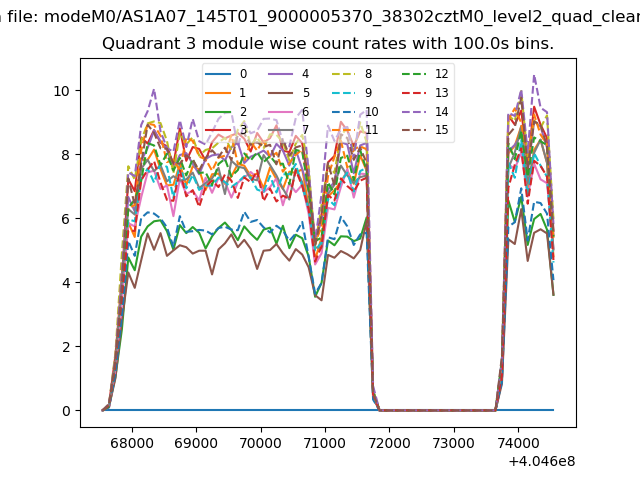
| Module-wise count rates for Quadrant C Data is divided into 100 sec bins |
 |
 |
| Module-wise count rates for Quadrant D Data is divided into 100 sec bins |
 |
 |
| Parameter | Plot |
|---|---|
| CZT HV Monitor | 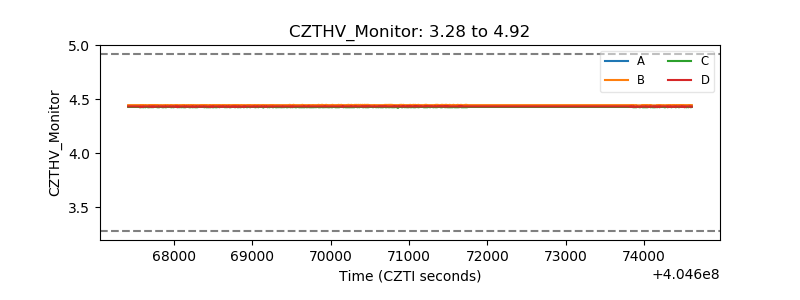 |
| D_VDD | 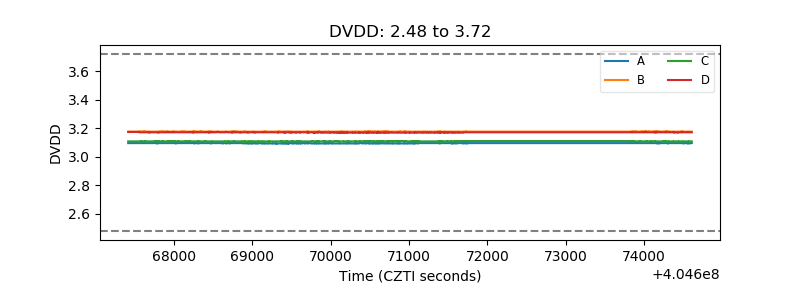 |
| Temperature 1 | 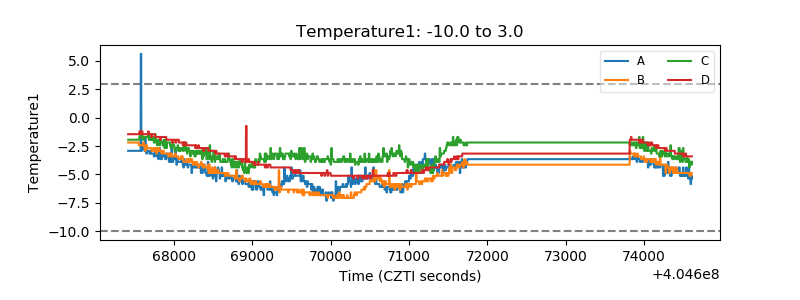 |
| Veto HV Monitor | 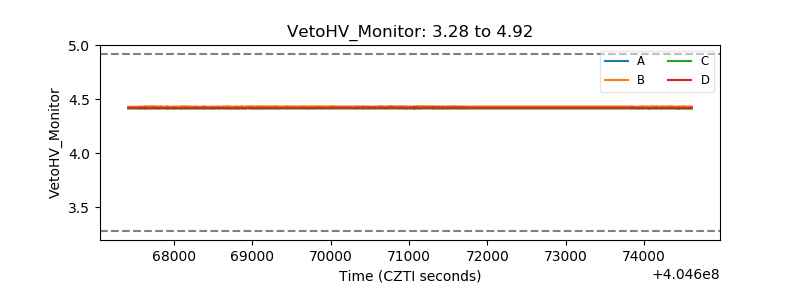 |
| Veto LLD | 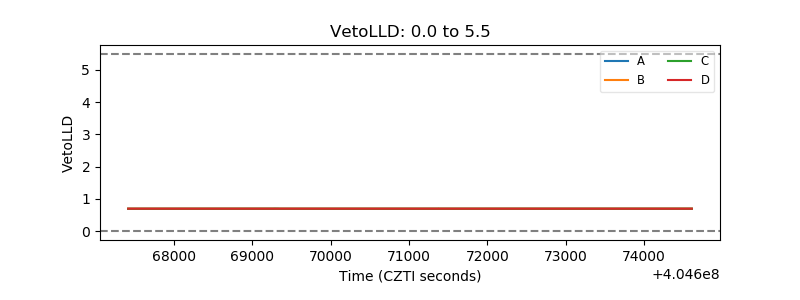 |
| Alpha Counter | 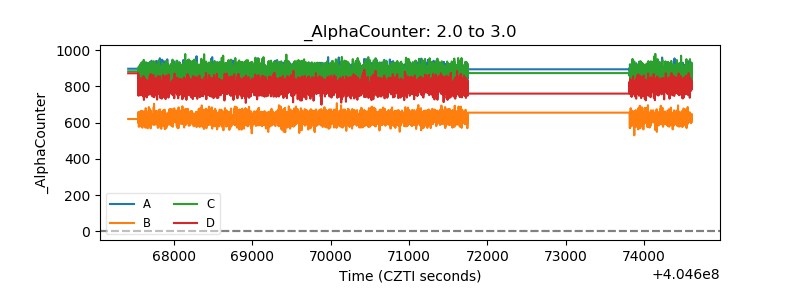 |
| _CPM_Rate | 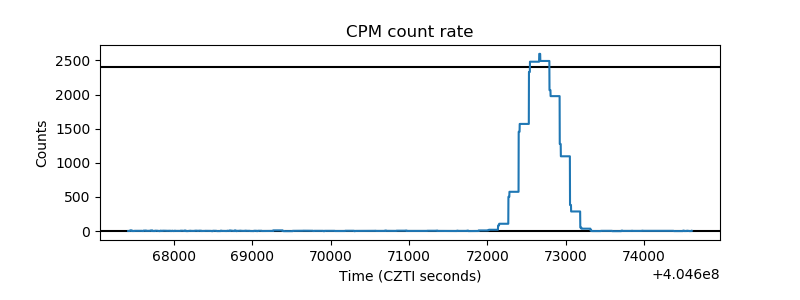 |
| CZT Counter | 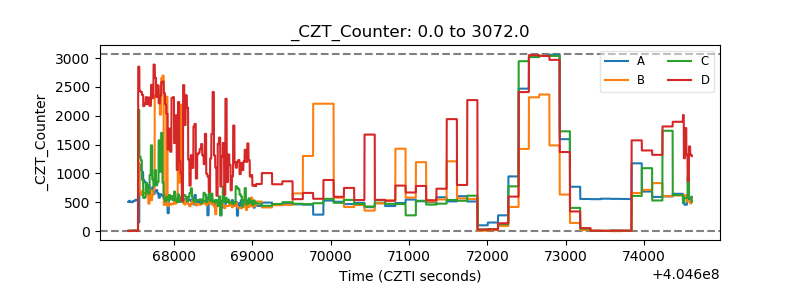 |
| +2.5 Volts monitor | 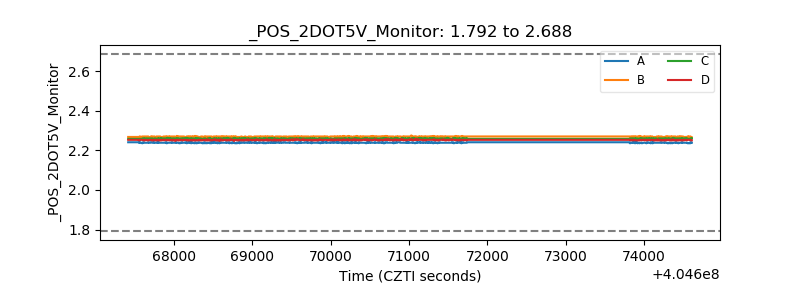 |
| +5 Volts monitor | 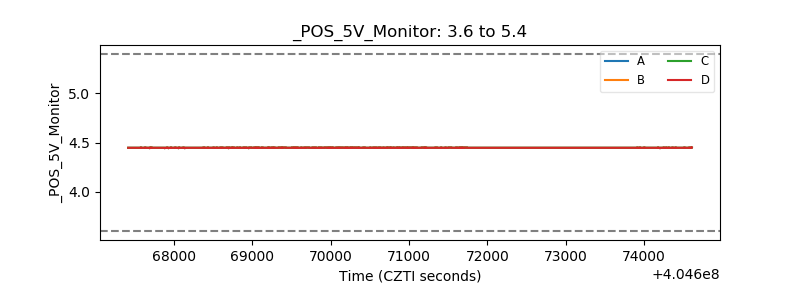 |
| _ROLL_ROT | 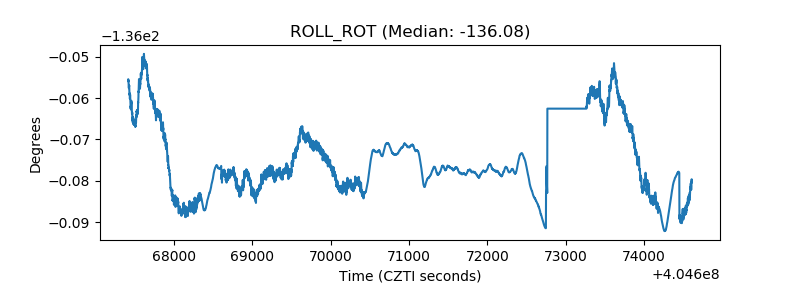 |
| _Roll_DEC | 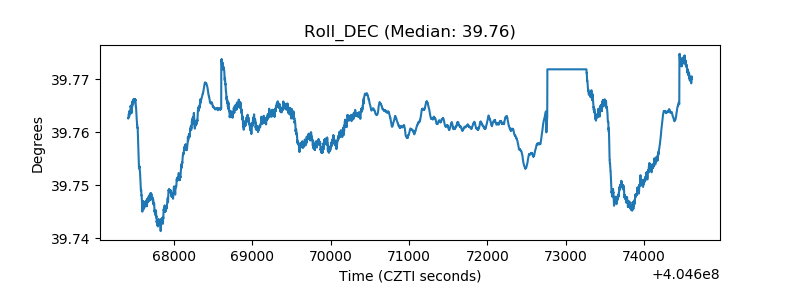 |
| _Roll_RA | 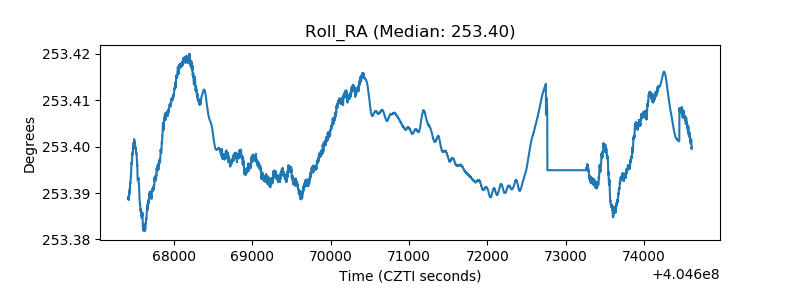 |
| Veto Counter | 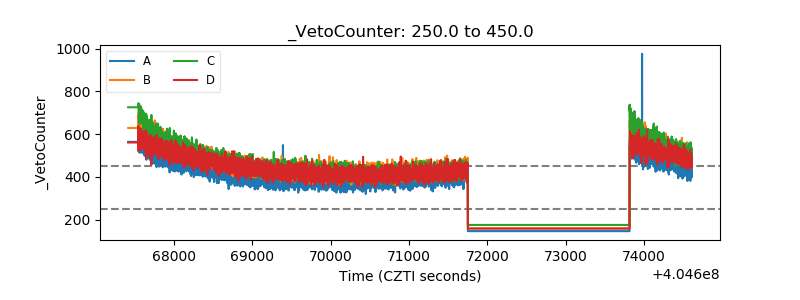 |