| Param | Original file | Final file |
|---|---|---|
| Filename | modeM0/AS1A07_145T01_9000005370_38303cztM0_level2.fits | modeM0/AS1A07_145T01_9000005370_38303cztM0_level2_quad_clean.evt |
| Size (bytes) | 381,441,600 | 90,198,720 |
| Size | 363.8 MB | 86.0 MB |
| Events in quadrant A | 2,641,536 | 617,857 |
| Events in quadrant B | 2,809,779 | 636,816 |
| Events in quadrant C | 2,939,353 | 612,446 |
| Events in quadrant D | 5,350,425 | 522,500 |
| Mode M9 | |||
|---|---|---|---|
| Quadrant | BADHDUFLAG | Total packets | Discarded packets |
| A | 0 | 25 | 0 |
| B | 0 | 25 | 0 |
| C | 0 | 25 | 0 |
| D | 0 | 26 | 0 |
| Mode SS | |||
|---|---|---|---|
| Quadrant | BADHDUFLAG | Total packets | Discarded packets |
| A | 0 | 100 | 0 |
| B | 0 | 100 | 0 |
| C | 0 | 100 | 0 |
| D | 0 | 100 | 0 |
| Mode M0 | |||
|---|---|---|---|
| Quadrant | BADHDUFLAG | Total packets | Discarded packets |
| A | 0 | 10746 | 3 |
| B | 0 | 11388 | 2 |
| C | 0 | 11533 | 2 |
| D | 0 | 19368 | 2 |
| Quadrant | Total seconds | Saturated seconds | Saturation percentage |
|---|---|---|---|
| A | 4870 | 12 | 0.246407% |
| B | 4870 | 68 | 1.396304% |
| C | 4870 | 75 | 1.540041% |
| D | 4870 | 512 | 10.513347% |
Noise dominated data is calculated using 1-second bins in cleaned event files. If a bin has >2000 counts, and if more than 50% of those come from <1% of pixels, then it is considered to be noise-dominated and hence unusable.
| Quadrant | # 1 sec bins | Bins with >0 counts | Bins with >2000 counts | High rate bins dominated by noise | Noise dominated (total time) | Noise dominated (detector-on time) | Marked lightcurve |
|---|---|---|---|---|---|---|---|
| A | 6993 | 4871 | 7 | 7 | 0.10% | 0.14% | 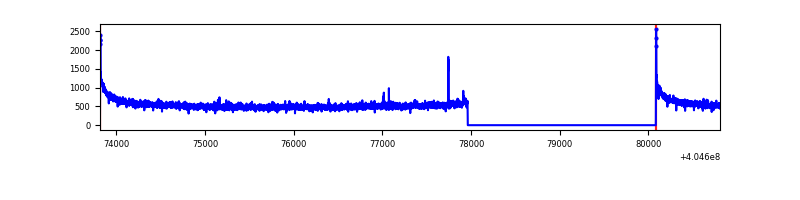 |
| B | 6993 | 4871 | 34 | 34 | 0.49% | 0.70% | 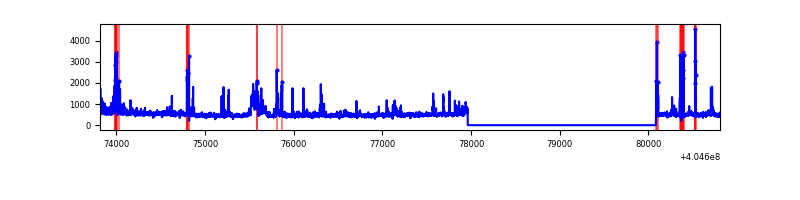 |
| C | 6993 | 4871 | 71 | 71 | 1.02% | 1.46% | 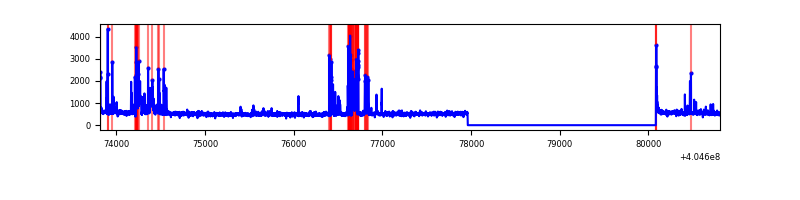 |
| D | 6993 | 4871 | 397 | 397 | 5.68% | 8.15% | 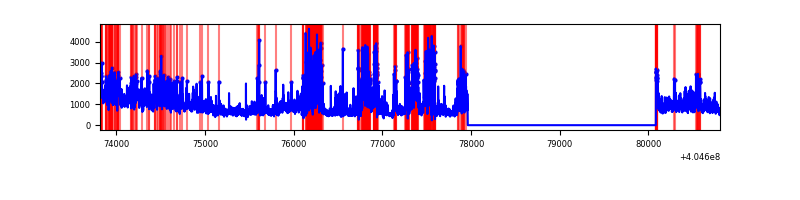 |
Top three noisy pixels from each quadrant. If the there are fewer than three noisy pixels in the level2.evt file, extra rows are filled as -1
| Pixel properties | Quadrant properties | ||||||
|---|---|---|---|---|---|---|---|
| Quadrant | DetID | PixID | Counts | Sigma | Mean | Median | Sigma |
| A | 10 | 83 | 360211 | 3129.6 | 574 | 564 | 114.9 |
| A | 12 | 189 | 33558 | 287.11 | 574 | 564 | 114.9 |
| A | 13 | 248 | 14250 | 119.09 | 574 | 564 | 114.9 |
| B | 0 | 183 | 181890 | 1635.48 | 578 | 564 | 110.9 |
| B | 5 | 184 | 134524 | 1208.26 | 578 | 564 | 110.9 |
| B | 5 | 172 | 124096 | 1114.2 | 578 | 564 | 110.9 |
| C | 2 | 16 | 408710 | 3088.5 | 574 | 578 | 132.1 |
| C | 15 | 214 | 204642 | 1544.24 | 574 | 578 | 132.1 |
| C | 0 | 10 | 27704 | 205.27 | 574 | 578 | 132.1 |
| D | 2 | 16 | 1378141 | 10327.7 | 549 | 535 | 133.4 |
| D | 13 | 138 | 1083816 | 8121.19 | 549 | 535 | 133.4 |
| D | 12 | 235 | 594001 | 4449.12 | 549 | 535 | 133.4 |
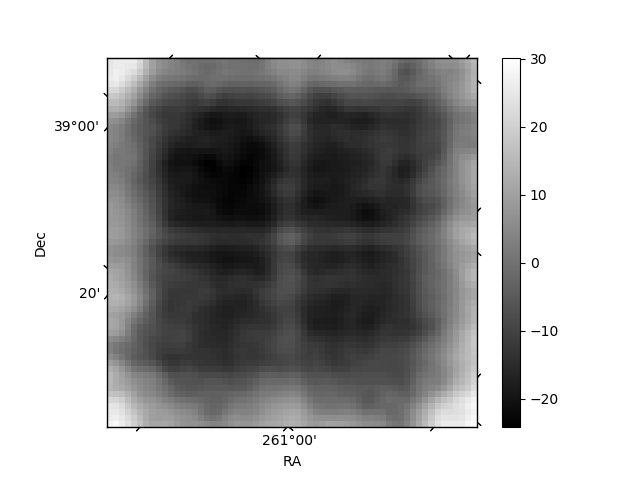
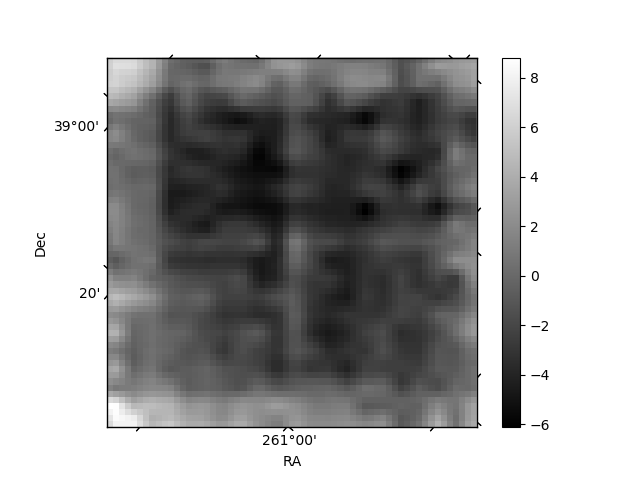
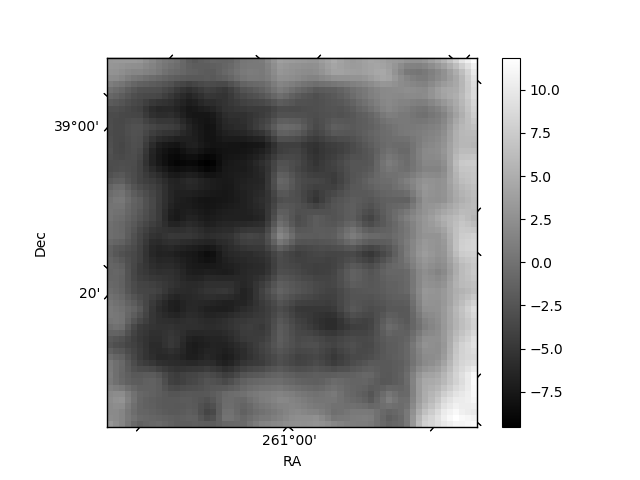
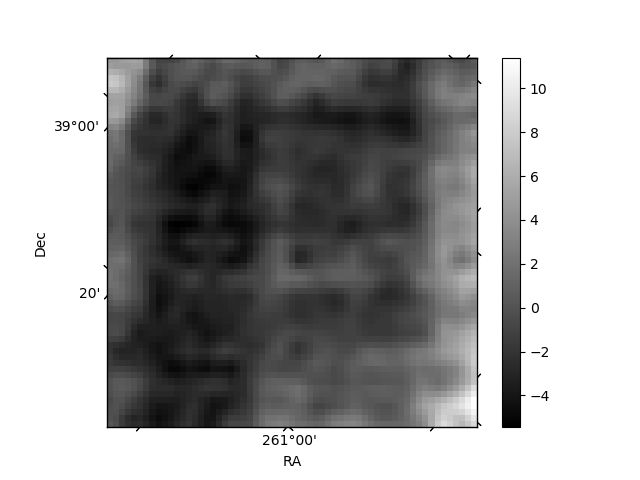
Histogram calculated using DETX and DETY for each event in the final _common_clean file
| Quadrant A | 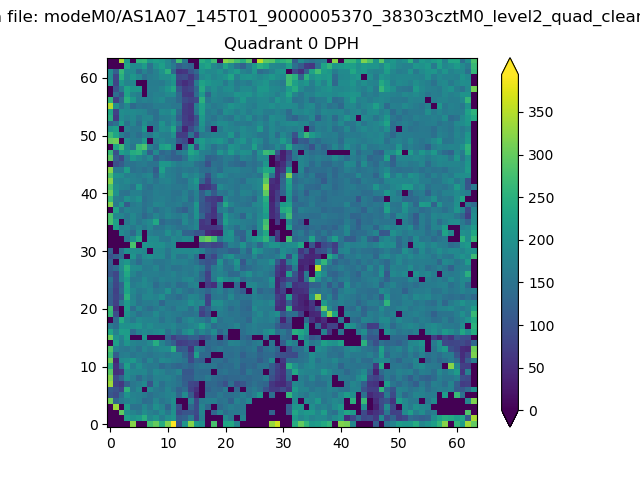 |
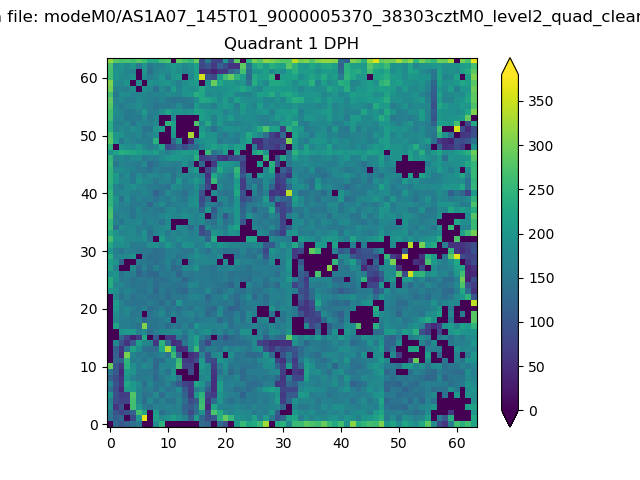 |
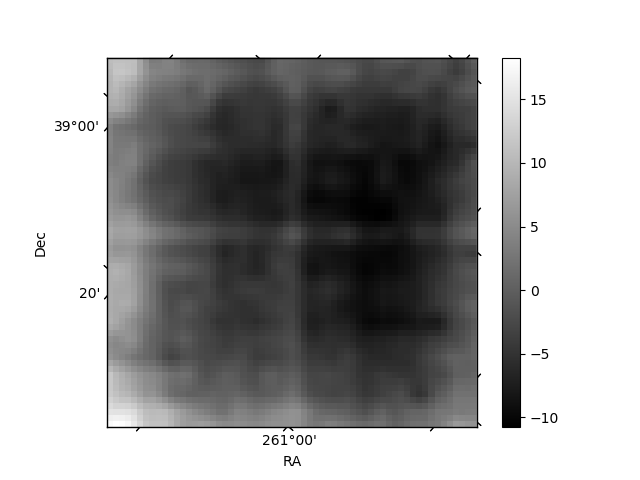
Quadrant B |
|---|---|---|---|
| Quadrant D | 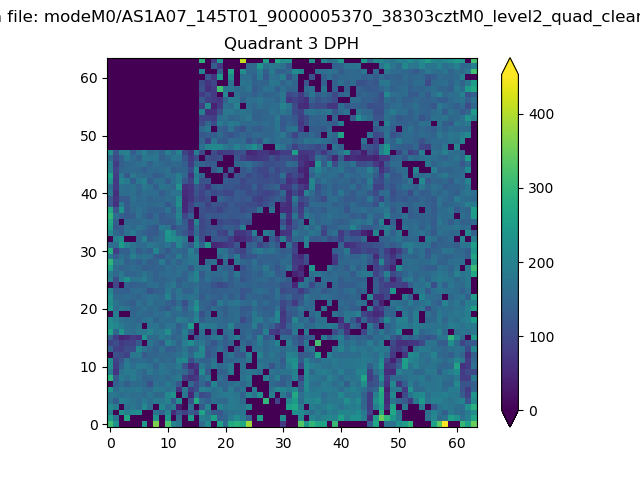 |
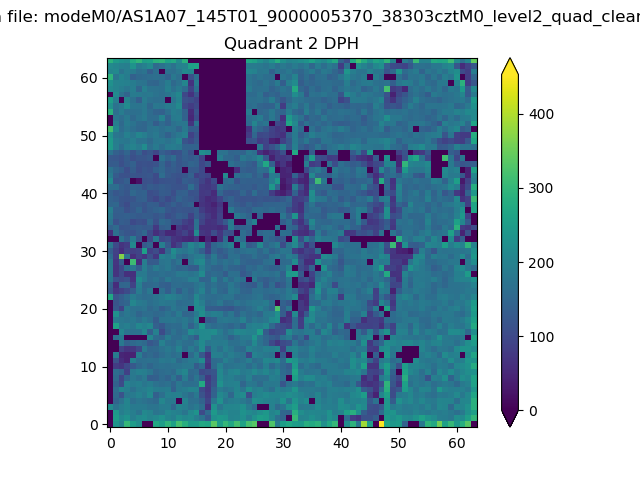 |
Quadrant C |
| Plot type | Count rate plots | Images |
|---|---|---|
| Comparison with Poisson distribution Blue bars denote a histogram of data divided into 1 sec bins. Red curve is a Poisson curve with rate = median count rate of data. |
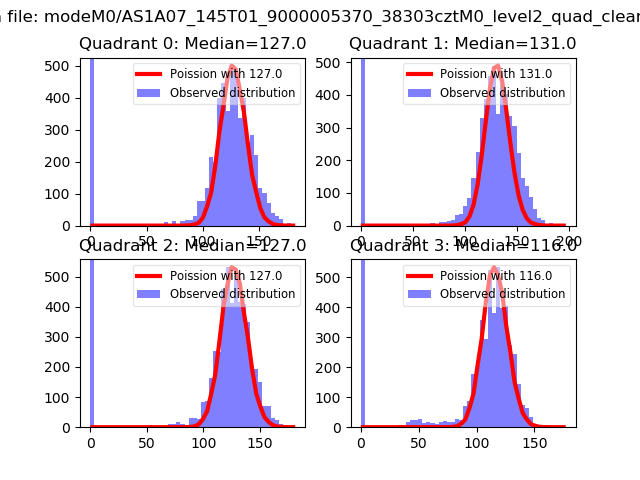 |
 |
| Quadrant-wise count rates Data is divided into 100 sec bins |
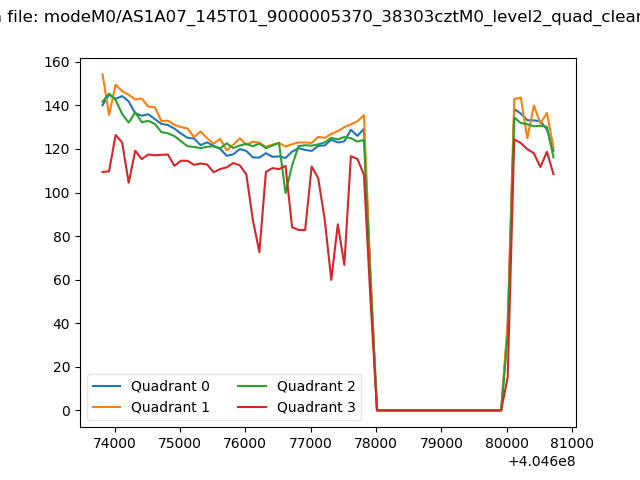 |
|
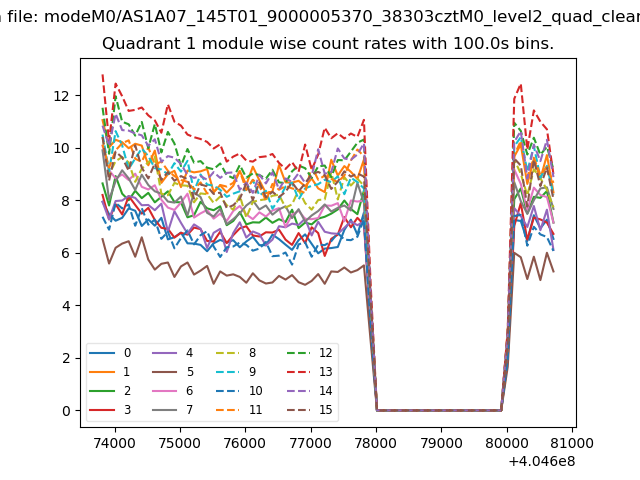
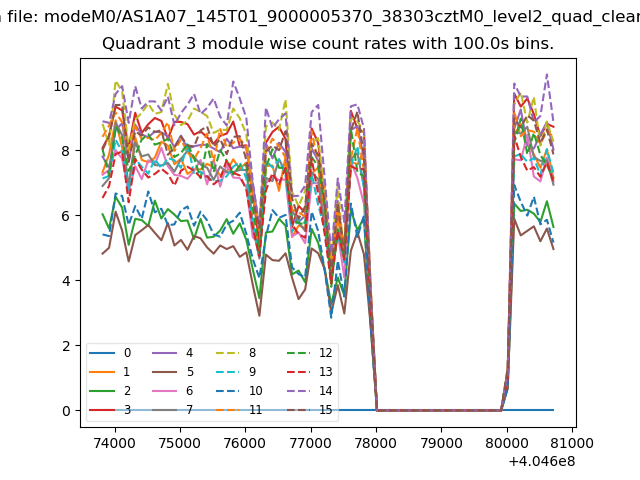
| Module-wise count rates for Quadrant A Data is divided into 100 sec bins |
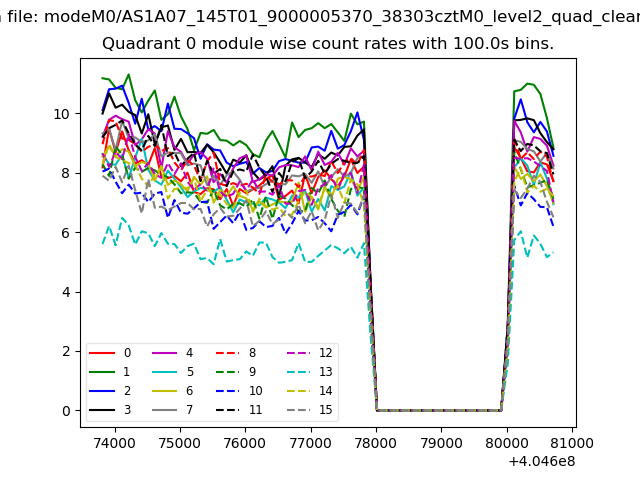 |
 |
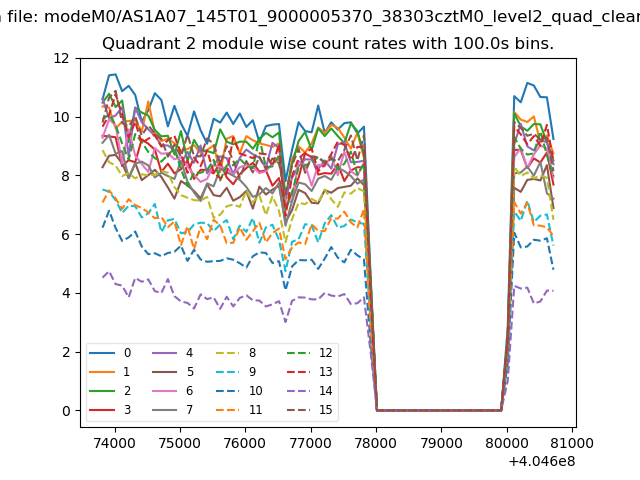
| Module-wise count rates for Quadrant B Data is divided into 100 sec bins |
 |
 |
| Module-wise count rates for Quadrant C Data is divided into 100 sec bins |
 |
 |
| Module-wise count rates for Quadrant D Data is divided into 100 sec bins |
 |
 |
| Parameter | Plot |
|---|---|
| CZT HV Monitor | 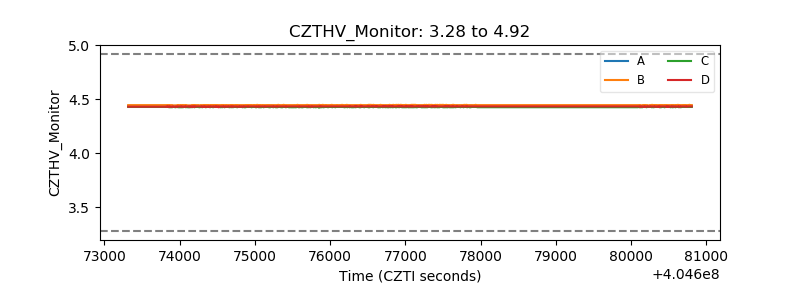 |
| D_VDD | 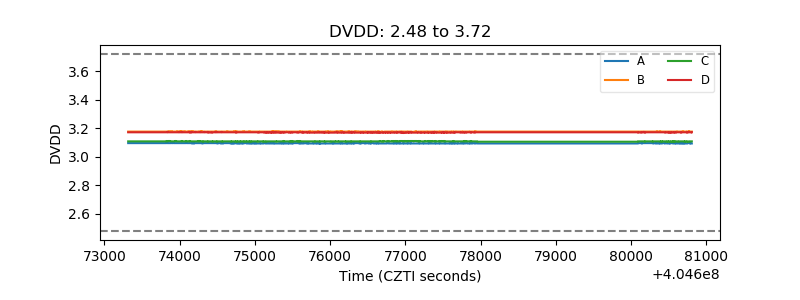 |
| Temperature 1 | 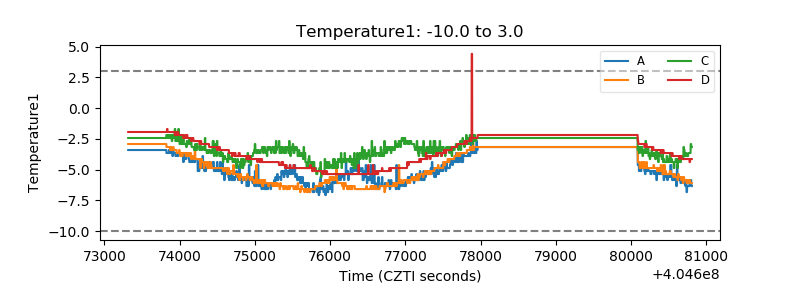 |
| Veto HV Monitor | 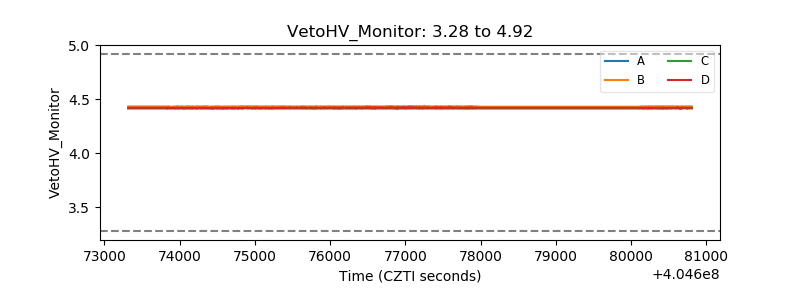 |
| Veto LLD | 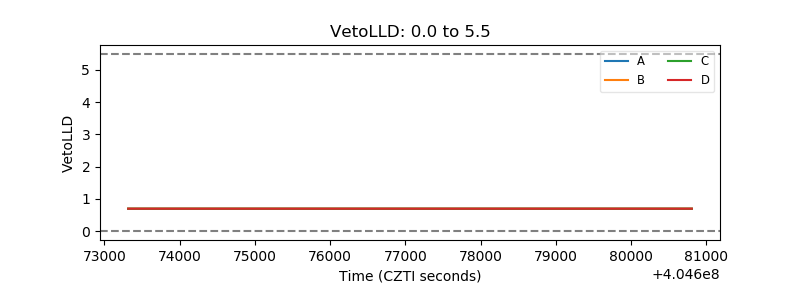 |
| Alpha Counter | 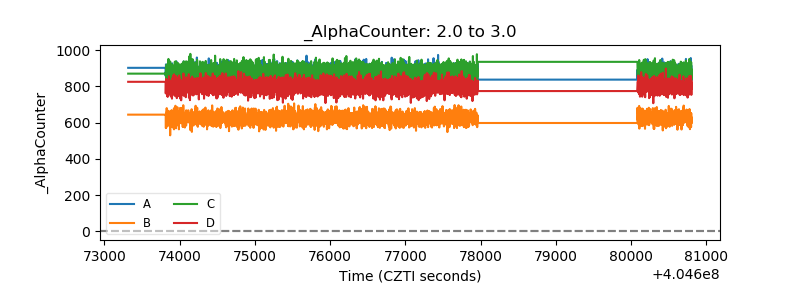 |
| _CPM_Rate | 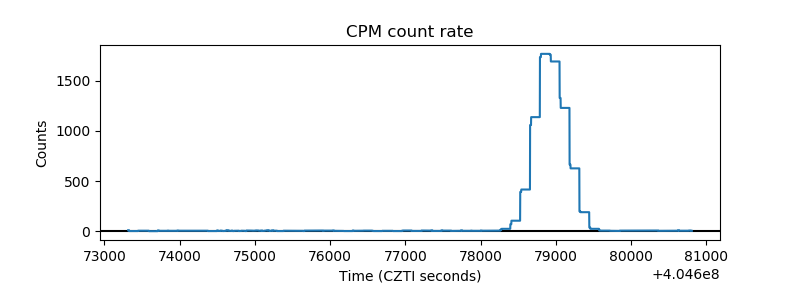 |
| CZT Counter | 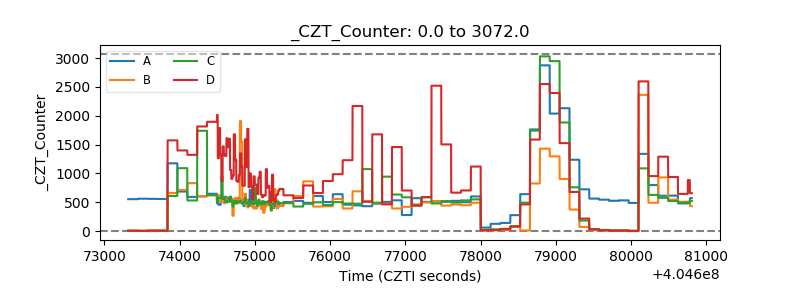 |
| +2.5 Volts monitor | 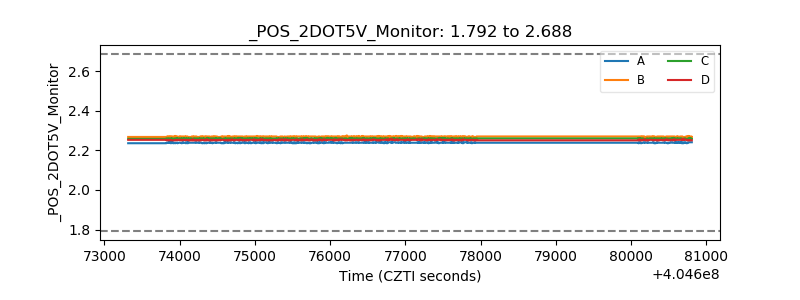 |
| +5 Volts monitor | 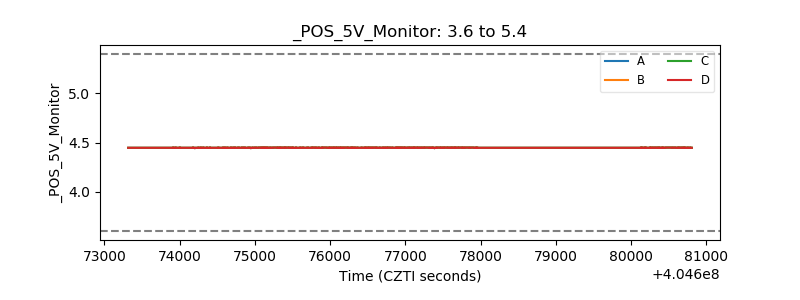 |
| _ROLL_ROT | 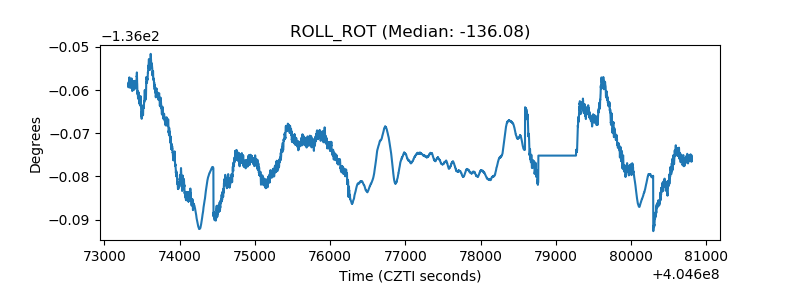 |
| _Roll_DEC | 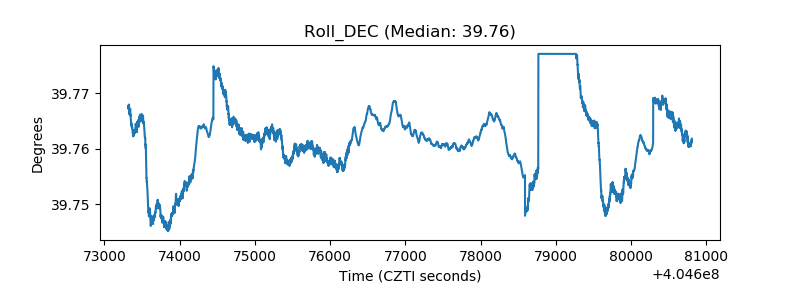 |
| _Roll_RA | 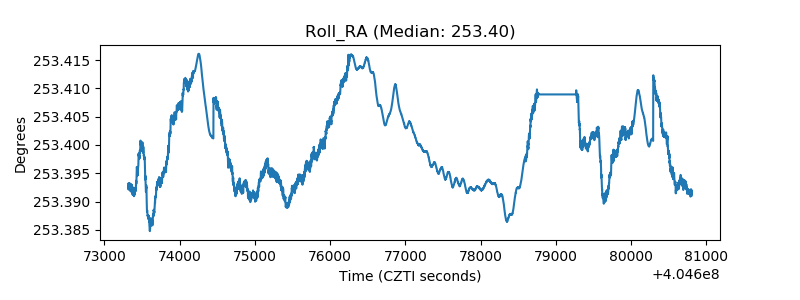 |
| Veto Counter | 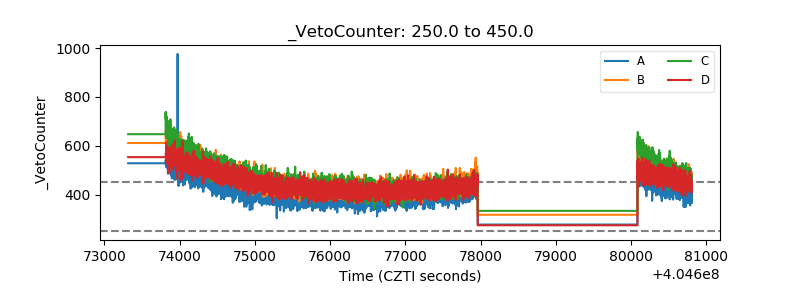 |