| Param | Original file | Final file |
|---|---|---|
| Filename | modeM0/AS1A07_145T01_9000005370_38304cztM0_level2.fits | modeM0/AS1A07_145T01_9000005370_38304cztM0_level2_quad_clean.evt |
| Size (bytes) | 355,104,000 | 92,413,440 |
| Size | 338.7 MB | 88.1 MB |
| Events in quadrant A | 2,719,512 | 623,254 |
| Events in quadrant B | 2,886,817 | 640,943 |
| Events in quadrant C | 2,647,838 | 622,292 |
| Events in quadrant D | 4,489,690 | 551,169 |
| Mode M9 | |||
|---|---|---|---|
| Quadrant | BADHDUFLAG | Total packets | Discarded packets |
| A | 0 | 29 | 0 |
| B | 0 | 29 | 0 |
| C | 0 | 29 | 0 |
| D | 0 | 30 | 0 |
| Mode SS | |||
|---|---|---|---|
| Quadrant | BADHDUFLAG | Total packets | Discarded packets |
| A | 0 | 104 | 0 |
| B | 0 | 104 | 0 |
| C | 0 | 104 | 0 |
| D | 0 | 104 | 0 |
| Mode M0 | |||
|---|---|---|---|
| Quadrant | BADHDUFLAG | Total packets | Discarded packets |
| A | 0 | 11159 | 3 |
| B | 0 | 11819 | 2 |
| C | 0 | 10829 | 2 |
| D | 0 | 16980 | 2 |
| Quadrant | Total seconds | Saturated seconds | Saturation percentage |
|---|---|---|---|
| A | 5153 | 13 | 0.252280% |
| B | 5153 | 98 | 1.901805% |
| C | 5153 | 14 | 0.271686% |
| D | 5153 | 288 | 5.588977% |
Noise dominated data is calculated using 1-second bins in cleaned event files. If a bin has >2000 counts, and if more than 50% of those come from <1% of pixels, then it is considered to be noise-dominated and hence unusable.
| Quadrant | # 1 sec bins | Bins with >0 counts | Bins with >2000 counts | High rate bins dominated by noise | Noise dominated (total time) | Noise dominated (detector-on time) | Marked lightcurve |
|---|---|---|---|---|---|---|---|
| A | 7306 | 5154 | 7 | 7 | 0.10% | 0.14% | 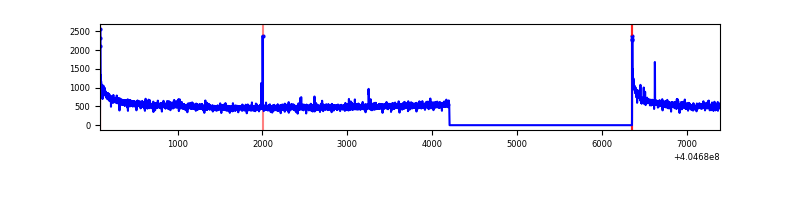 |
| B | 7306 | 5154 | 61 | 61 | 0.83% | 1.18% | 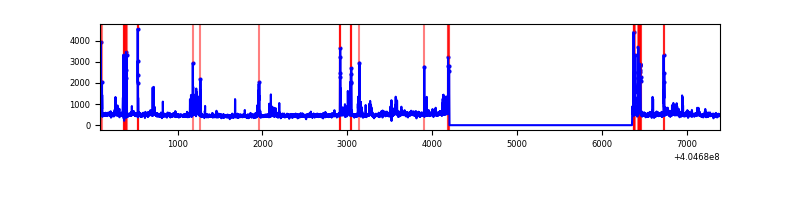 |
| C | 7306 | 5154 | 8 | 8 | 0.11% | 0.16% | 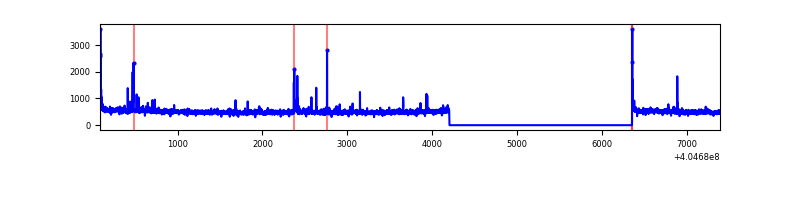 |
| D | 7306 | 5154 | 205 | 205 | 2.81% | 3.98% | 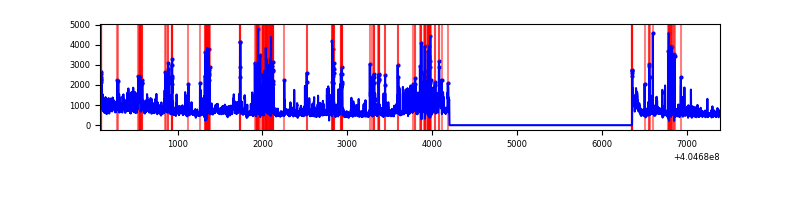 |
Top three noisy pixels from each quadrant. If the there are fewer than three noisy pixels in the level2.evt file, extra rows are filled as -1
| Pixel properties | Quadrant properties | ||||||
|---|---|---|---|---|---|---|---|
| Quadrant | DetID | PixID | Counts | Sigma | Mean | Median | Sigma |
| A | 10 | 83 | 364355 | 3056.94 | 590 | 581 | 119.0 |
| A | 12 | 189 | 25755 | 211.55 | 590 | 581 | 119.0 |
| A | 13 | 6 | 20346 | 166.09 | 590 | 581 | 119.0 |
| B | 5 | 184 | 221087 | 1952.7 | 590 | 574 | 112.9 |
| B | 5 | 172 | 171141 | 1510.41 | 590 | 574 | 112.9 |
| B | 0 | 183 | 106193 | 935.28 | 590 | 574 | 112.9 |
| C | 15 | 214 | 217671 | 1591.52 | 590 | 595 | 136.4 |
| C | 14 | 254 | 43436 | 314.09 | 590 | 595 | 136.4 |
| C | 0 | 10 | 35621 | 256.8 | 590 | 595 | 136.4 |
| D | 2 | 16 | 1010447 | 7210.43 | 571 | 556 | 140.1 |
| D | 13 | 138 | 572114 | 4080.82 | 571 | 556 | 140.1 |
| D | 12 | 235 | 310523 | 2213.11 | 571 | 556 | 140.1 |
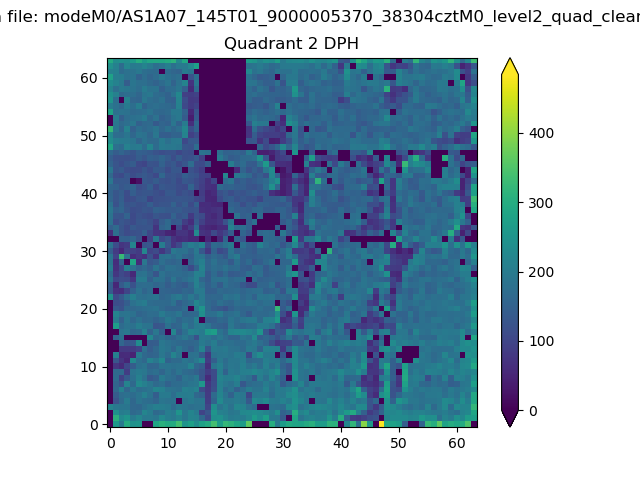
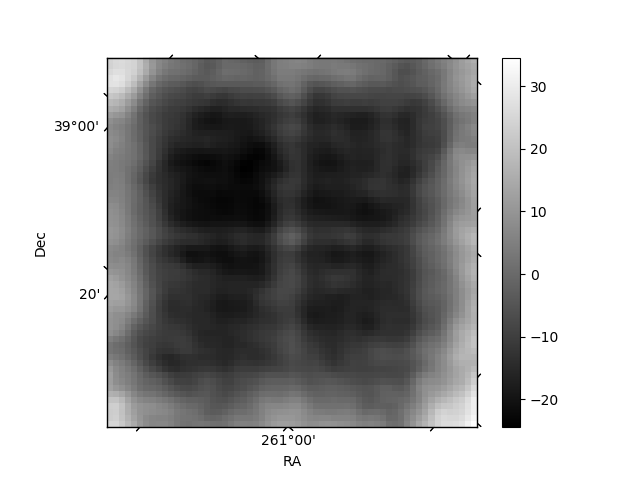
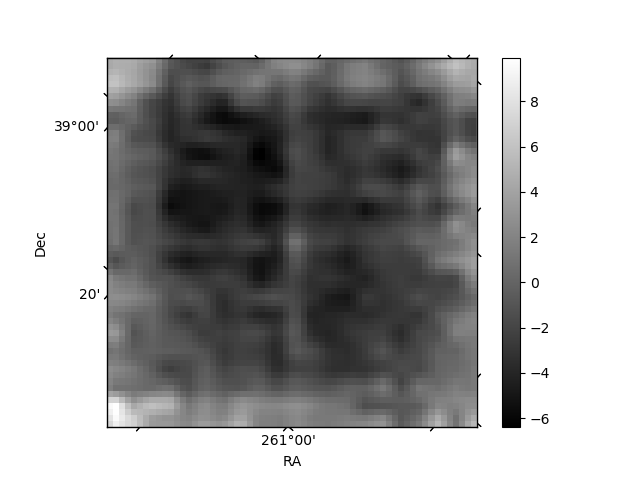
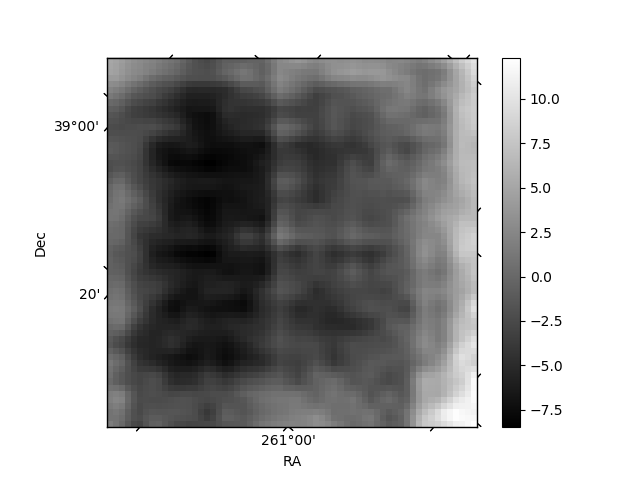
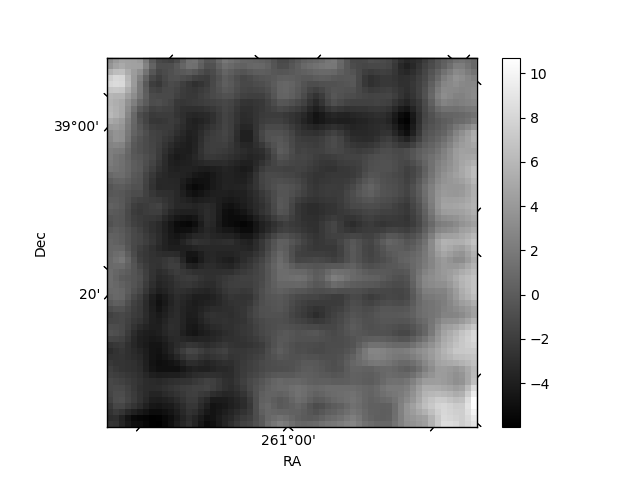
Histogram calculated using DETX and DETY for each event in the final _common_clean file
| Quadrant A | 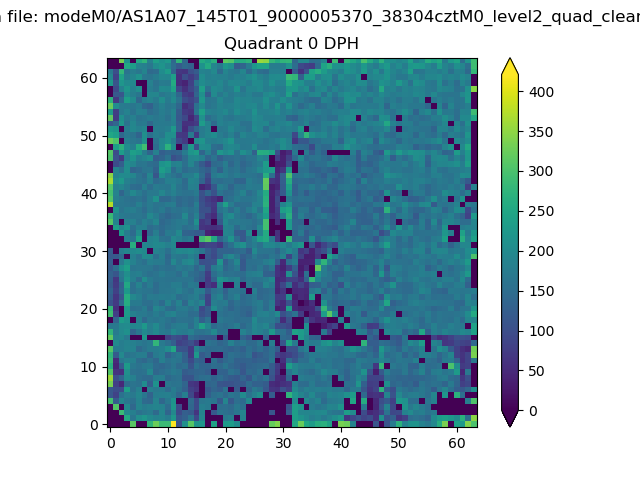 |
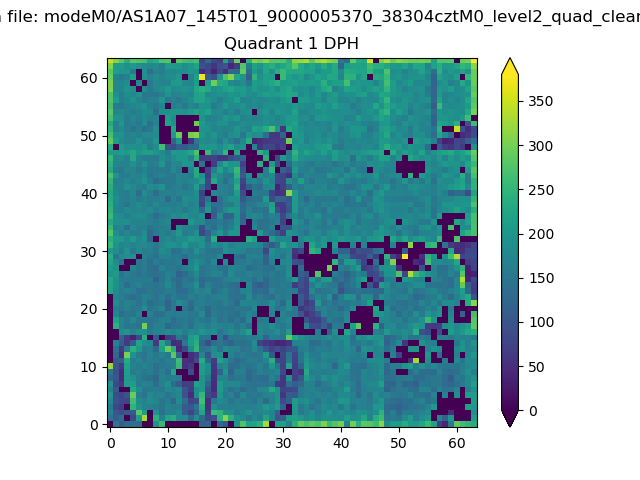 |
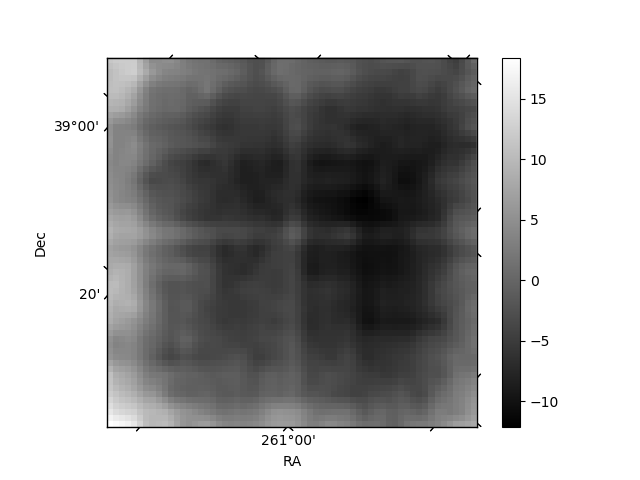
Quadrant B |
|---|---|---|---|
| Quadrant D | 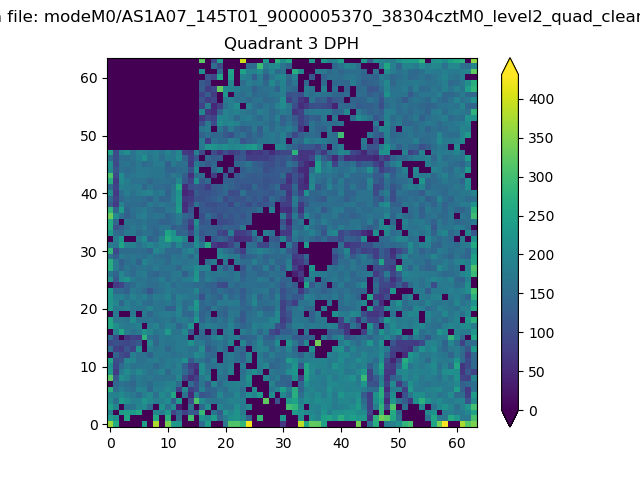 |
 |
Quadrant C |
| Plot type | Count rate plots | Images |
|---|---|---|
| Comparison with Poisson distribution Blue bars denote a histogram of data divided into 1 sec bins. Red curve is a Poisson curve with rate = median count rate of data. |
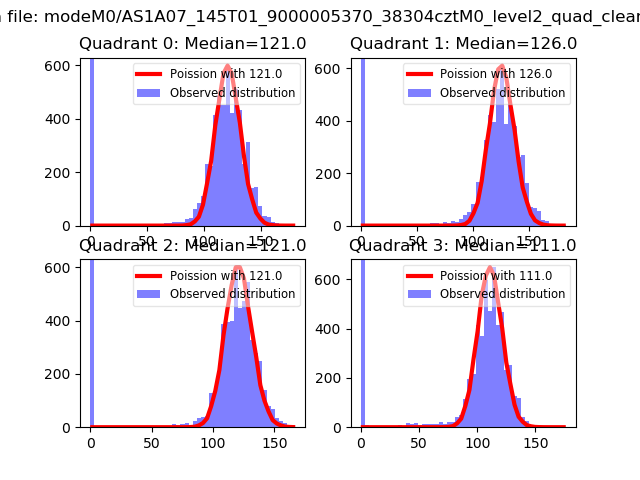 |
 |
| Quadrant-wise count rates Data is divided into 100 sec bins |
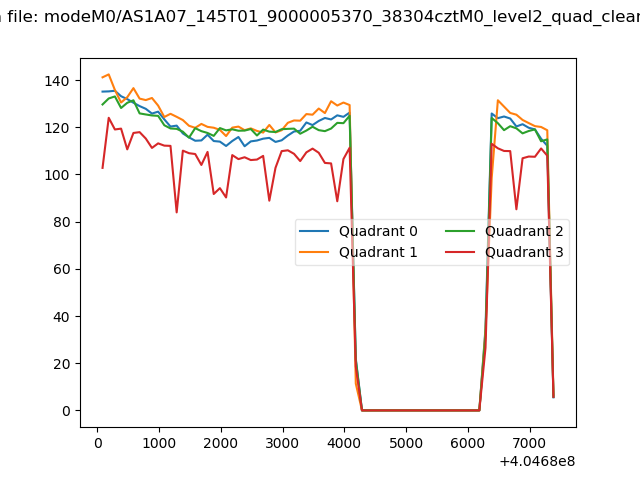 |
|
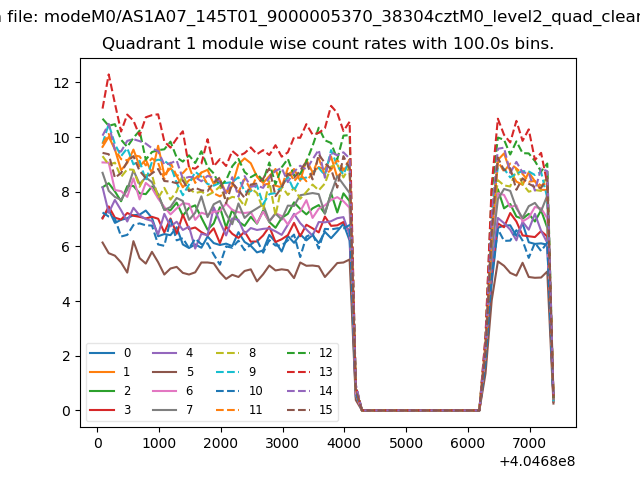
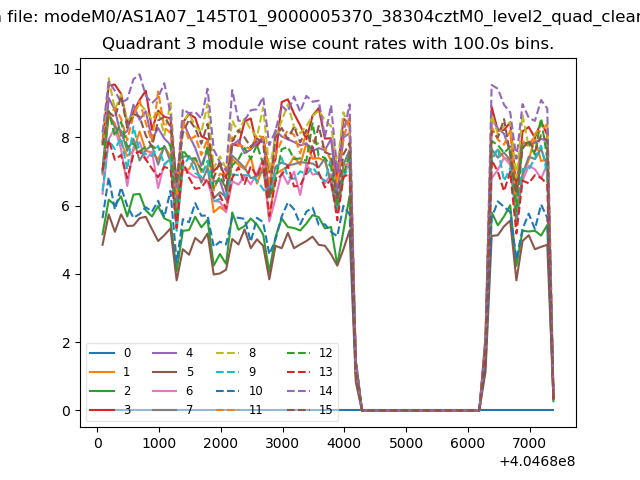
| Module-wise count rates for Quadrant A Data is divided into 100 sec bins |
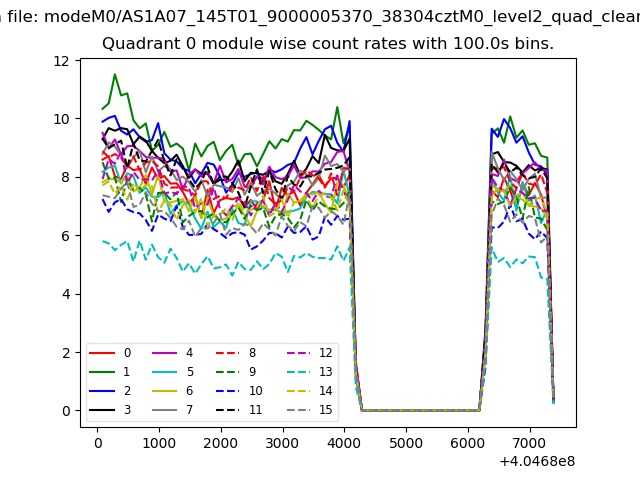 |
 |
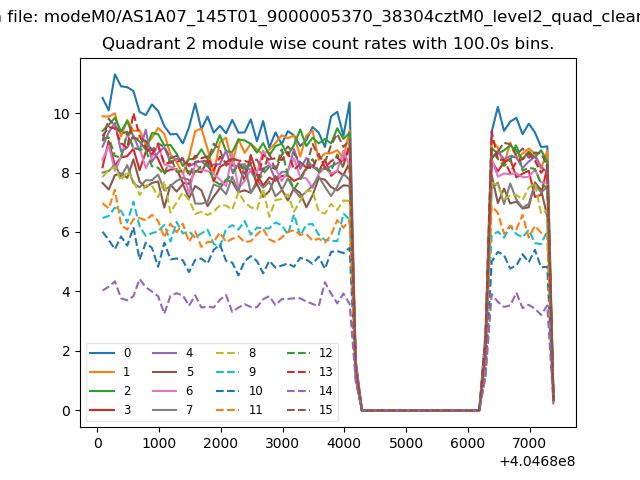
| Module-wise count rates for Quadrant B Data is divided into 100 sec bins |
 |
 |
| Module-wise count rates for Quadrant C Data is divided into 100 sec bins |
 |
 |
| Module-wise count rates for Quadrant D Data is divided into 100 sec bins |
 |
 |
| Parameter | Plot |
|---|---|
| CZT HV Monitor | 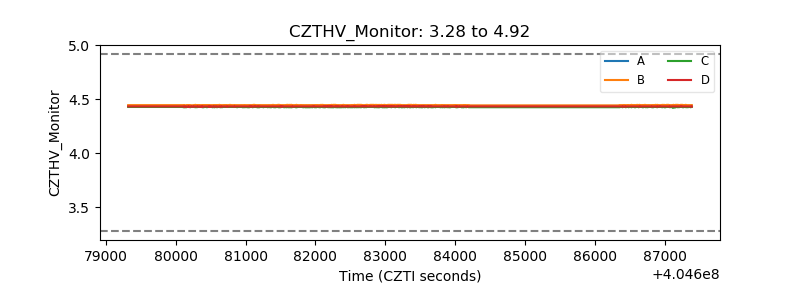 |
| D_VDD | 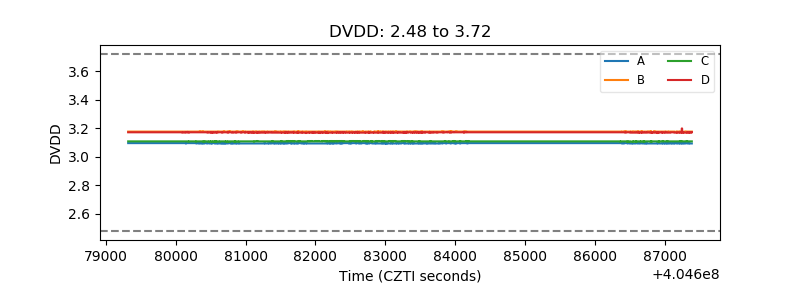 |
| Temperature 1 | 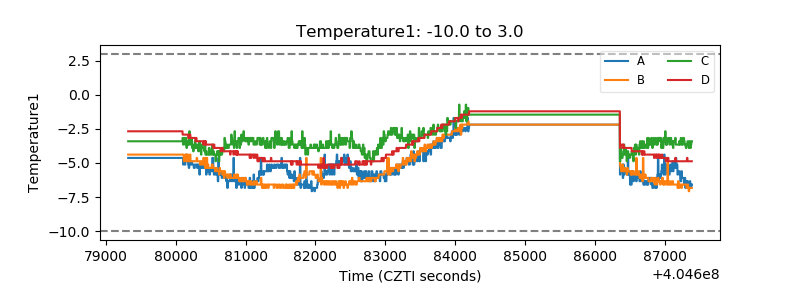 |
| Veto HV Monitor | 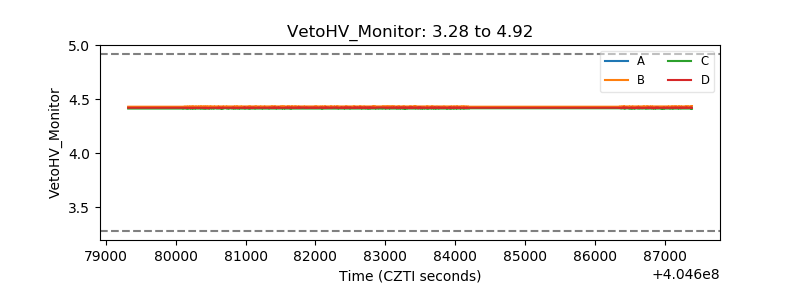 |
| Veto LLD | 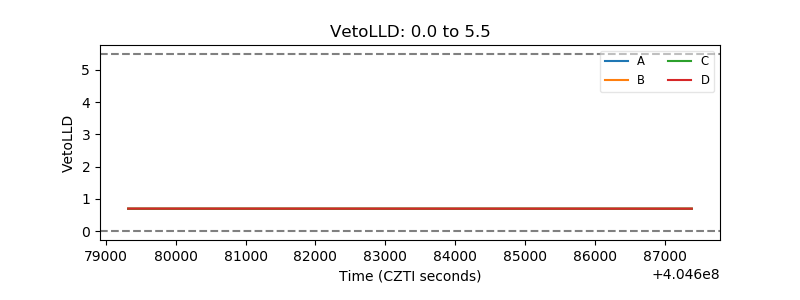 |
| Alpha Counter | 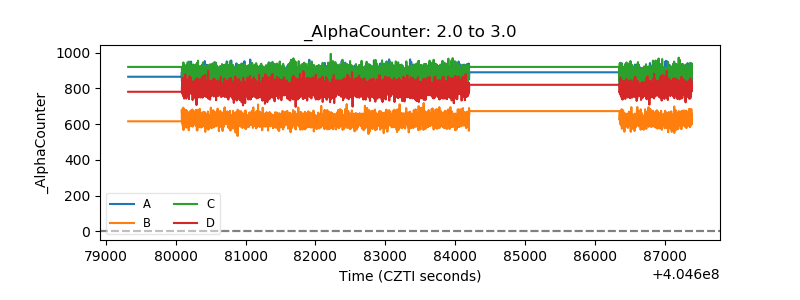 |
| _CPM_Rate |  |
| CZT Counter | 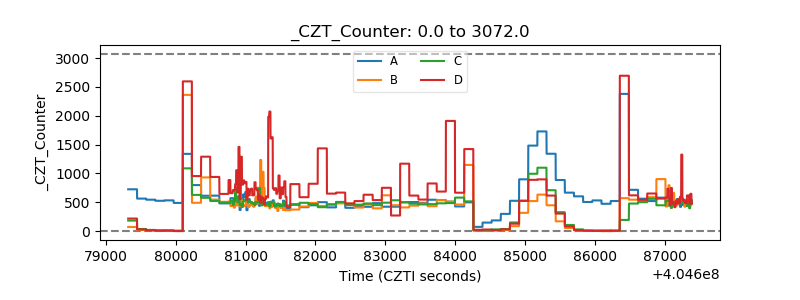 |
| +2.5 Volts monitor | 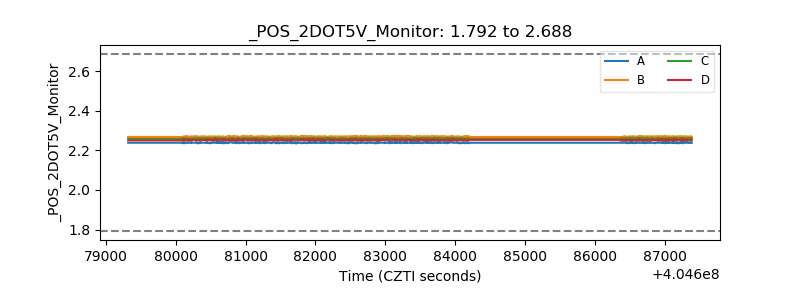 |
| +5 Volts monitor | 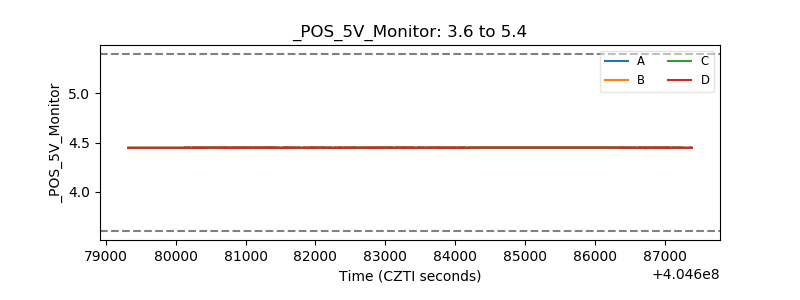 |
| _ROLL_ROT | 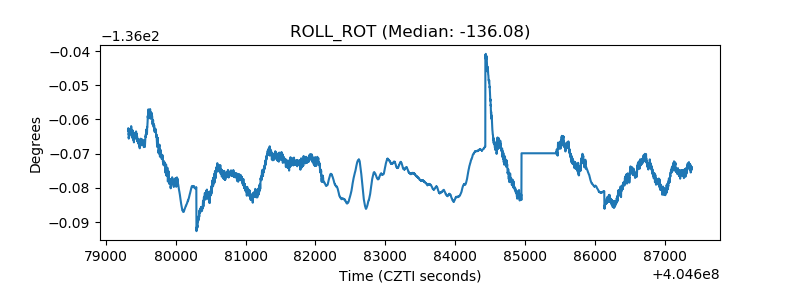 |
| _Roll_DEC | 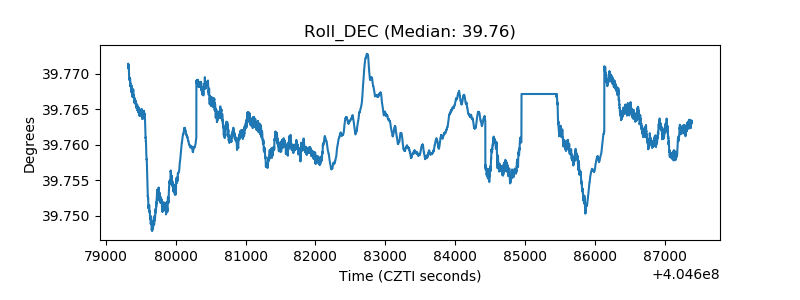 |
| _Roll_RA | 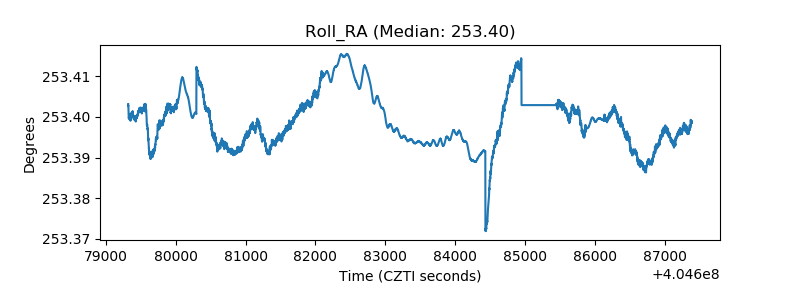 |
| Veto Counter | 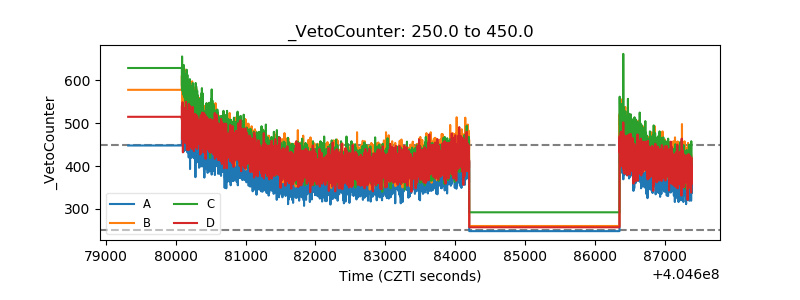 |