| Param | Original file | Final file |
|---|---|---|
| Filename | modeM0/AS1A07_145T01_9000005370_38305cztM0_level2.fits | modeM0/AS1A07_145T01_9000005370_38305cztM0_level2_quad_clean.evt |
| Size (bytes) | 274,250,880 | 73,895,040 |
| Size | 261.5 MB | 70.5 MB |
| Events in quadrant A | 2,174,269 | 494,698 |
| Events in quadrant B | 2,254,365 | 508,207 |
| Events in quadrant C | 2,185,412 | 495,366 |
| Events in quadrant D | 3,204,753 | 438,676 |
| Mode M9 | |||
|---|---|---|---|
| Quadrant | BADHDUFLAG | Total packets | Discarded packets |
| A | 0 | 20 | 0 |
| B | 0 | 20 | 0 |
| C | 0 | 20 | 0 |
| D | 0 | 21 | 0 |
| Mode SS | |||
|---|---|---|---|
| Quadrant | BADHDUFLAG | Total packets | Discarded packets |
| A | 0 | 88 | 0 |
| B | 0 | 88 | 0 |
| C | 0 | 88 | 0 |
| D | 0 | 88 | 0 |
| Mode M0 | |||
|---|---|---|---|
| Quadrant | BADHDUFLAG | Total packets | Discarded packets |
| A | 0 | 8976 | 1 |
| B | 0 | 9431 | 1 |
| C | 0 | 9027 | 1 |
| D | 0 | 12333 | 1 |
| Quadrant | Total seconds | Saturated seconds | Saturation percentage |
|---|---|---|---|
| A | 4267 | 5 | 0.117178% |
| B | 4267 | 62 | 1.453011% |
| C | 4267 | 17 | 0.398406% |
| D | 4267 | 230 | 5.390204% |
Noise dominated data is calculated using 1-second bins in cleaned event files. If a bin has >2000 counts, and if more than 50% of those come from <1% of pixels, then it is considered to be noise-dominated and hence unusable.
| Quadrant | # 1 sec bins | Bins with >0 counts | Bins with >2000 counts | High rate bins dominated by noise | Noise dominated (total time) | Noise dominated (detector-on time) | Marked lightcurve |
|---|---|---|---|---|---|---|---|
| A | 4267 | 4267 | 3 | 3 | 0.07% | 0.07% | 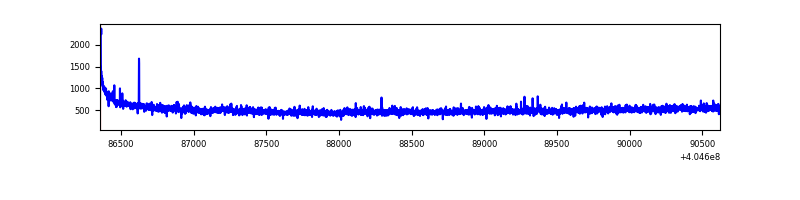 |
| B | 4267 | 4267 | 37 | 37 | 0.87% | 0.87% | 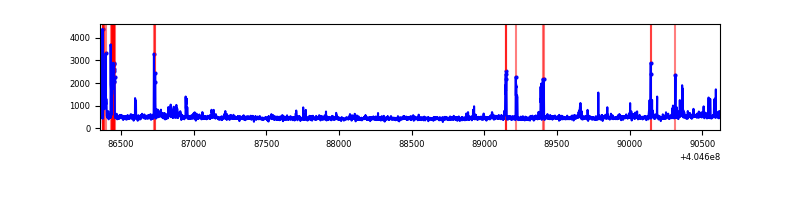 |
| C | 4267 | 4267 | 16 | 16 | 0.37% | 0.37% | 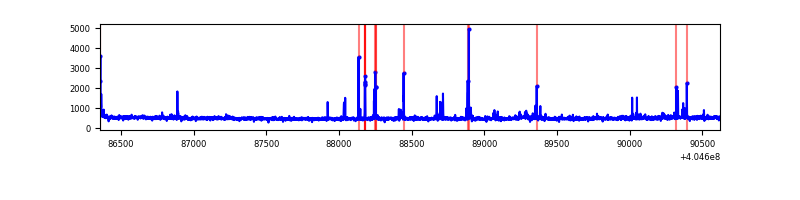 |
| D | 4267 | 4267 | 181 | 181 | 4.24% | 4.24% | 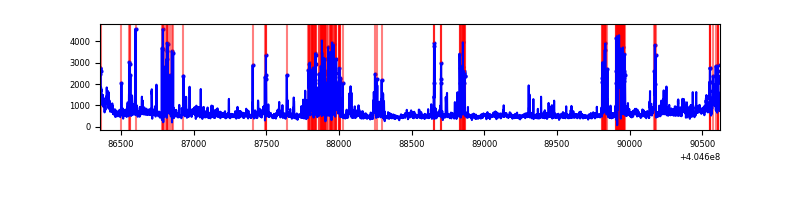 |
Top three noisy pixels from each quadrant. If the there are fewer than three noisy pixels in the level2.evt file, extra rows are filled as -1
| Pixel properties | Quadrant properties | ||||||
|---|---|---|---|---|---|---|---|
| Quadrant | DetID | PixID | Counts | Sigma | Mean | Median | Sigma |
| A | 10 | 83 | 261126 | 2664.01 | 479 | 469 | 97.8 |
| A | 12 | 189 | 35023 | 353.15 | 479 | 469 | 97.8 |
| A | 13 | 6 | 12031 | 118.17 | 479 | 469 | 97.8 |
| B | 5 | 184 | 118936 | 1271.34 | 477 | 464 | 93.2 |
| B | 5 | 172 | 97711 | 1043.57 | 477 | 464 | 93.2 |
| B | 0 | 213 | 69467 | 740.48 | 477 | 464 | 93.2 |
| C | 15 | 214 | 176163 | 1601.1 | 470 | 473 | 109.7 |
| C | 14 | 254 | 95569 | 866.63 | 470 | 473 | 109.7 |
| C | 15 | 208 | 33406 | 300.13 | 470 | 473 | 109.7 |
| D | 2 | 16 | 615641 | 5482.67 | 459 | 447 | 112.2 |
| D | 13 | 138 | 554065 | 4933.9 | 459 | 447 | 112.2 |
| D | 13 | 249 | 110530 | 981.07 | 459 | 447 | 112.2 |
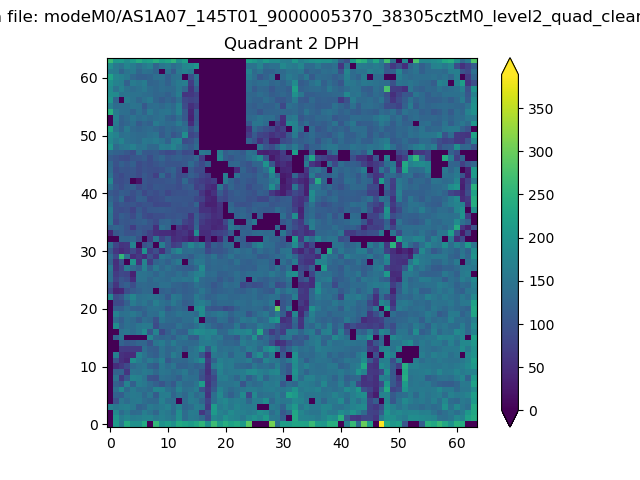
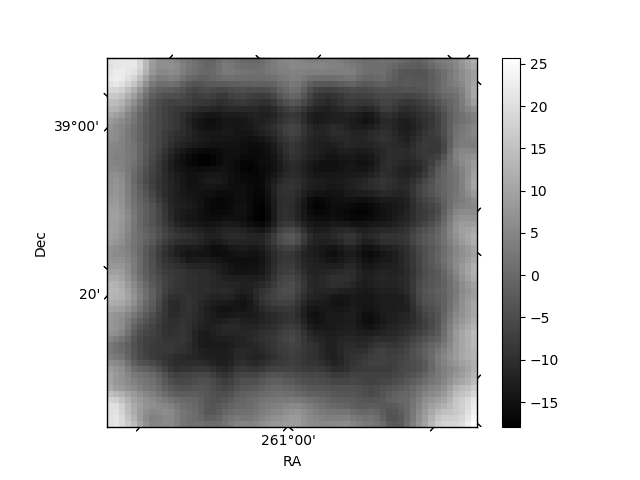
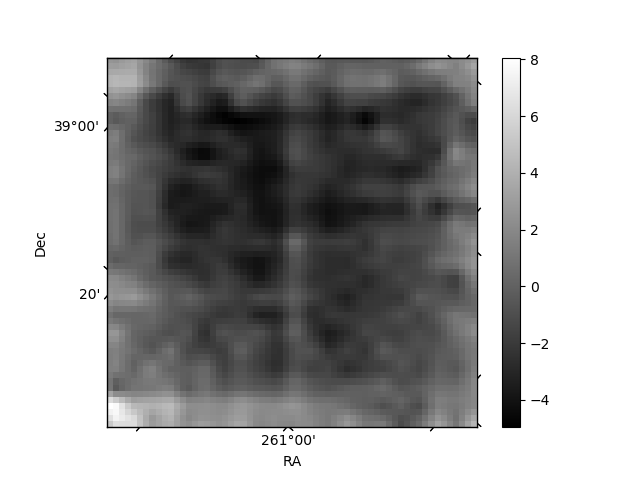
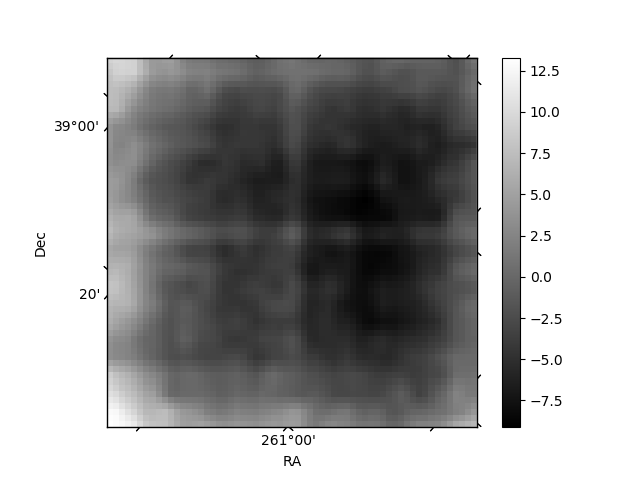
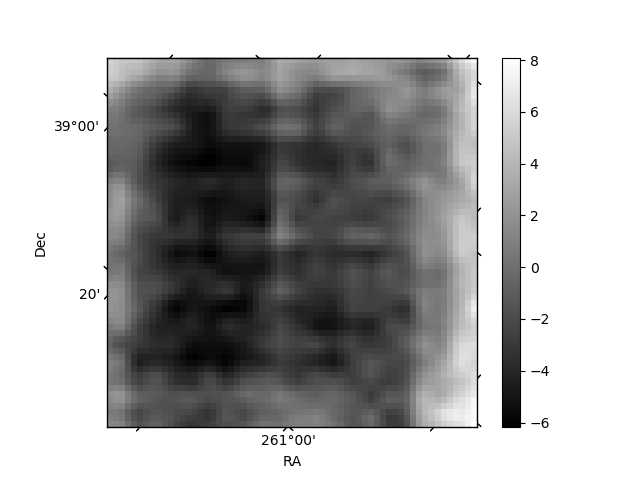
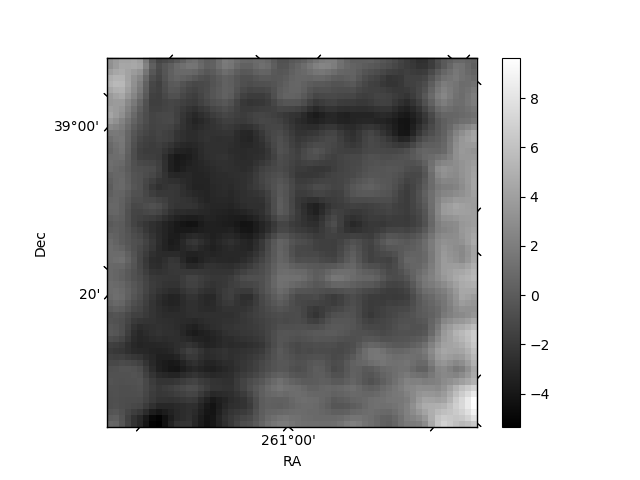
Histogram calculated using DETX and DETY for each event in the final _common_clean file
| Quadrant A | 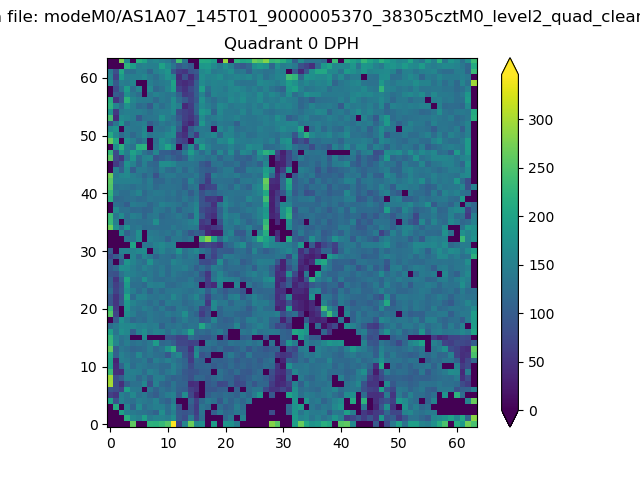 |
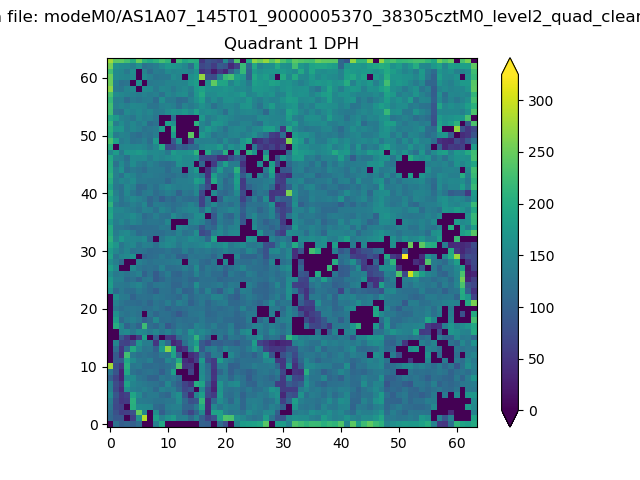 |
Quadrant B |
|---|---|---|---|
| Quadrant D | 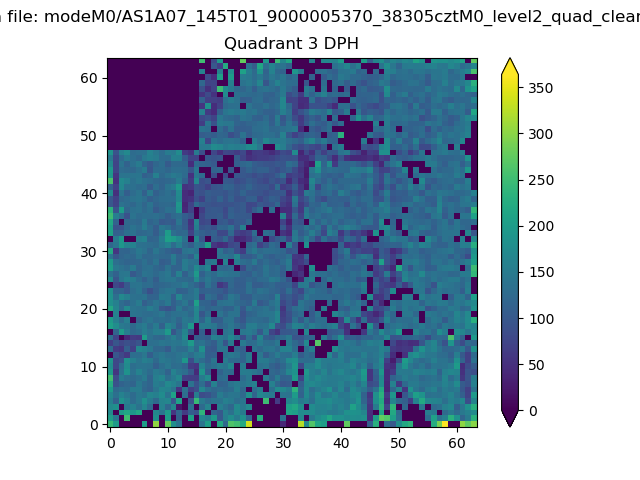 |
 |
Quadrant C |
| Plot type | Count rate plots | Images |
|---|---|---|
| Comparison with Poisson distribution Blue bars denote a histogram of data divided into 1 sec bins. Red curve is a Poisson curve with rate = median count rate of data. |
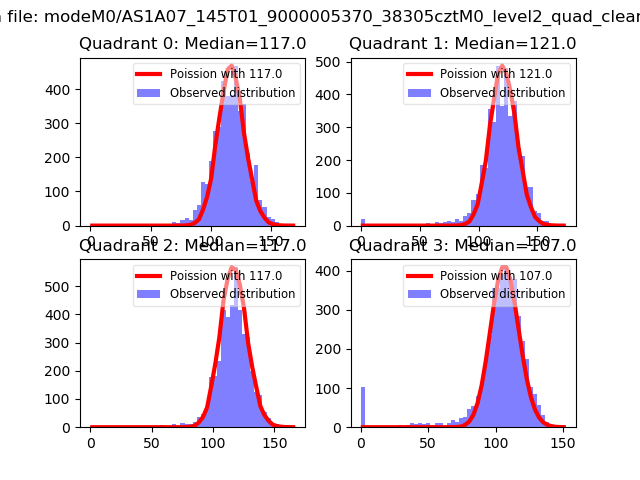 |
 |
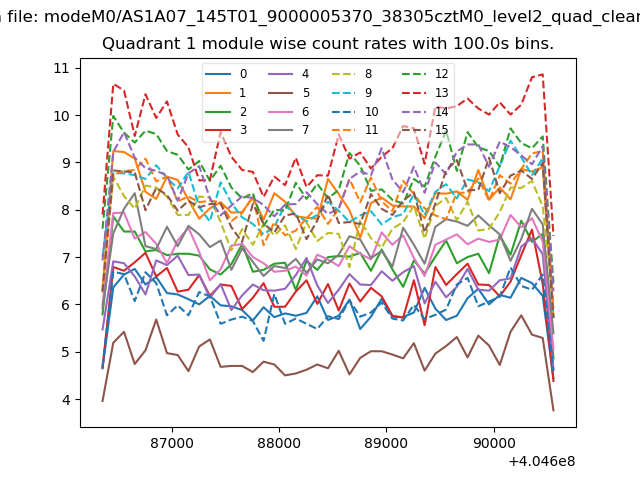
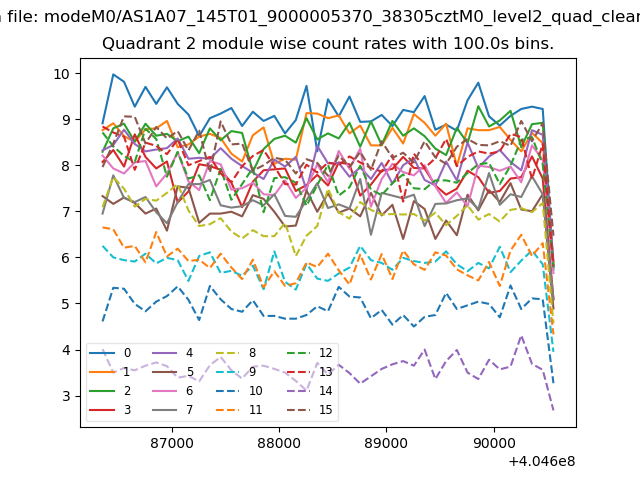
| Quadrant-wise count rates Data is divided into 100 sec bins |
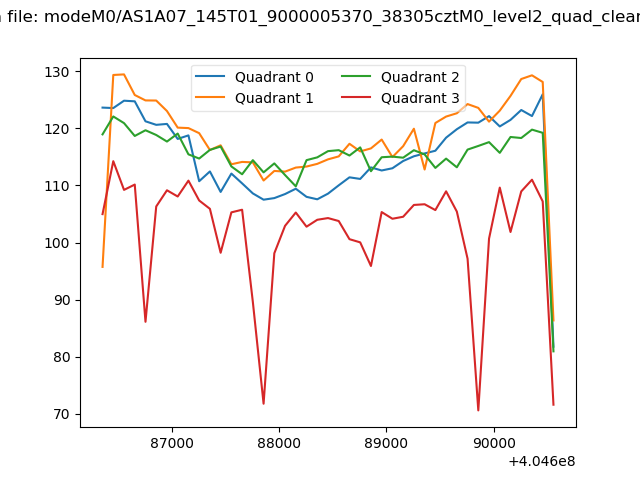 |
|
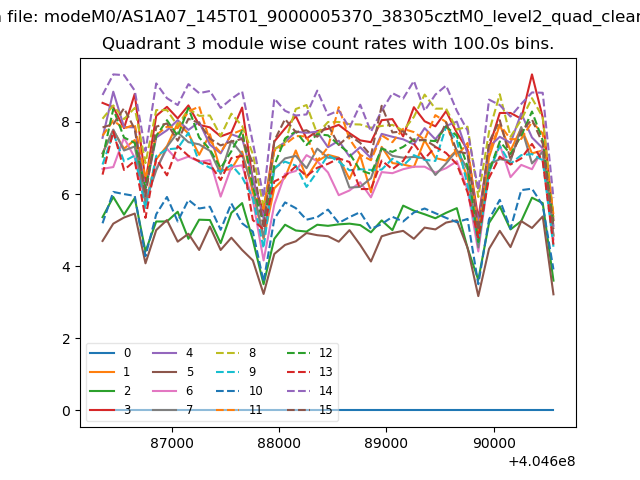
| Module-wise count rates for Quadrant A Data is divided into 100 sec bins |
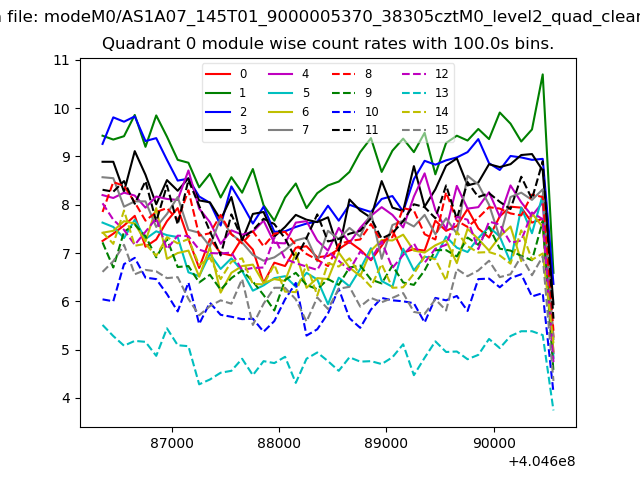 |
 |
| Module-wise count rates for Quadrant B Data is divided into 100 sec bins |
 |
 |
| Module-wise count rates for Quadrant C Data is divided into 100 sec bins |
 |
 |
| Module-wise count rates for Quadrant D Data is divided into 100 sec bins |
 |
 |
| Parameter | Plot |
|---|---|
| CZT HV Monitor | 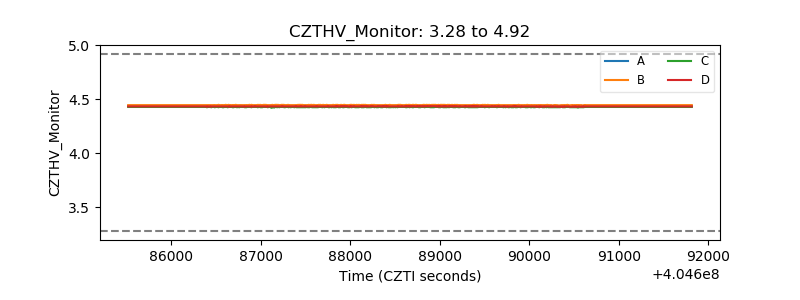 |
| D_VDD | 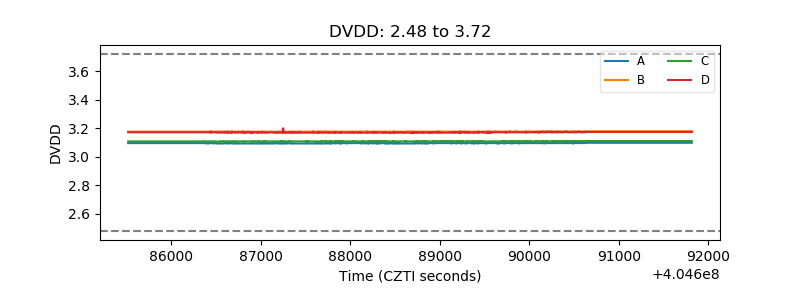 |
| Temperature 1 | 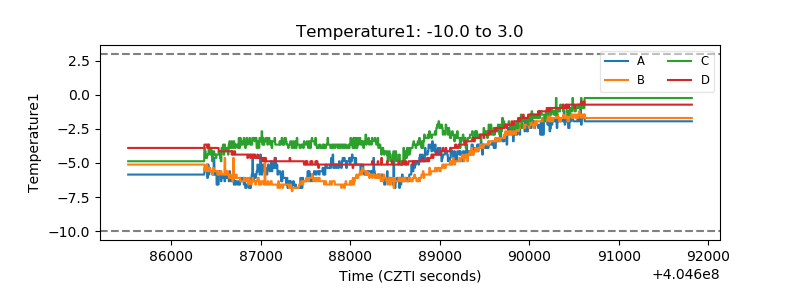 |
| Veto HV Monitor | 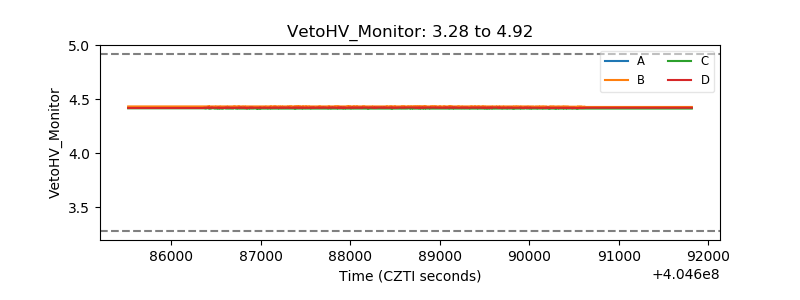 |
| Veto LLD | 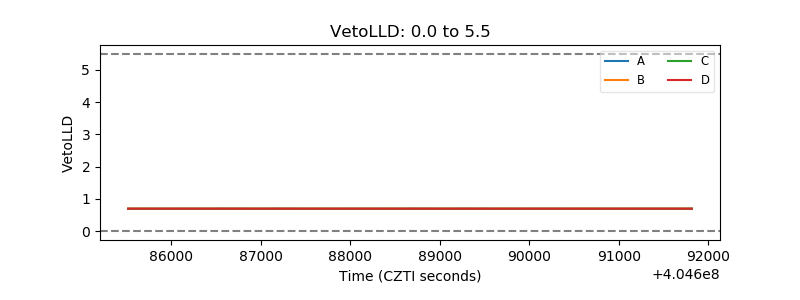 |
| Alpha Counter | 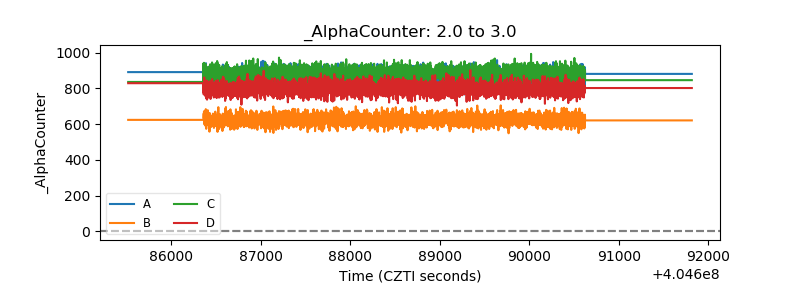 |
| _CPM_Rate | 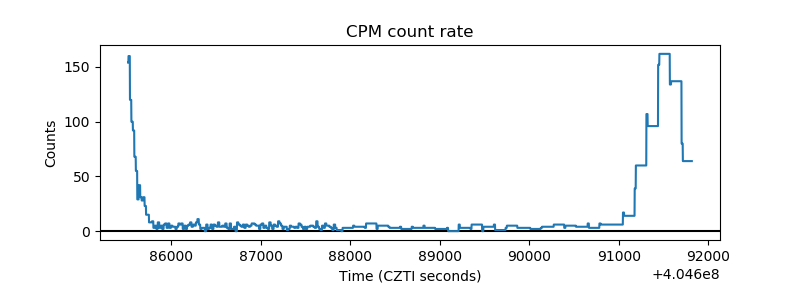 |
| CZT Counter | 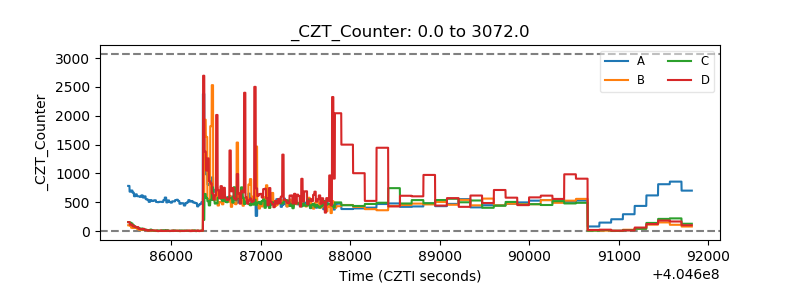 |
| +2.5 Volts monitor | 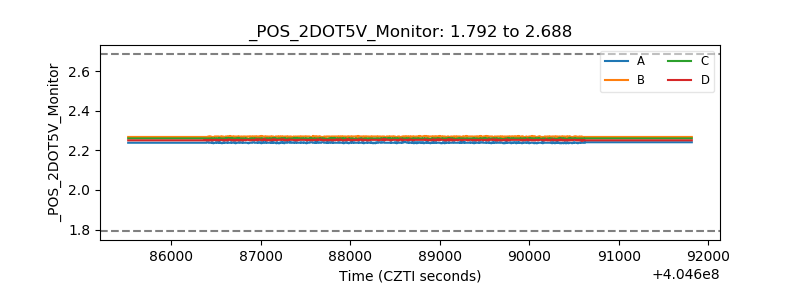 |
| +5 Volts monitor | 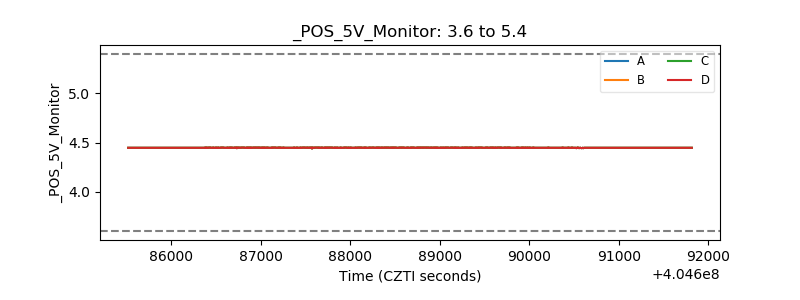 |
| _ROLL_ROT | 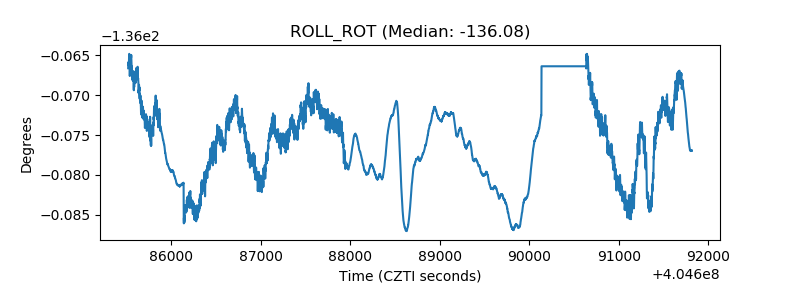 |
| _Roll_DEC | 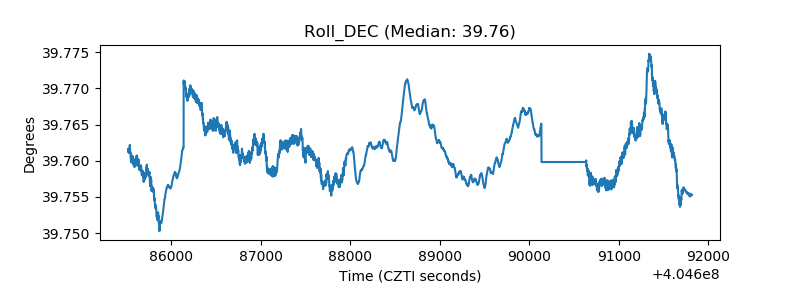 |
| _Roll_RA | 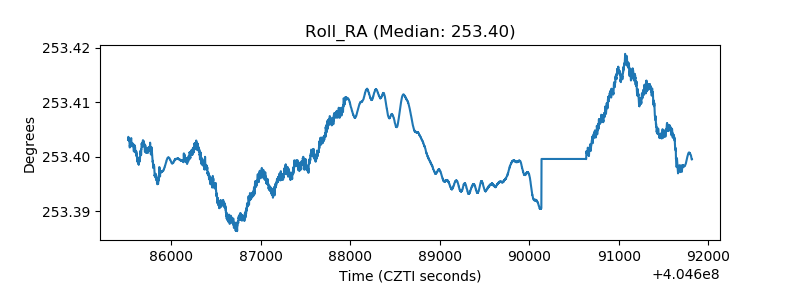 |
| Veto Counter | 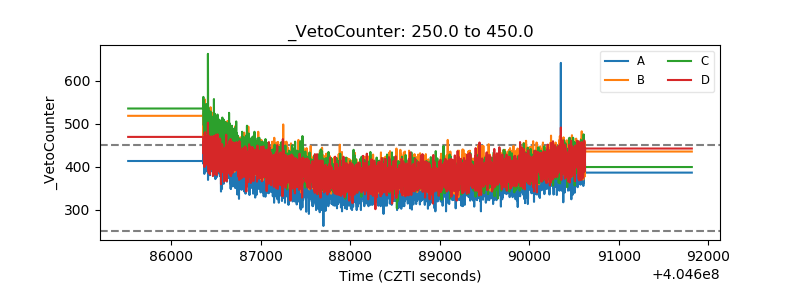 |