| Param | Original file | Final file |
|---|---|---|
| Filename | modeM0/AS1C07_001T12_9000005372_38305cztM0_level2.fits | modeM0/AS1C07_001T12_9000005372_38305cztM0_level2_quad_clean.evt |
| Size (bytes) | 66,113,280 | 13,285,440 |
| Size | 63.1 MB | 12.7 MB |
| Events in quadrant A | 463,095 | 92,679 |
| Events in quadrant B | 770,679 | 77,447 |
| Events in quadrant C | 407,751 | 90,953 |
| Events in quadrant D | 740,059 | 78,150 |
| Mode SS | |||
|---|---|---|---|
| Quadrant | BADHDUFLAG | Total packets | Discarded packets |
| A | 0 | 16 | 0 |
| B | 0 | 16 | 0 |
| C | 0 | 16 | 0 |
| D | 0 | 16 | 0 |
| Mode M9 | |||
|---|---|---|---|
| Quadrant | BADHDUFLAG | Total packets | Discarded packets |
| A | 0 | 2 | 0 |
| B | 0 | 2 | 0 |
| C | 0 | 2 | 0 |
| D | 0 | 2 | 0 |
| Mode M0 | |||
|---|---|---|---|
| Quadrant | BADHDUFLAG | Total packets | Discarded packets |
| A | 0 | 1859 | 2 |
| B | 0 | 2829 | 1 |
| C | 0 | 1683 | 1 |
| D | 0 | 2745 | 1 |
| Quadrant | Total seconds | Saturated seconds | Saturation percentage |
|---|---|---|---|
| A | 803 | 6 | 0.747198% |
| B | 803 | 166 | 20.672478% |
| C | 803 | 4 | 0.498132% |
| D | 803 | 78 | 9.713574% |
Noise dominated data is calculated using 1-second bins in cleaned event files. If a bin has >2000 counts, and if more than 50% of those come from <1% of pixels, then it is considered to be noise-dominated and hence unusable.
| Quadrant | # 1 sec bins | Bins with >0 counts | Bins with >2000 counts | High rate bins dominated by noise | Noise dominated (total time) | Noise dominated (detector-on time) | Marked lightcurve |
|---|---|---|---|---|---|---|---|
| A | 803 | 803 | 3 | 3 | 0.37% | 0.37% | 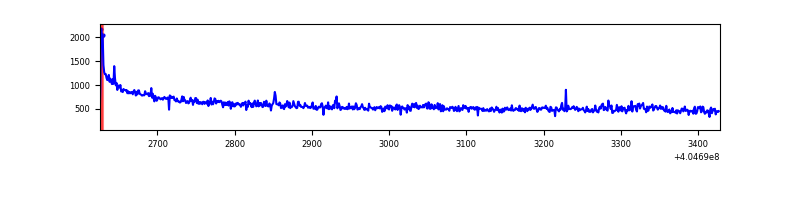 |
| B | 803 | 803 | 115 | 115 | 14.32% | 14.32% | 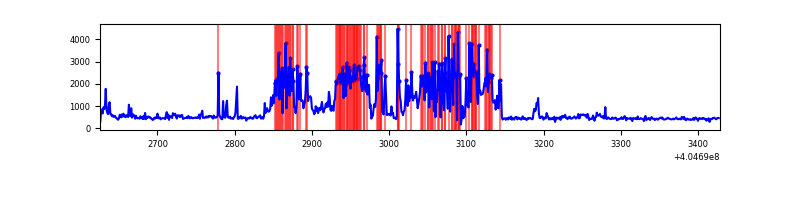 |
| C | 803 | 803 | 2 | 2 | 0.25% | 0.25% | 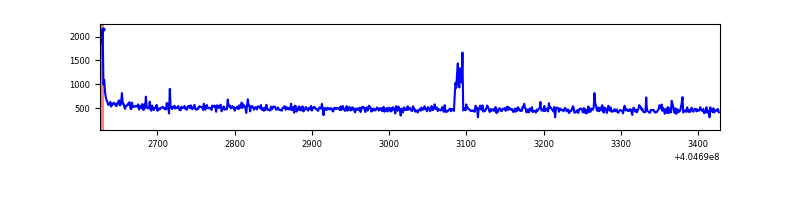 |
| D | 803 | 803 | 71 | 71 | 8.84% | 8.84% | 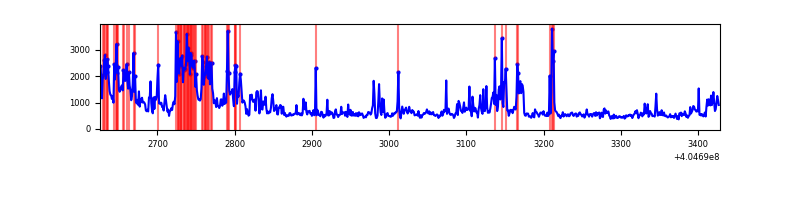 |
Top three noisy pixels from each quadrant. If the there are fewer than three noisy pixels in the level2.evt file, extra rows are filled as -1
| Pixel properties | Quadrant properties | ||||||
|---|---|---|---|---|---|---|---|
| Quadrant | DetID | PixID | Counts | Sigma | Mean | Median | Sigma |
| A | 10 | 83 | 106613 | 5452.66 | 87 | 85 | 19.5 |
| A | 12 | 189 | 13115 | 666.94 | 87 | 85 | 19.5 |
| A | 13 | 6 | 2695 | 133.59 | 87 | 85 | 19.5 |
| B | 5 | 184 | 389622 | 22185.88 | 81 | 79 | 17.6 |
| B | 5 | 172 | 27967 | 1588.32 | 81 | 79 | 17.6 |
| B | 0 | 183 | 16723 | 947.94 | 81 | 79 | 17.6 |
| C | 15 | 214 | 38160 | 1674.59 | 88 | 88 | 22.7 |
| C | 0 | 10 | 12012 | 524.48 | 88 | 88 | 22.7 |
| C | 14 | 254 | 10617 | 463.12 | 88 | 88 | 22.7 |
| D | 7 | 223 | 199645 | 8849.15 | 84 | 80 | 22.6 |
| D | 2 | 16 | 108234 | 4795.79 | 84 | 80 | 22.6 |
| D | 10 | 118 | 34350 | 1519.61 | 84 | 80 | 22.6 |
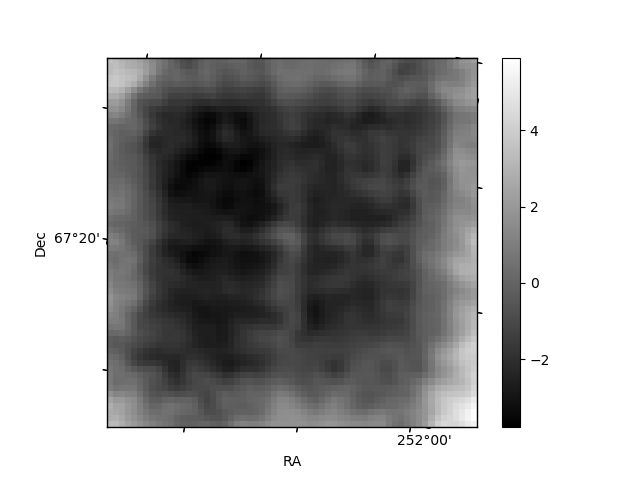
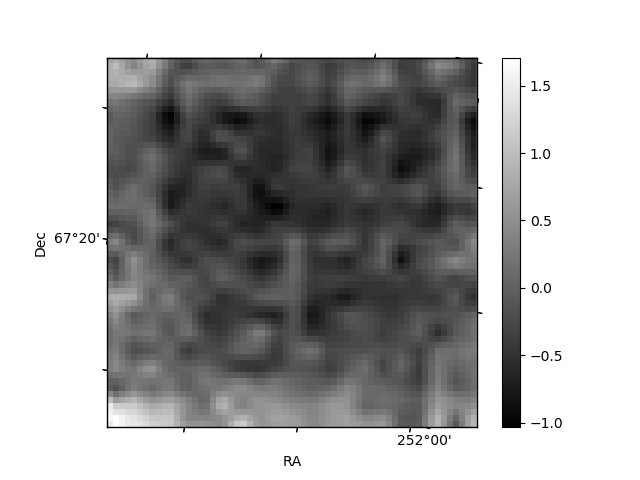
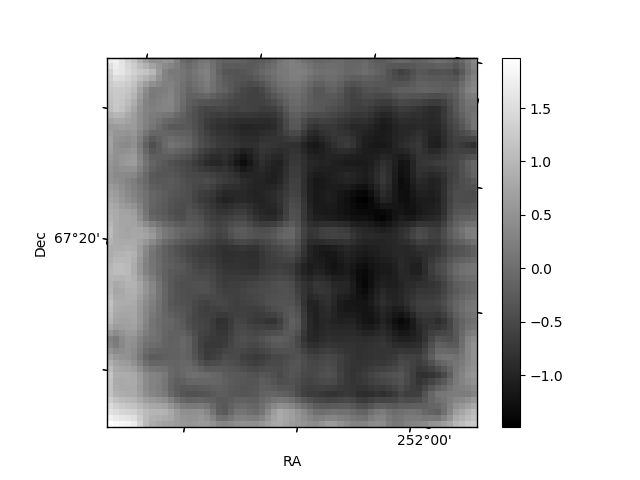
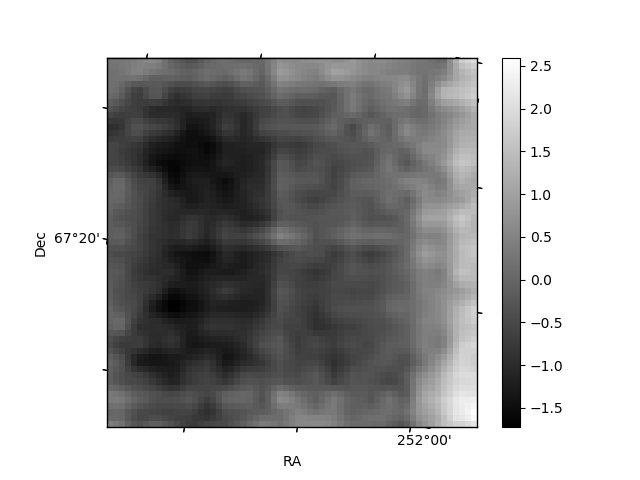
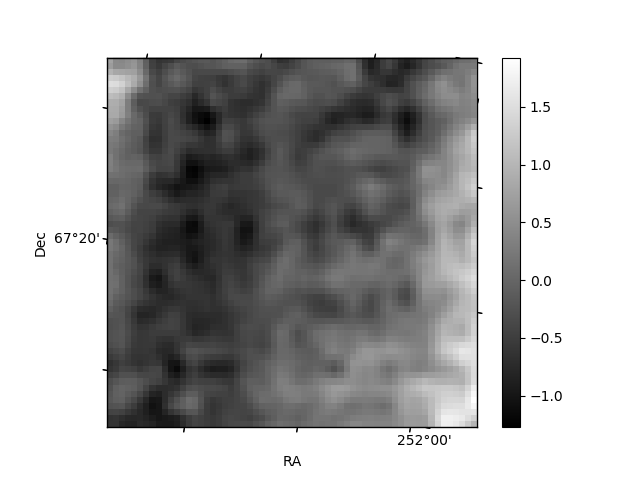
Histogram calculated using DETX and DETY for each event in the final _common_clean file
| Quadrant A | 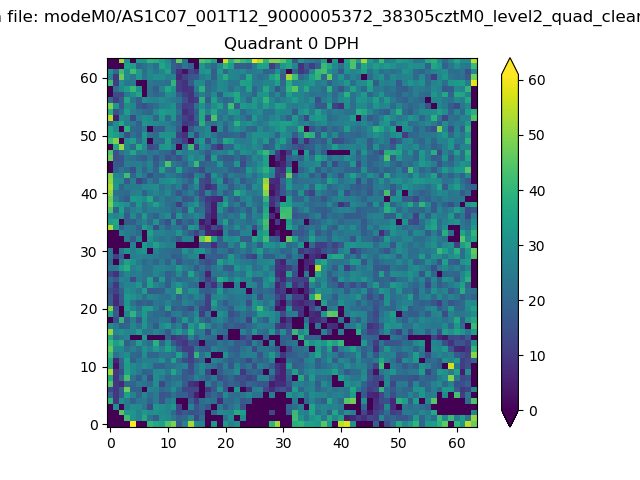 |
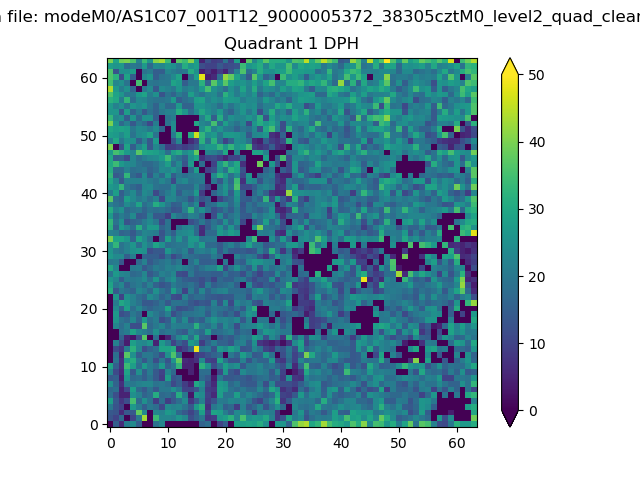 |
Quadrant B |
|---|---|---|---|
| Quadrant D | 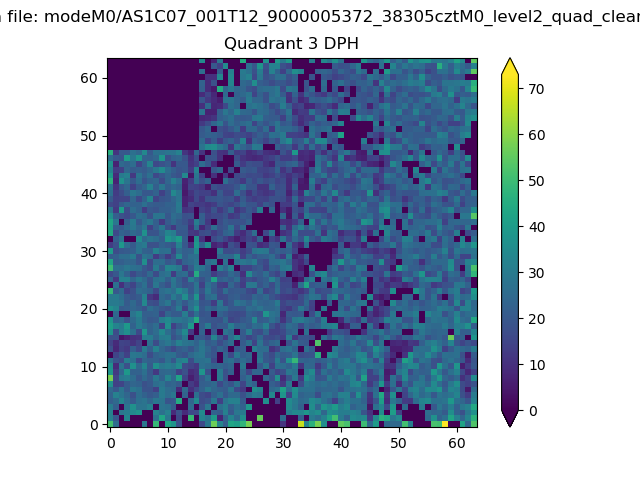 |
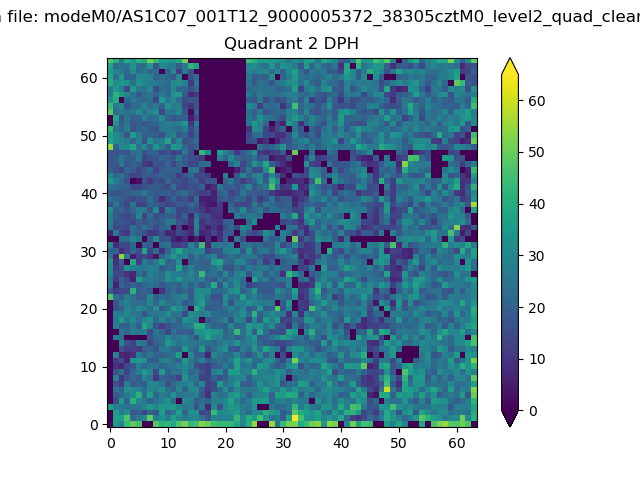 |
Quadrant C |
| Plot type | Count rate plots | Images |
|---|---|---|
| Comparison with Poisson distribution Blue bars denote a histogram of data divided into 1 sec bins. Red curve is a Poisson curve with rate = median count rate of data. |
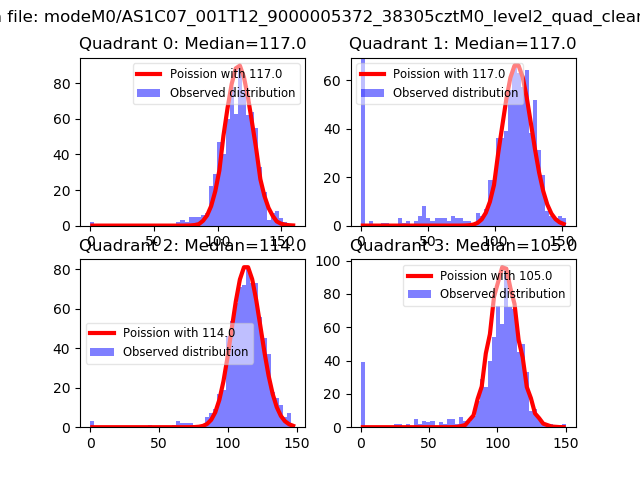 |
 |
| Quadrant-wise count rates Data is divided into 100 sec bins |
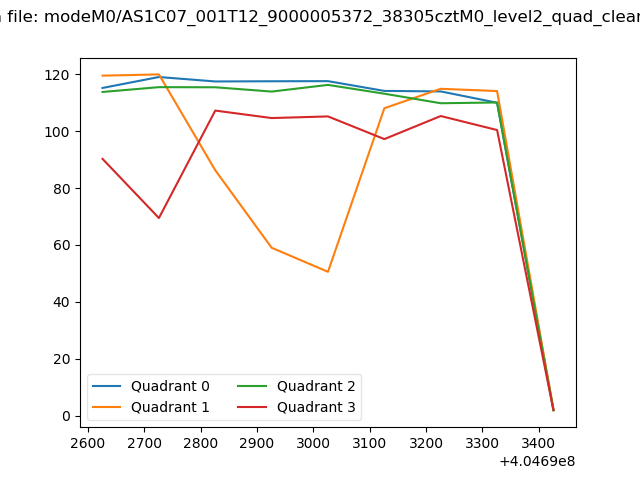 |
|
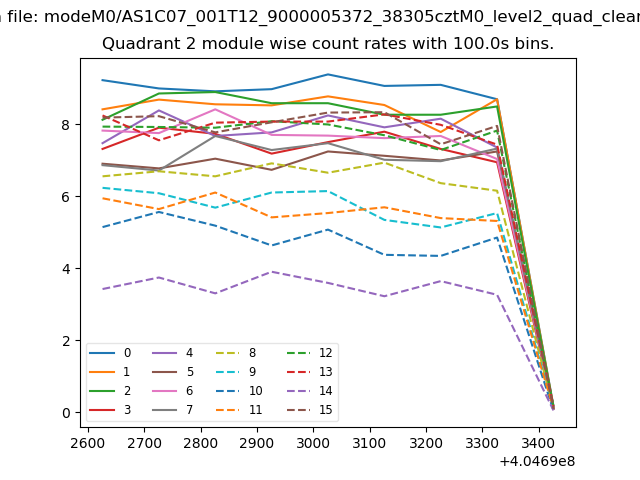
| Module-wise count rates for Quadrant A Data is divided into 100 sec bins |
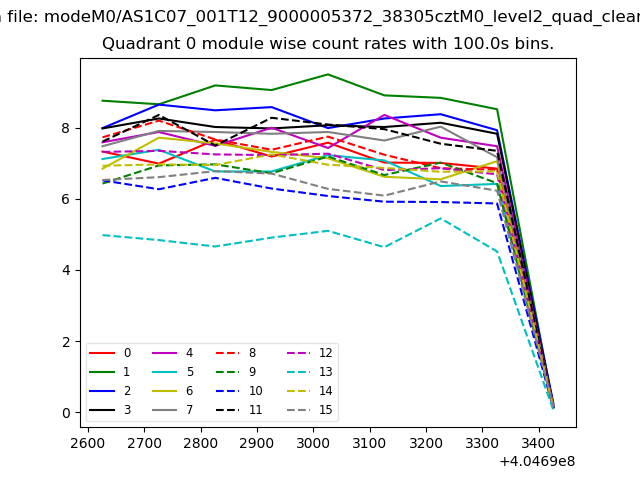 |
 |
| Module-wise count rates for Quadrant B Data is divided into 100 sec bins |
 |
 |
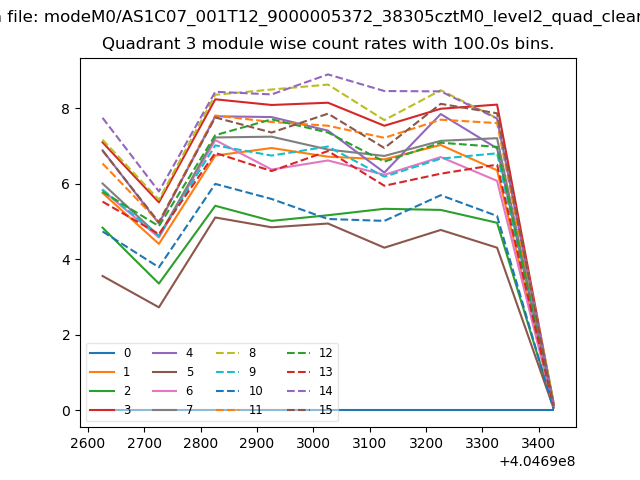
| Module-wise count rates for Quadrant C Data is divided into 100 sec bins |
 |
 |
| Module-wise count rates for Quadrant D Data is divided into 100 sec bins |
 |
 |
| Parameter | Plot |
|---|---|
| CZT HV Monitor | 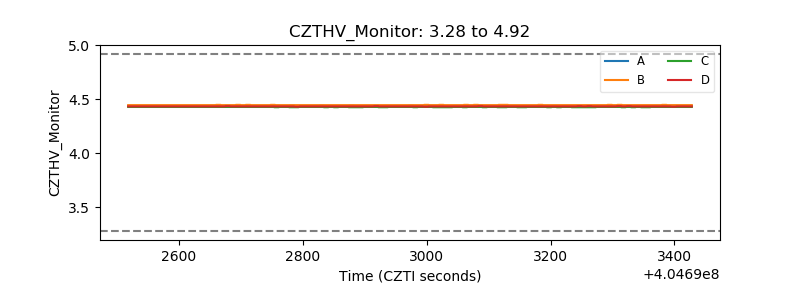 |
| D_VDD | 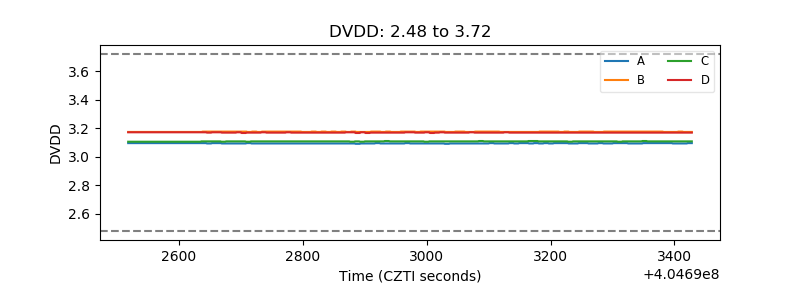 |
| Temperature 1 | 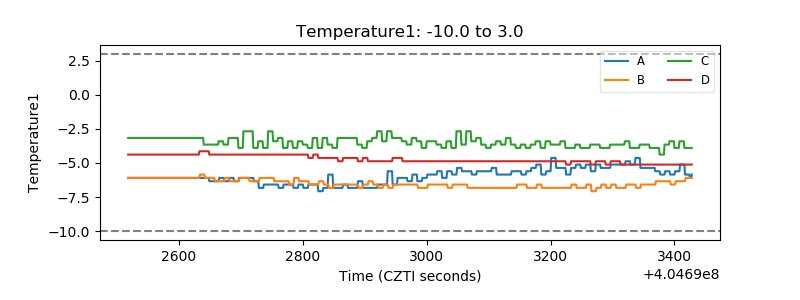 |
| Veto HV Monitor | 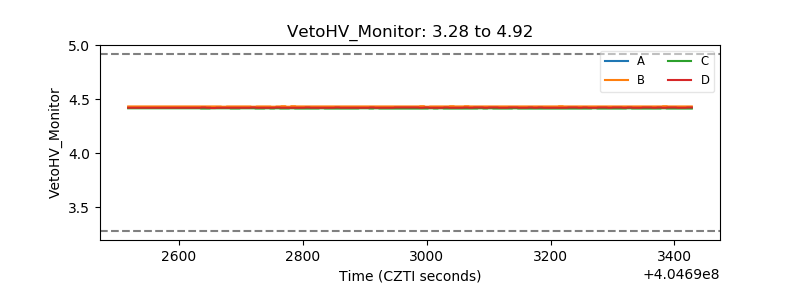 |
| Veto LLD | 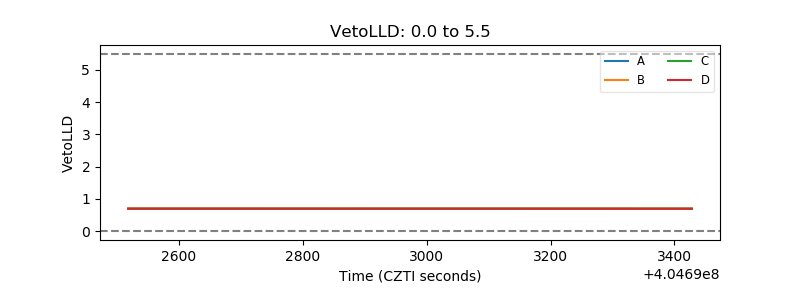 |
| Alpha Counter | 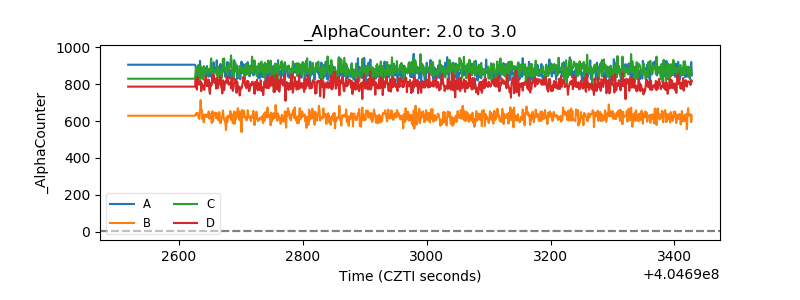 |
| _CPM_Rate | 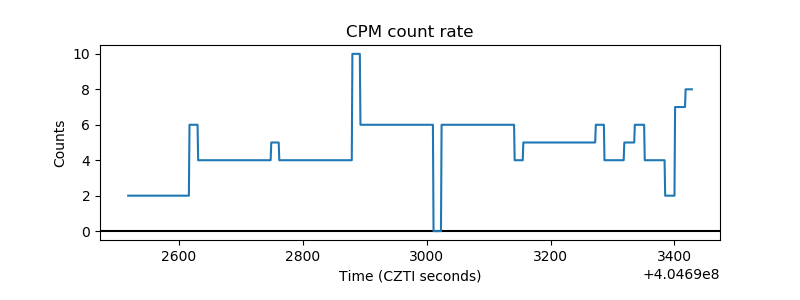 |
| CZT Counter | 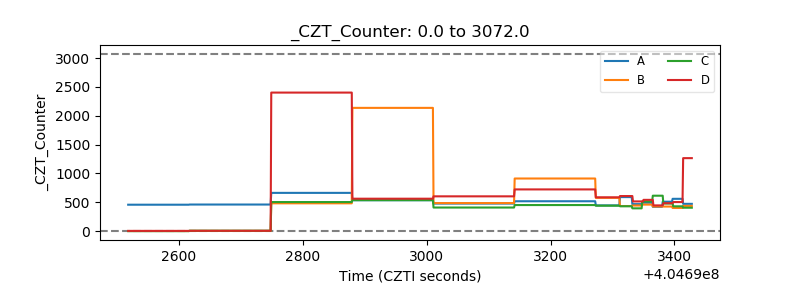 |
| +2.5 Volts monitor | 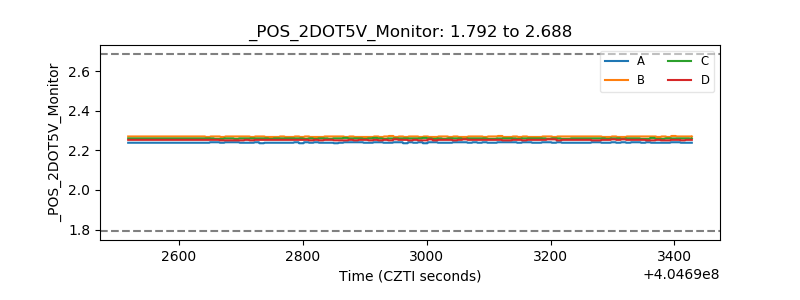 |
| +5 Volts monitor | 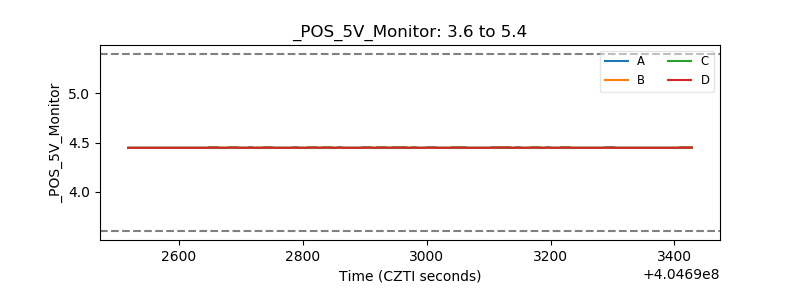 |
| _ROLL_ROT | 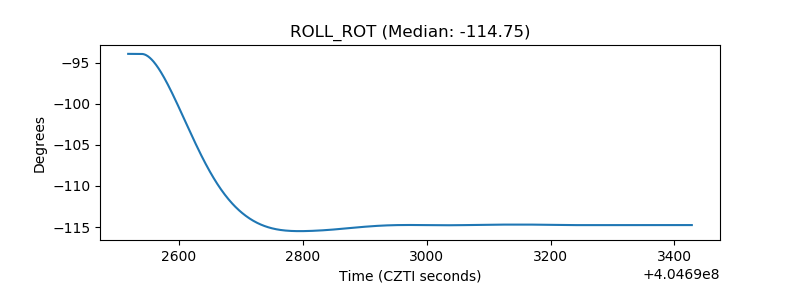 |
| _Roll_DEC | 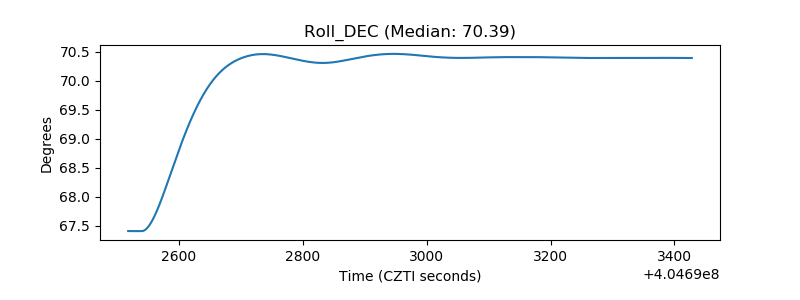 |
| _Roll_RA | 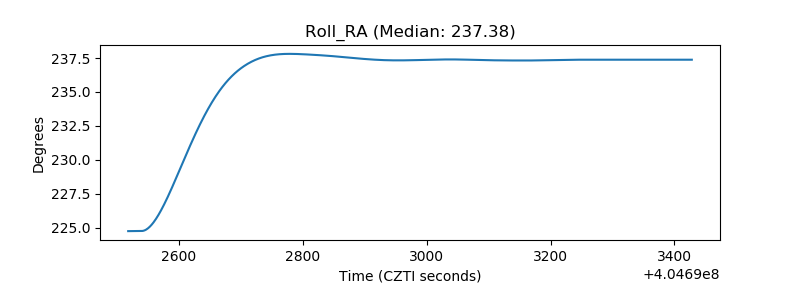 |
| Veto Counter | 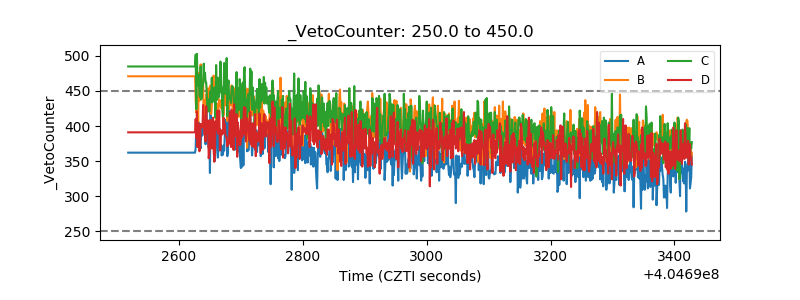 |