| Param | Original file | Final file |
|---|---|---|
| Filename | modeM0/AS1C07_001T12_9000005372_38306cztM0_level2.fits | modeM0/AS1C07_001T12_9000005372_38306cztM0_level2_quad_clean.evt |
| Size (bytes) | 416,805,120 | 92,056,320 |
| Size | 397.5 MB | 87.8 MB |
| Events in quadrant A | 2,898,861 | 631,593 |
| Events in quadrant B | 3,507,357 | 615,507 |
| Events in quadrant C | 3,098,034 | 623,711 |
| Events in quadrant D | 5,484,938 | 521,372 |
| Mode SS | |||
|---|---|---|---|
| Quadrant | BADHDUFLAG | Total packets | Discarded packets |
| A | 0 | 114 | 0 |
| B | 0 | 114 | 0 |
| C | 0 | 114 | 0 |
| D | 0 | 114 | 0 |
| Mode M9 | |||
|---|---|---|---|
| Quadrant | BADHDUFLAG | Total packets | Discarded packets |
| A | 0 | 19 | 0 |
| B | 0 | 19 | 0 |
| C | 0 | 19 | 0 |
| D | 0 | 19 | 0 |
| Mode M0 | |||
|---|---|---|---|
| Quadrant | BADHDUFLAG | Total packets | Discarded packets |
| A | 0 | 12142 | 3 |
| B | 0 | 14502 | 2 |
| C | 0 | 12867 | 2 |
| D | 0 | 20196 | 2 |
| Quadrant | Total seconds | Saturated seconds | Saturation percentage |
|---|---|---|---|
| A | 5652 | 22 | 0.389243% |
| B | 5652 | 298 | 5.272470% |
| C | 5652 | 59 | 1.043878% |
| D | 5652 | 695 | 12.296532% |
Noise dominated data is calculated using 1-second bins in cleaned event files. If a bin has >2000 counts, and if more than 50% of those come from <1% of pixels, then it is considered to be noise-dominated and hence unusable.
| Quadrant | # 1 sec bins | Bins with >0 counts | Bins with >2000 counts | High rate bins dominated by noise | Noise dominated (total time) | Noise dominated (detector-on time) | Marked lightcurve |
|---|---|---|---|---|---|---|---|
| A | 7324 | 5653 | 13 | 13 | 0.18% | 0.23% | 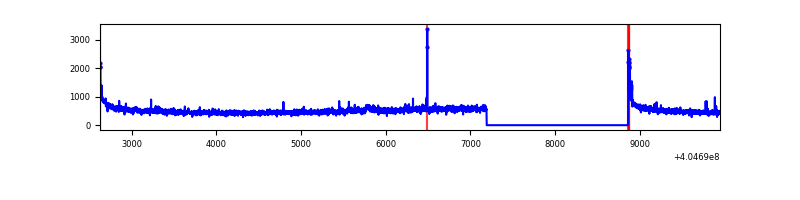 |
| B | 7324 | 5653 | 193 | 193 | 2.64% | 3.41% | 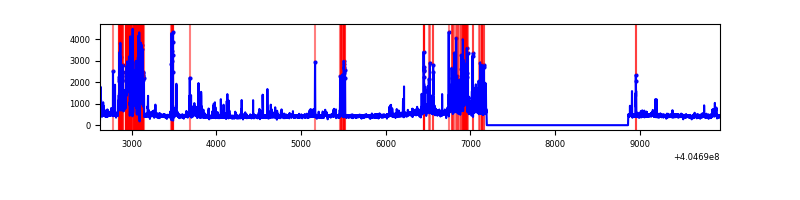 |
| C | 7324 | 5653 | 53 | 53 | 0.72% | 0.94% | 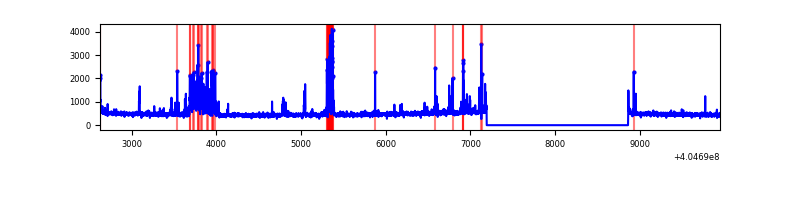 |
| D | 7324 | 5653 | 491 | 491 | 6.70% | 8.69% | 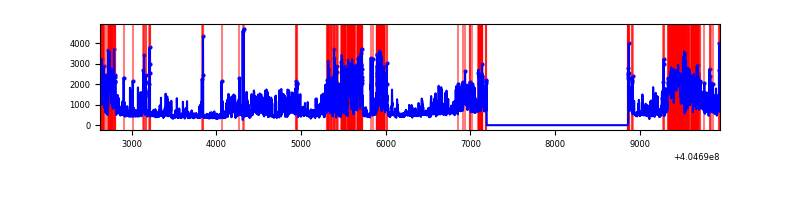 |
Top three noisy pixels from each quadrant. If the there are fewer than three noisy pixels in the level2.evt file, extra rows are filled as -1
| Pixel properties | Quadrant properties | ||||||
|---|---|---|---|---|---|---|---|
| Quadrant | DetID | PixID | Counts | Sigma | Mean | Median | Sigma |
| A | 10 | 83 | 402078 | 3242.52 | 610 | 596 | 123.8 |
| A | 12 | 189 | 103851 | 833.93 | 610 | 596 | 123.8 |
| A | 13 | 6 | 20301 | 159.14 | 610 | 596 | 123.8 |
| B | 5 | 184 | 476996 | 4149.21 | 597 | 582 | 114.8 |
| B | 5 | 172 | 226612 | 1968.55 | 597 | 582 | 114.8 |
| B | 0 | 229 | 206328 | 1791.89 | 597 | 582 | 114.8 |
| C | 14 | 254 | 448837 | 3223.07 | 597 | 602 | 139.1 |
| C | 15 | 214 | 239880 | 1720.55 | 597 | 602 | 139.1 |
| C | 1 | 23 | 31958 | 225.47 | 597 | 602 | 139.1 |
| D | 2 | 16 | 2041987 | 14533.07 | 571 | 553 | 140.5 |
| D | 13 | 138 | 285683 | 2029.85 | 571 | 553 | 140.5 |
| D | 7 | 223 | 263922 | 1874.94 | 571 | 553 | 140.5 |
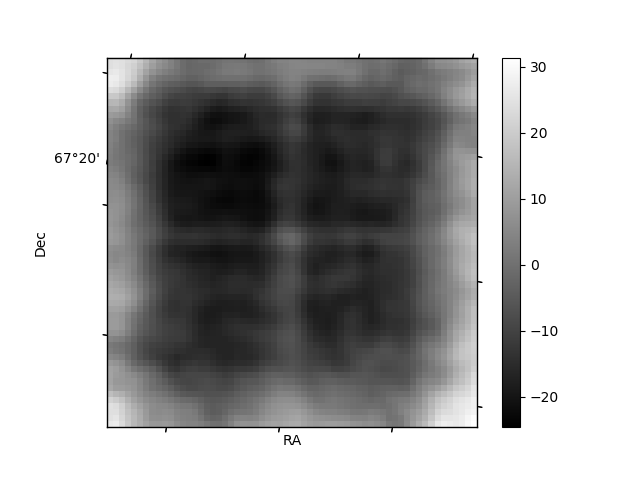
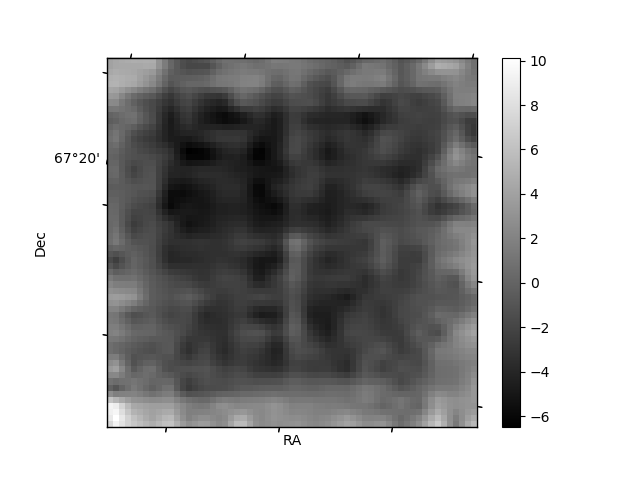
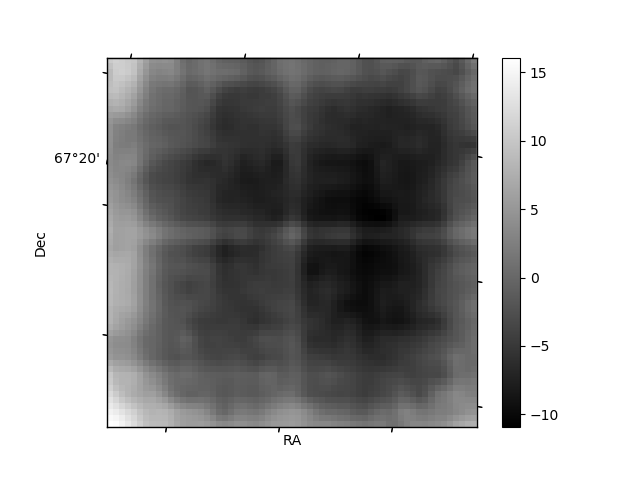
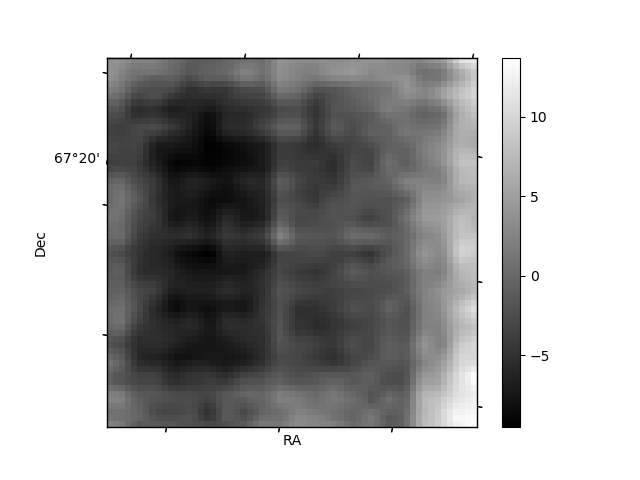
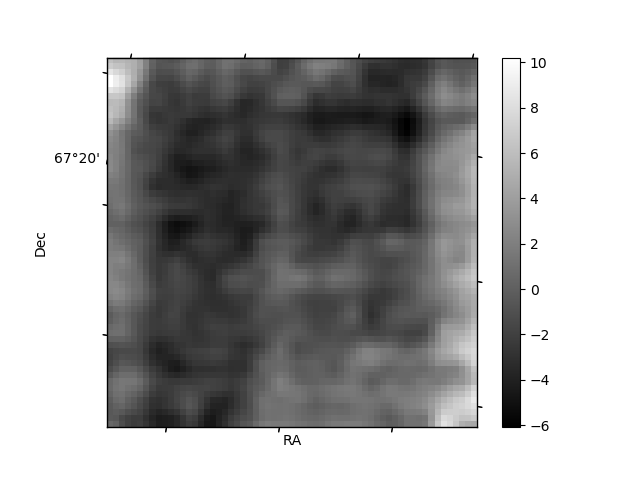
Histogram calculated using DETX and DETY for each event in the final _common_clean file
| Quadrant A | 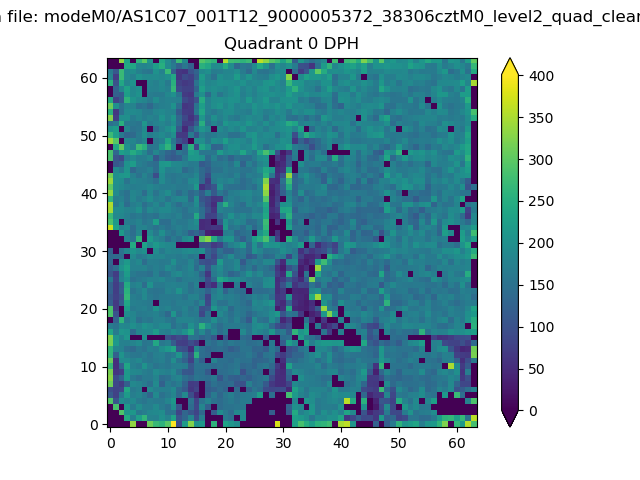 |
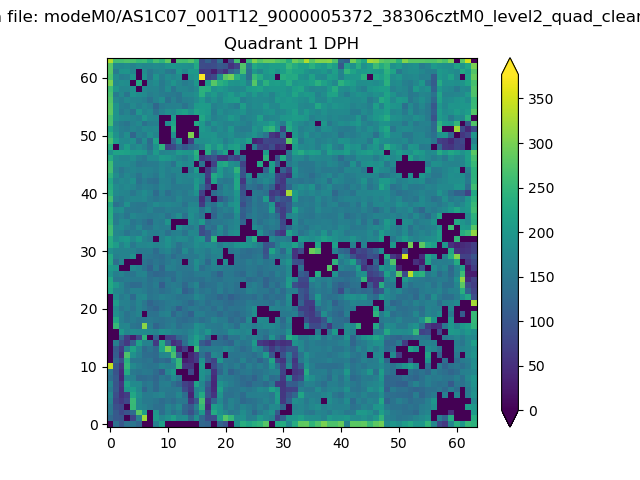 |
Quadrant B |
|---|---|---|---|
| Quadrant D | 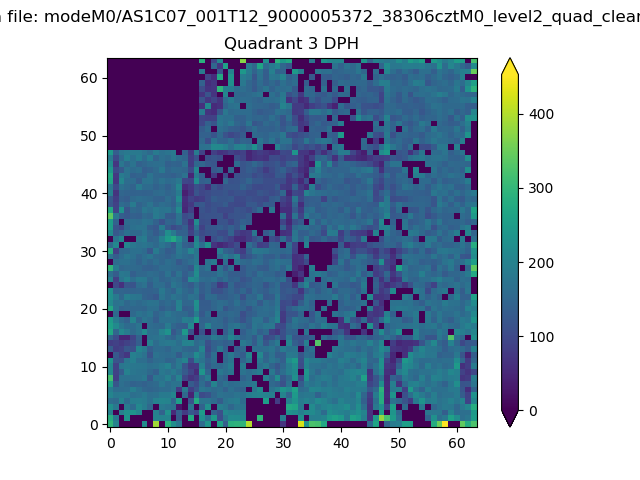 |
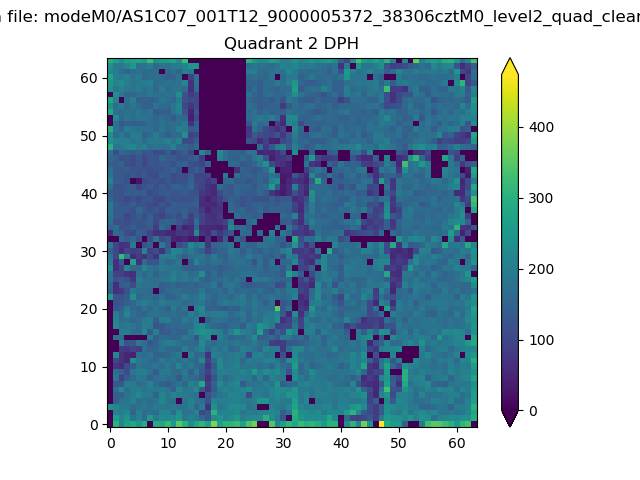 |
Quadrant C |
| Plot type | Count rate plots | Images |
|---|---|---|
| Comparison with Poisson distribution Blue bars denote a histogram of data divided into 1 sec bins. Red curve is a Poisson curve with rate = median count rate of data. |
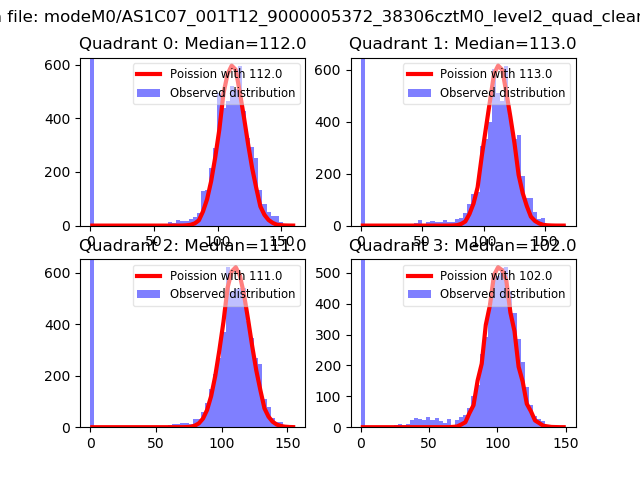 |
 |
| Quadrant-wise count rates Data is divided into 100 sec bins |
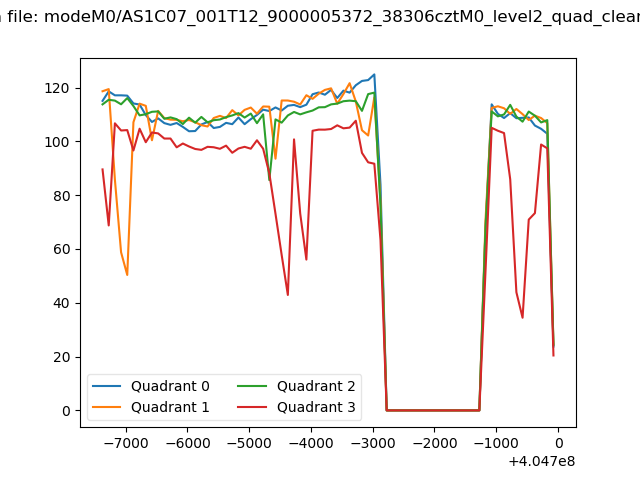 |
|
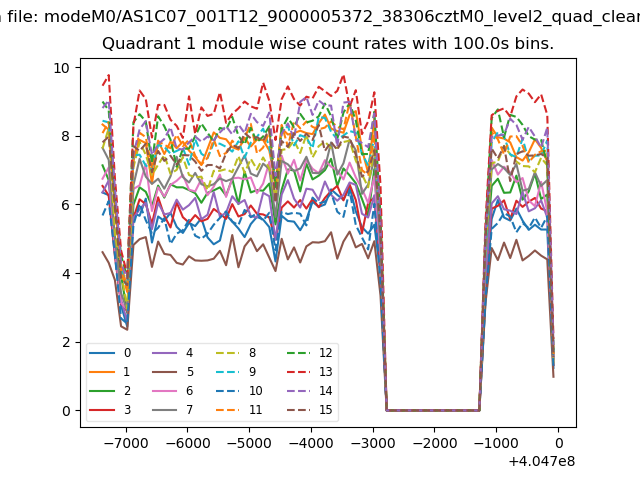
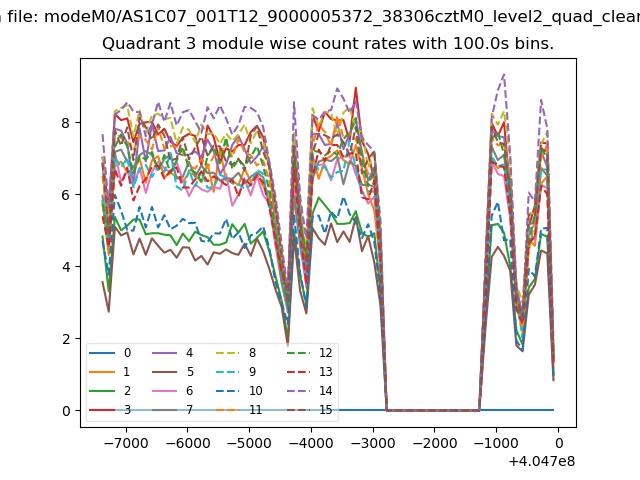
| Module-wise count rates for Quadrant A Data is divided into 100 sec bins |
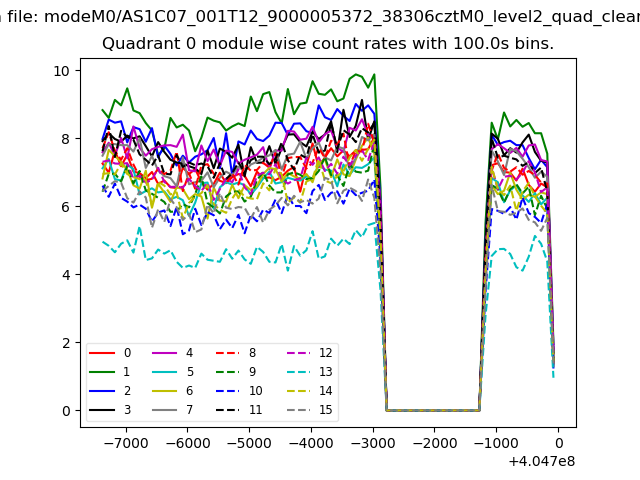 |
 |
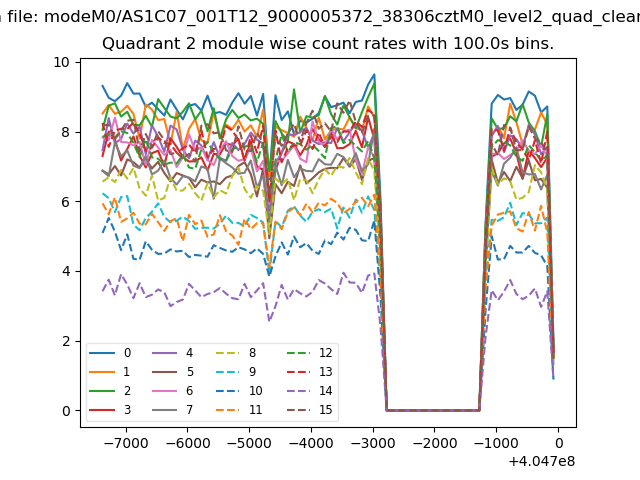
| Module-wise count rates for Quadrant B Data is divided into 100 sec bins |
 |
 |
| Module-wise count rates for Quadrant C Data is divided into 100 sec bins |
 |
 |
| Module-wise count rates for Quadrant D Data is divided into 100 sec bins |
 |
 |
| Parameter | Plot |
|---|---|
| CZT HV Monitor | 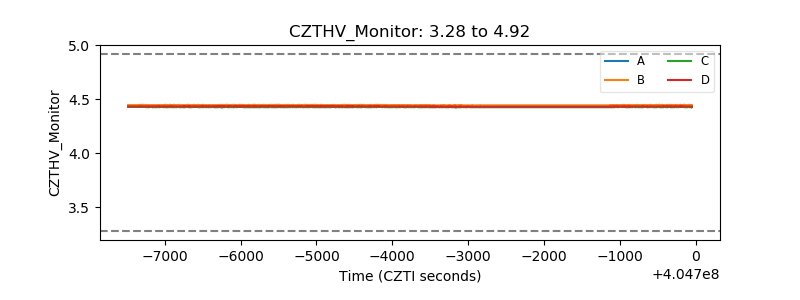 |
| D_VDD | 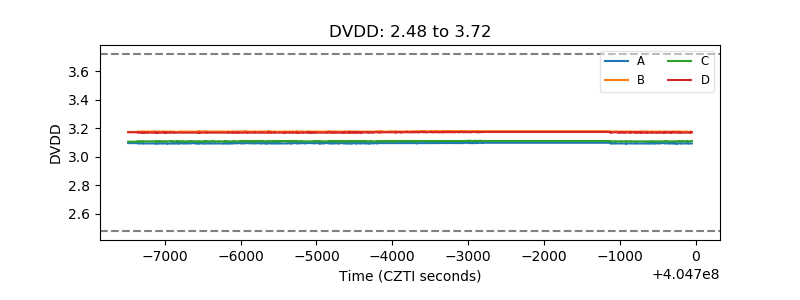 |
| Temperature 1 | 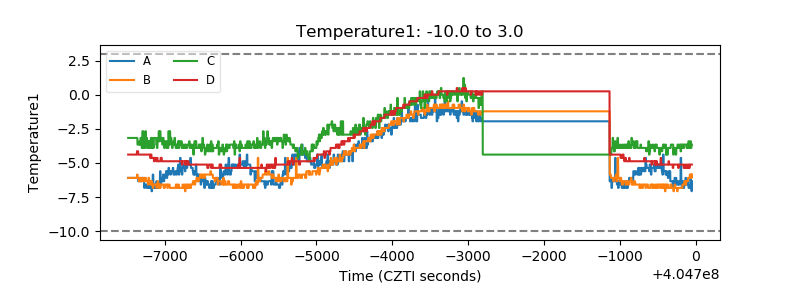 |
| Veto HV Monitor | 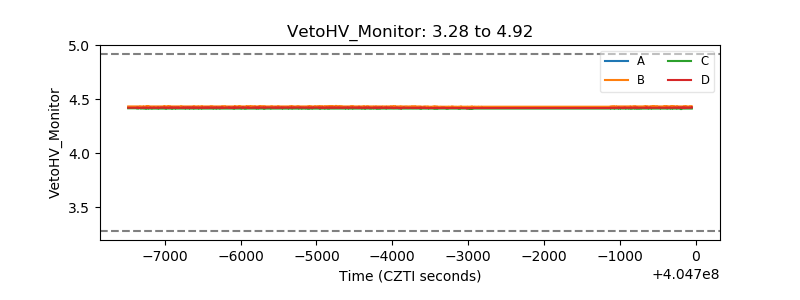 |
| Veto LLD | 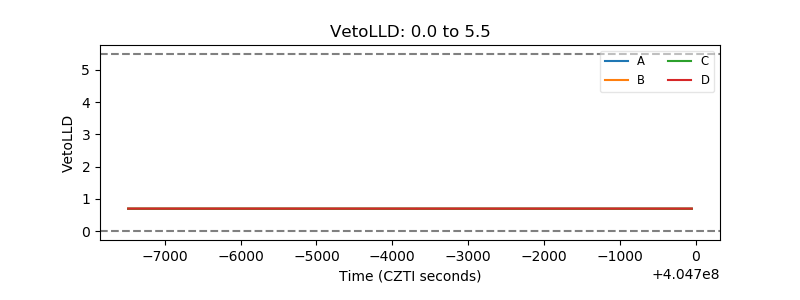 |
| Alpha Counter | 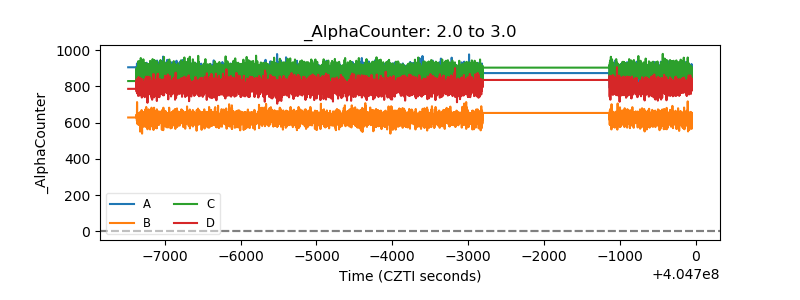 |
| _CPM_Rate | 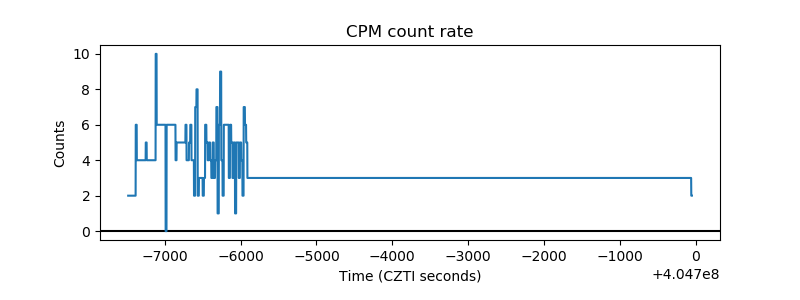 |
| CZT Counter | 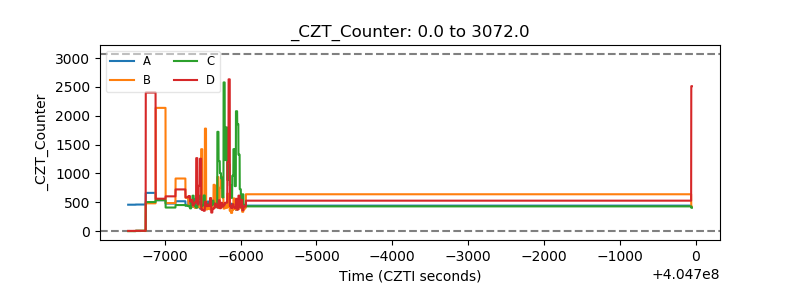 |
| +2.5 Volts monitor | 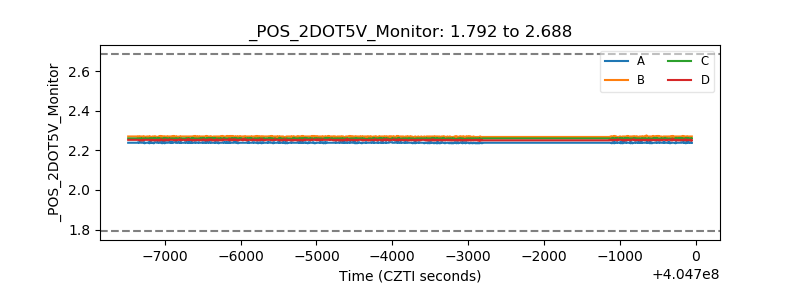 |
| +5 Volts monitor | 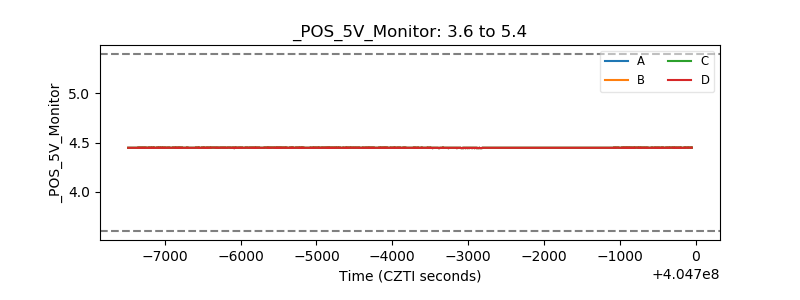 |
| _ROLL_ROT | 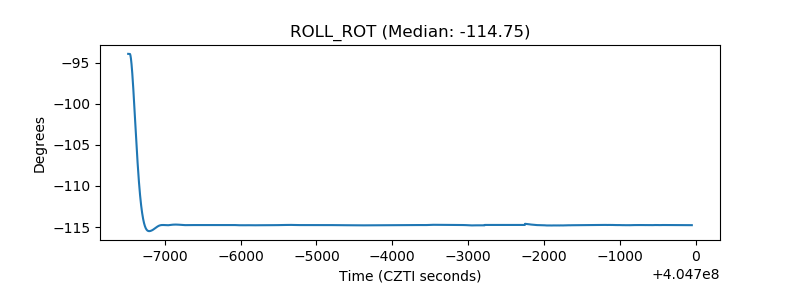 |
| _Roll_DEC | 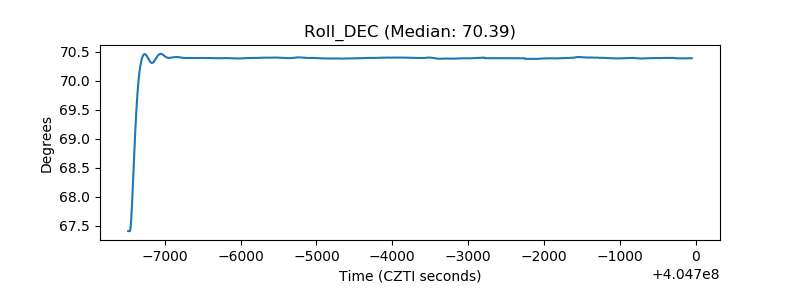 |
| _Roll_RA | 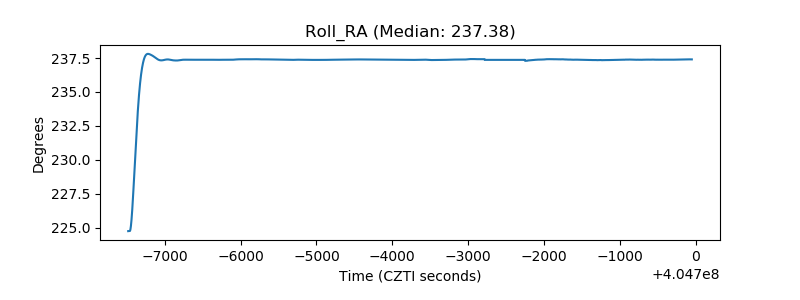 |
| Veto Counter | 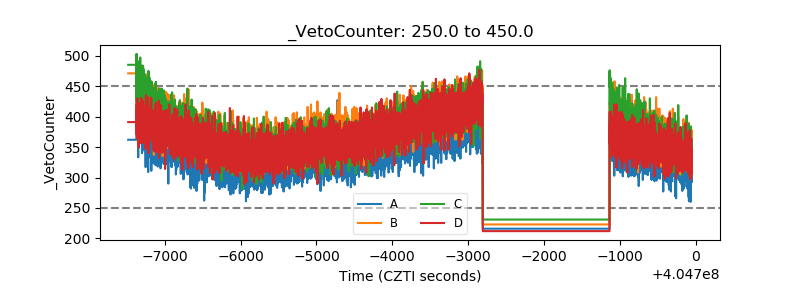 |