| Param | Original file | Final file |
|---|---|---|
| Filename | modeM0/AS1C07_001T12_9000005372_38307cztM0_level2.fits | modeM0/AS1C07_001T12_9000005372_38307cztM0_level2_quad_clean.evt |
| Size (bytes) | 467,844,480 | 91,667,520 |
| Size | 446.2 MB | 87.4 MB |
| Events in quadrant A | 2,985,360 | 643,973 |
| Events in quadrant B | 2,829,299 | 657,609 |
| Events in quadrant C | 2,921,925 | 639,981 |
| Events in quadrant D | 8,126,405 | 425,246 |
| Mode SS | |||
|---|---|---|---|
| Quadrant | BADHDUFLAG | Total packets | Discarded packets |
| A | 0 | 118 | 0 |
| B | 0 | 118 | 0 |
| C | 0 | 118 | 0 |
| D | 0 | 118 | 0 |
| Mode M9 | |||
|---|---|---|---|
| Quadrant | BADHDUFLAG | Total packets | Discarded packets |
| A | 0 | 24 | 0 |
| B | 0 | 24 | 0 |
| C | 0 | 24 | 0 |
| D | 0 | 25 | 0 |
| Mode M0 | |||
|---|---|---|---|
| Quadrant | BADHDUFLAG | Total packets | Discarded packets |
| A | 0 | 12570 | 3 |
| B | 0 | 12556 | 2 |
| C | 0 | 12411 | 2 |
| D | 0 | 28170 | 2 |
| Quadrant | Total seconds | Saturated seconds | Saturation percentage |
|---|---|---|---|
| A | 5849 | 11 | 0.188066% |
| B | 5849 | 43 | 0.735168% |
| C | 5849 | 7 | 0.119679% |
| D | 5849 | 1794 | 30.671910% |
Noise dominated data is calculated using 1-second bins in cleaned event files. If a bin has >2000 counts, and if more than 50% of those come from <1% of pixels, then it is considered to be noise-dominated and hence unusable.
| Quadrant | # 1 sec bins | Bins with >0 counts | Bins with >2000 counts | High rate bins dominated by noise | Noise dominated (total time) | Noise dominated (detector-on time) | Marked lightcurve |
|---|---|---|---|---|---|---|---|
| A | 7251 | 5850 | 10 | 10 | 0.14% | 0.17% | 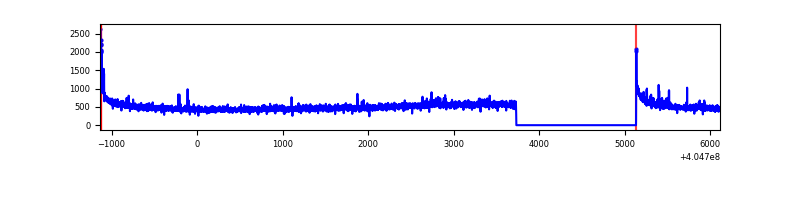 |
| B | 7251 | 5850 | 29 | 29 | 0.40% | 0.50% | 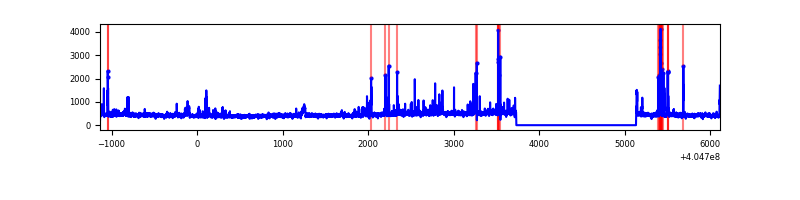 |
| C | 7251 | 5850 | 1 | 1 | 0.01% | 0.02% | 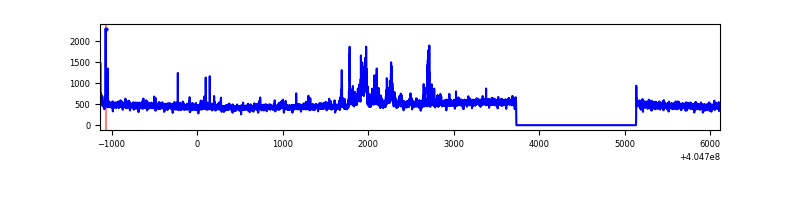 |
| D | 7251 | 5850 | 1537 | 1537 | 21.20% | 26.27% | 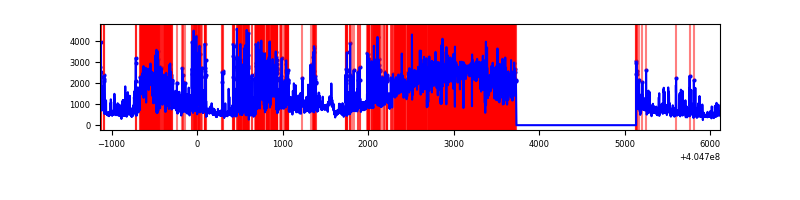 |
Top three noisy pixels from each quadrant. If the there are fewer than three noisy pixels in the level2.evt file, extra rows are filled as -1
| Pixel properties | Quadrant properties | ||||||
|---|---|---|---|---|---|---|---|
| Quadrant | DetID | PixID | Counts | Sigma | Mean | Median | Sigma |
| A | 10 | 83 | 412116 | 3198.9 | 635 | 620 | 128.6 |
| A | 12 | 189 | 74606 | 575.16 | 635 | 620 | 128.6 |
| A | 13 | 6 | 18006 | 135.16 | 635 | 620 | 128.6 |
| B | 5 | 172 | 135306 | 1110.53 | 633 | 616 | 121.3 |
| B | 0 | 183 | 77711 | 635.65 | 633 | 616 | 121.3 |
| B | 0 | 229 | 61511 | 502.08 | 633 | 616 | 121.3 |
| C | 15 | 214 | 247147 | 1706.54 | 624 | 627 | 144.5 |
| C | 14 | 254 | 202120 | 1394.84 | 624 | 627 | 144.5 |
| C | 1 | 23 | 14644 | 97.03 | 624 | 627 | 144.5 |
| D | 10 | 203 | 2535003 | 19098.21 | 538 | 522 | 132.7 |
| D | 2 | 16 | 1607579 | 12109.74 | 538 | 522 | 132.7 |
| D | 13 | 138 | 1014340 | 7639.48 | 538 | 522 | 132.7 |
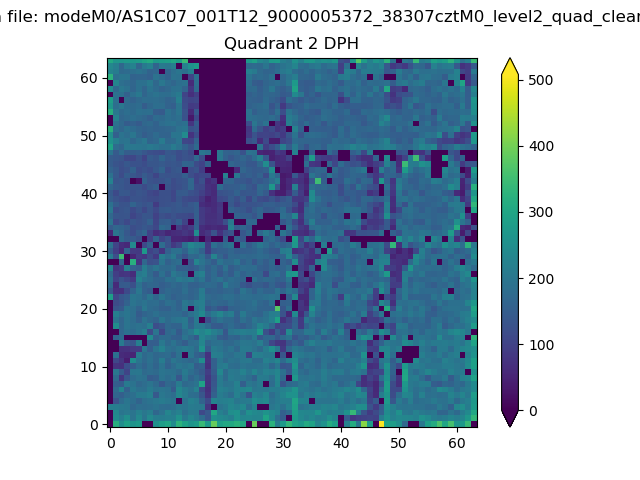
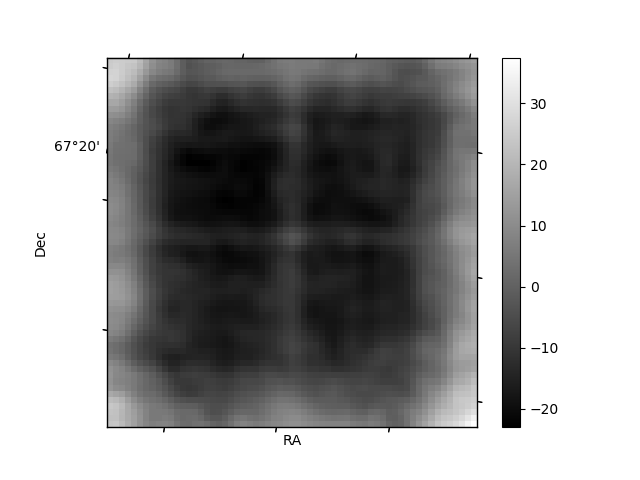
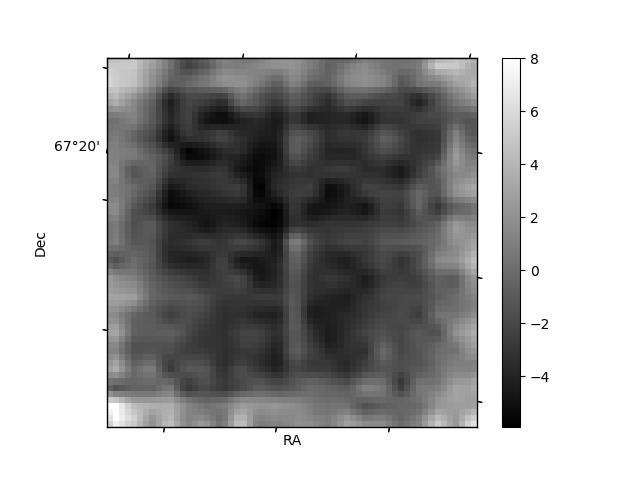
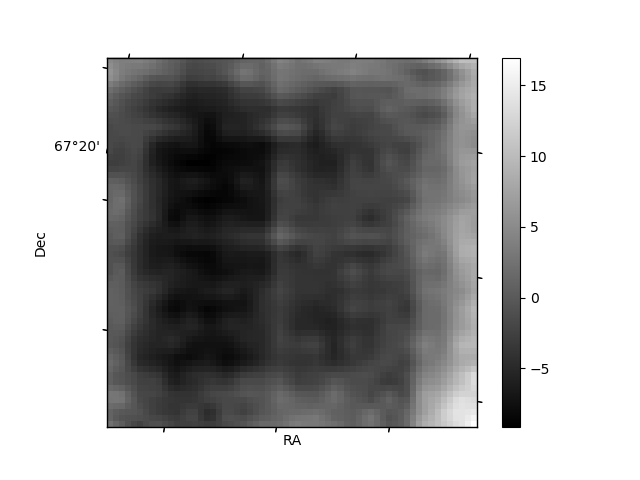
Histogram calculated using DETX and DETY for each event in the final _common_clean file
| Quadrant A | 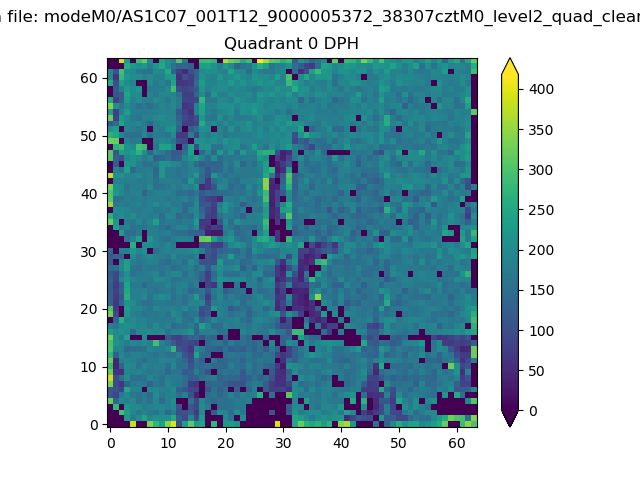 |
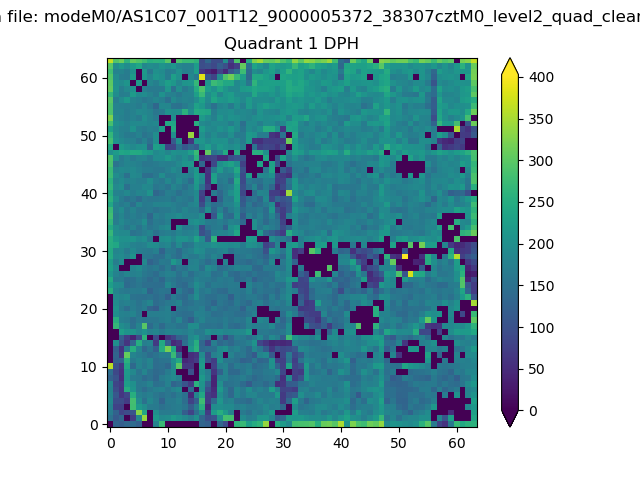 |
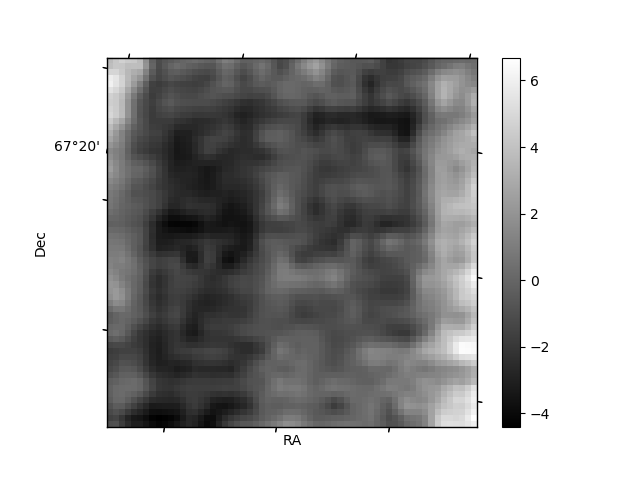
Quadrant B |
|---|---|---|---|
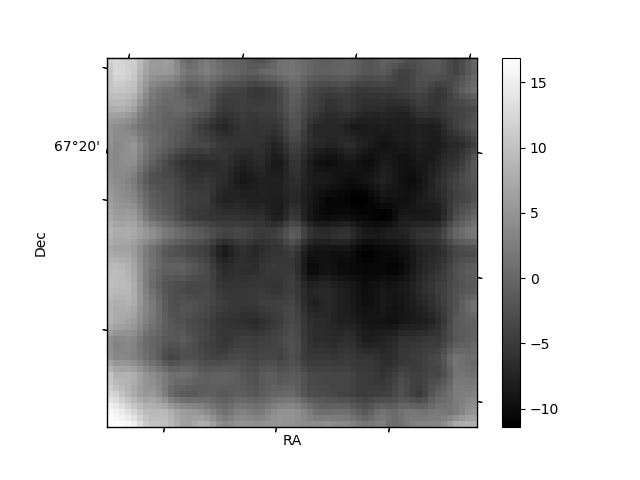
| Quadrant D | 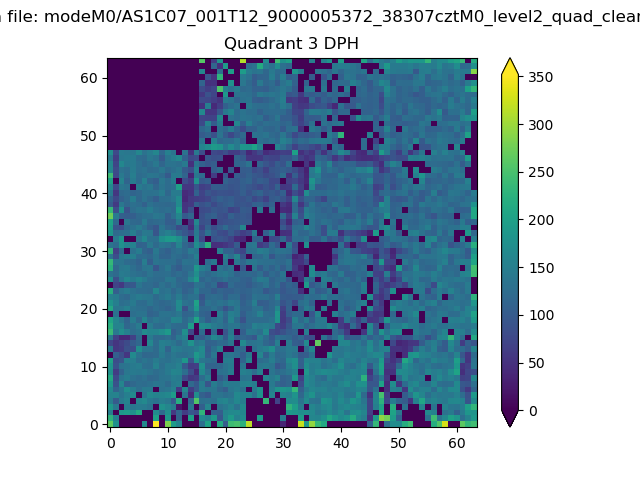 |
 |
Quadrant C |
| Plot type | Count rate plots | Images |
|---|---|---|
| Comparison with Poisson distribution Blue bars denote a histogram of data divided into 1 sec bins. Red curve is a Poisson curve with rate = median count rate of data. |
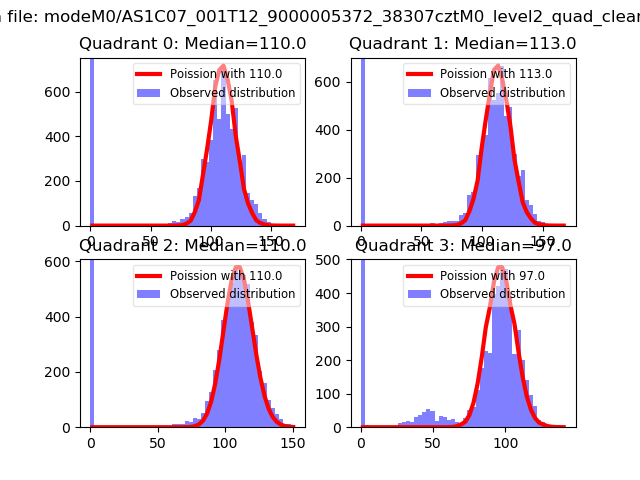 |
 |
| Quadrant-wise count rates Data is divided into 100 sec bins |
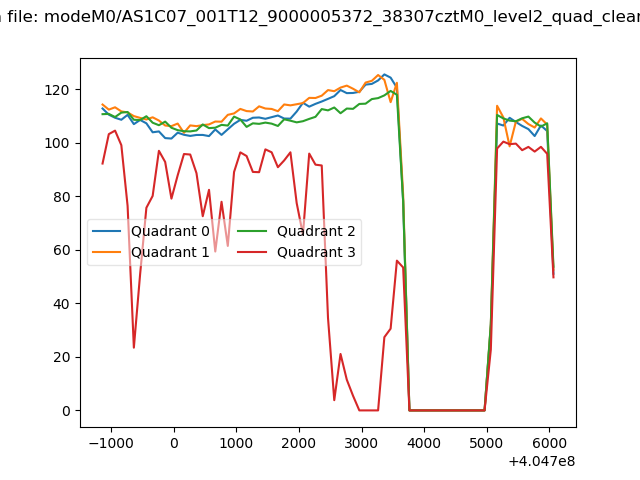 |
|
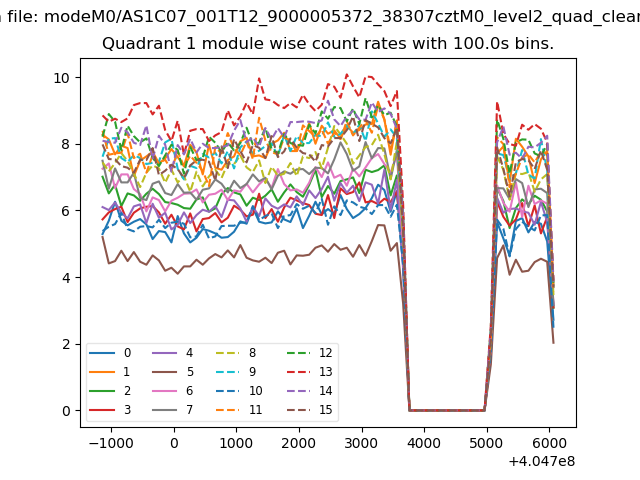
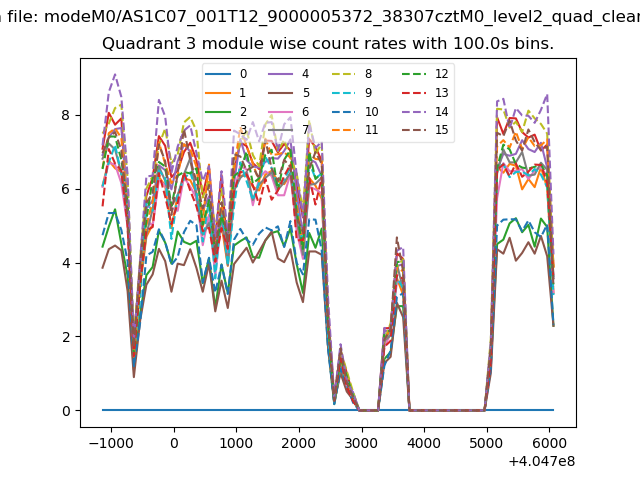
| Module-wise count rates for Quadrant A Data is divided into 100 sec bins |
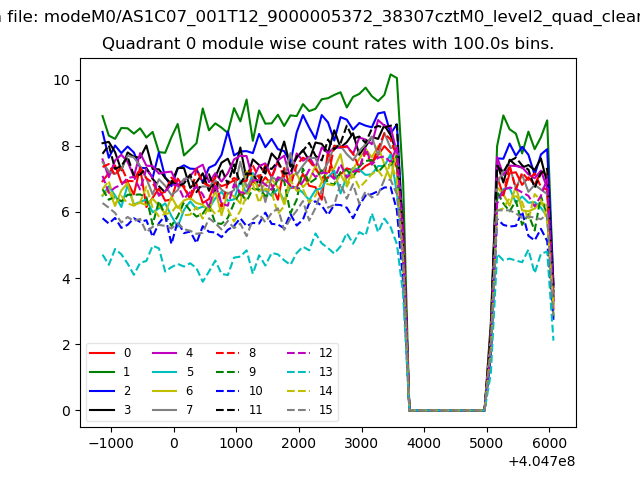 |
 |
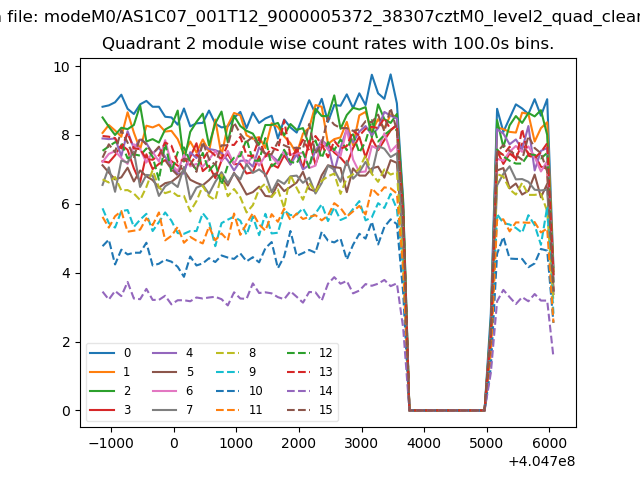
| Module-wise count rates for Quadrant B Data is divided into 100 sec bins |
 |
 |
| Module-wise count rates for Quadrant C Data is divided into 100 sec bins |
 |
 |
| Module-wise count rates for Quadrant D Data is divided into 100 sec bins |
 |
 |
| Parameter | Plot |
|---|---|
| CZT HV Monitor | 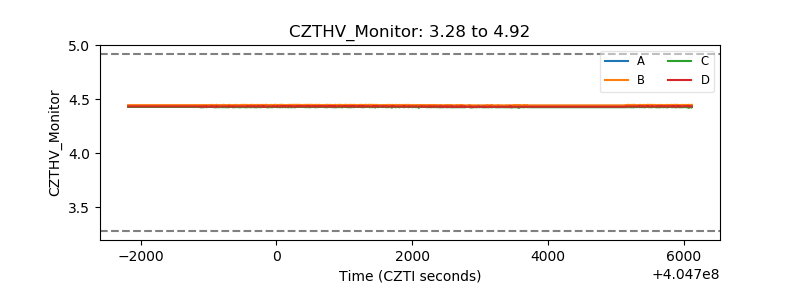 |
| D_VDD | 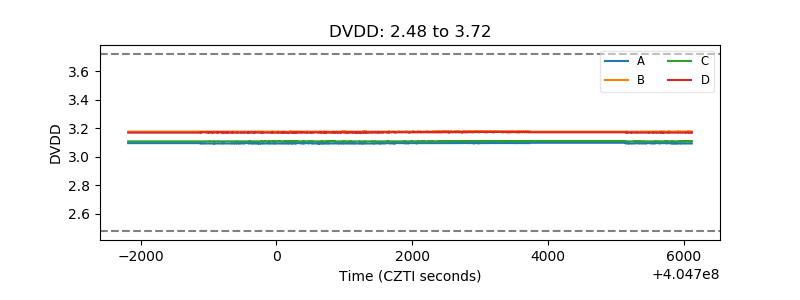 |
| Temperature 1 | 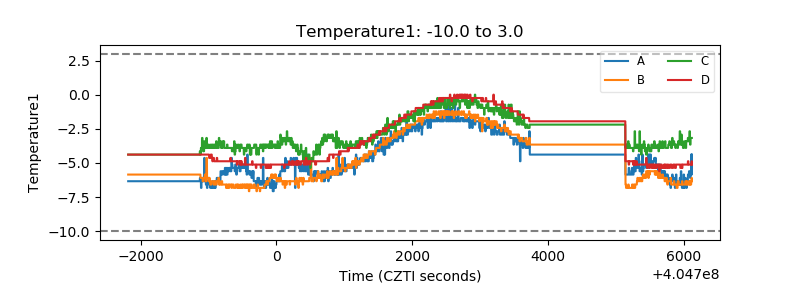 |
| Veto HV Monitor | 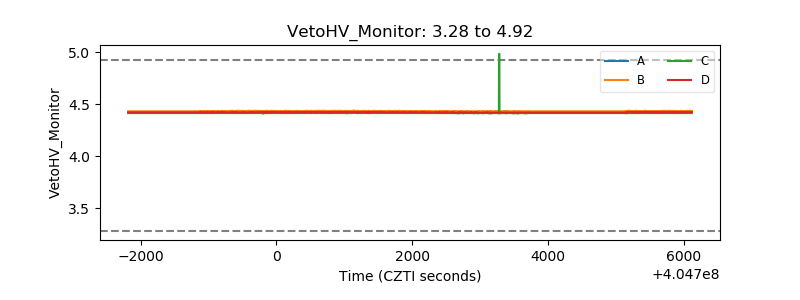 |
| Veto LLD | 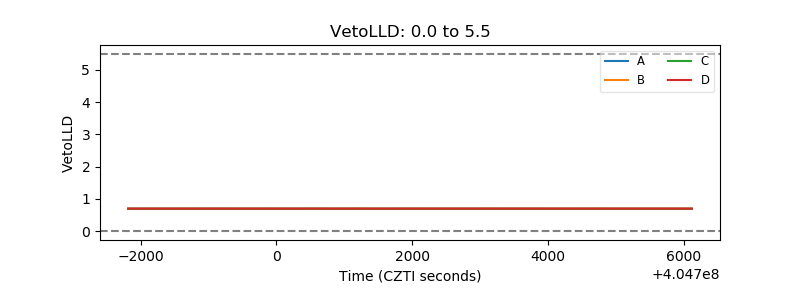 |
| Alpha Counter | 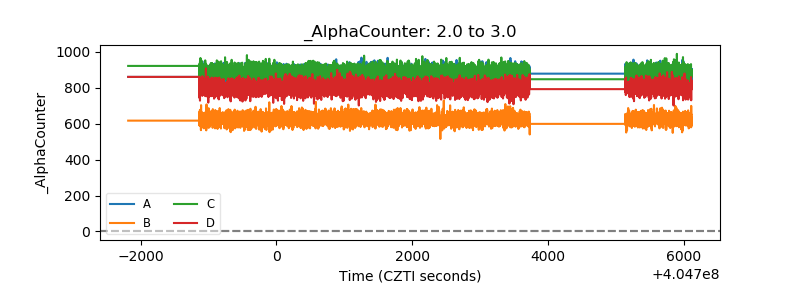 |
| _CPM_Rate | 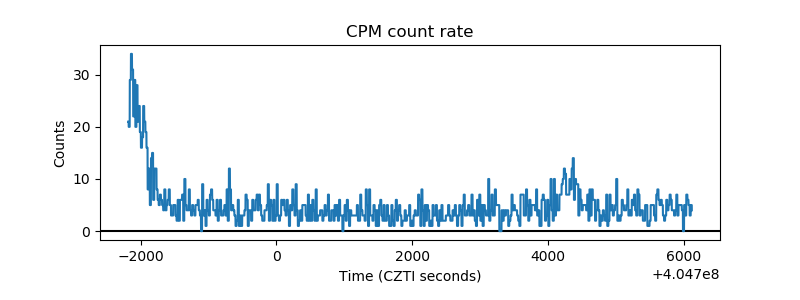 |
| CZT Counter | 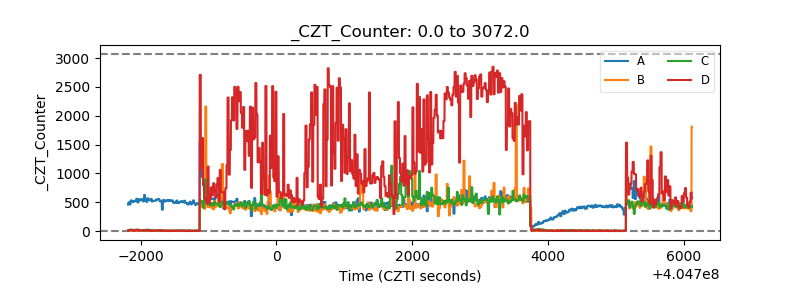 |
| +2.5 Volts monitor | 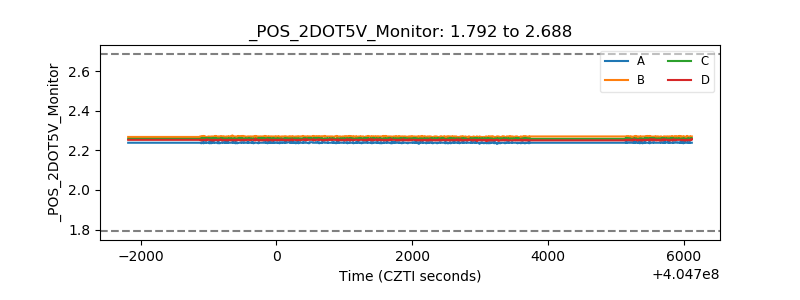 |
| +5 Volts monitor | 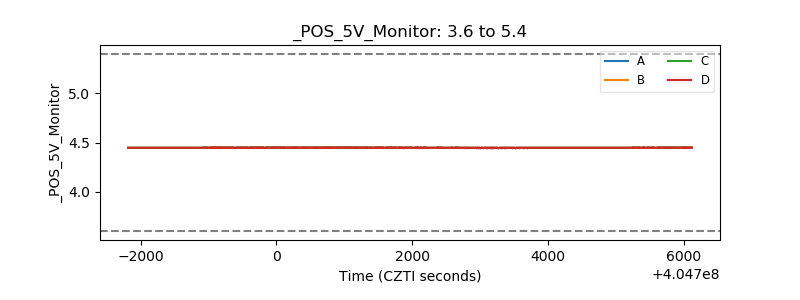 |
| _ROLL_ROT | 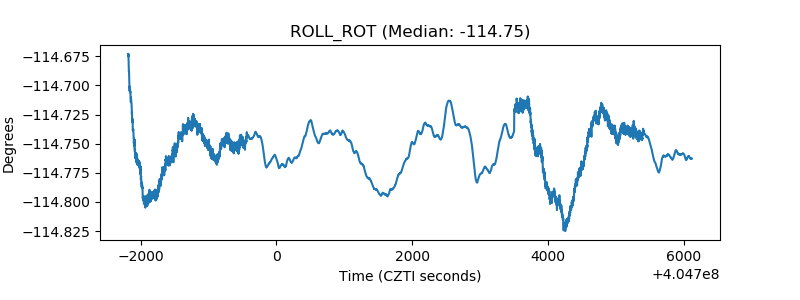 |
| _Roll_DEC | 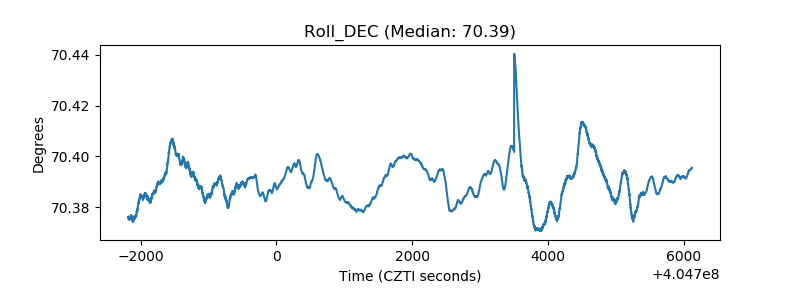 |
| _Roll_RA | 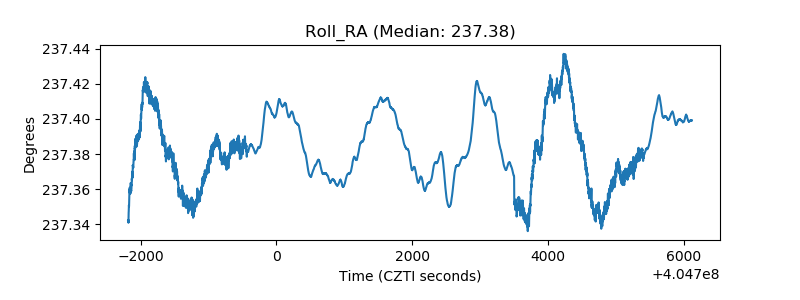 |
| Veto Counter | 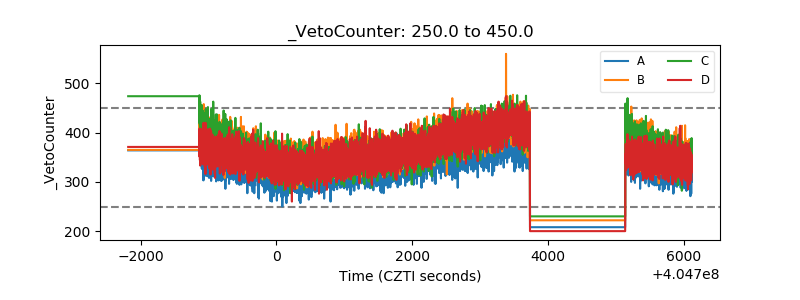 |