| Param | Original file | Final file |
|---|---|---|
| Filename | modeM0/AS1C07_001T12_9000005372_38308cztM0_level2.fits | modeM0/AS1C07_001T12_9000005372_38308cztM0_level2_quad_clean.evt |
| Size (bytes) | 526,536,000 | 99,296,640 |
| Size | 502.1 MB | 94.7 MB |
| Events in quadrant A | 3,471,569 | 705,857 |
| Events in quadrant B | 3,327,065 | 712,464 |
| Events in quadrant C | 2,980,655 | 697,400 |
| Events in quadrant D | 9,217,416 | 446,807 |
| Mode SS | |||
|---|---|---|---|
| Quadrant | BADHDUFLAG | Total packets | Discarded packets |
| A | 0 | 132 | 0 |
| B | 0 | 132 | 0 |
| C | 0 | 132 | 0 |
| D | 0 | 132 | 0 |
| Mode M9 | |||
|---|---|---|---|
| Quadrant | BADHDUFLAG | Total packets | Discarded packets |
| A | 0 | 26 | 0 |
| B | 0 | 26 | 0 |
| C | 0 | 26 | 0 |
| D | 0 | 26 | 0 |
| Mode M0 | |||
|---|---|---|---|
| Quadrant | BADHDUFLAG | Total packets | Discarded packets |
| A | 0 | 14294 | 3 |
| B | 0 | 14265 | 2 |
| C | 0 | 12897 | 2 |
| D | 0 | 31816 | 2 |
| Quadrant | Total seconds | Saturated seconds | Saturation percentage |
|---|---|---|---|
| A | 6358 | 18 | 0.283108% |
| B | 6358 | 95 | 1.494181% |
| C | 6358 | 3 | 0.047185% |
| D | 6358 | 2071 | 32.573136% |
Noise dominated data is calculated using 1-second bins in cleaned event files. If a bin has >2000 counts, and if more than 50% of those come from <1% of pixels, then it is considered to be noise-dominated and hence unusable.
| Quadrant | # 1 sec bins | Bins with >0 counts | Bins with >2000 counts | High rate bins dominated by noise | Noise dominated (total time) | Noise dominated (detector-on time) | Marked lightcurve |
|---|---|---|---|---|---|---|---|
| A | 9043 | 6360 | 7 | 7 | 0.08% | 0.11% | 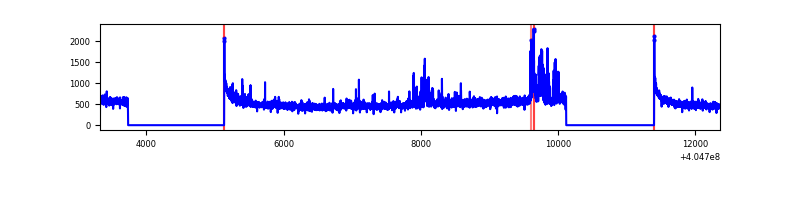 |
| B | 9043 | 6360 | 53 | 53 | 0.59% | 0.83% | 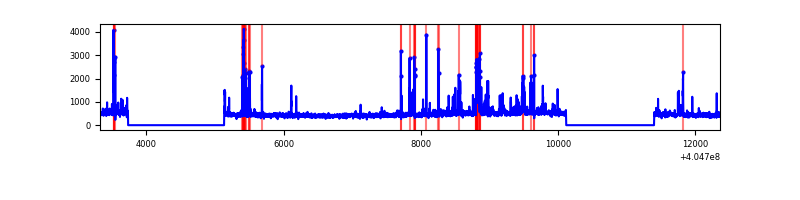 |
| C | 9043 | 6360 | 0 | 0 | 0.00% | 0.00% | 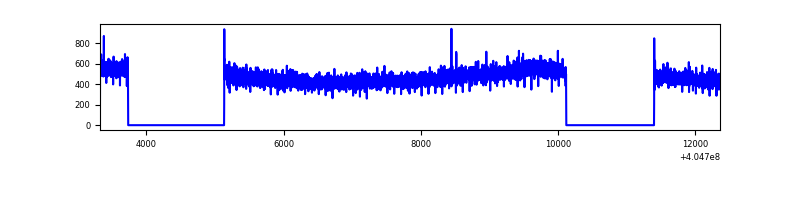 |
| D | 9043 | 6360 | 1897 | 1897 | 20.98% | 29.83% | 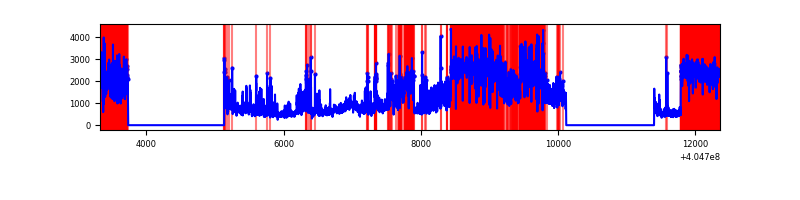 |
Top three noisy pixels from each quadrant. If the there are fewer than three noisy pixels in the level2.evt file, extra rows are filled as -1
| Pixel properties | Quadrant properties | ||||||
|---|---|---|---|---|---|---|---|
| Quadrant | DetID | PixID | Counts | Sigma | Mean | Median | Sigma |
| A | 10 | 83 | 449024 | 3167.7 | 703 | 688 | 141.5 |
| A | 13 | 248 | 235830 | 1661.39 | 703 | 688 | 141.5 |
| A | 12 | 189 | 58093 | 405.59 | 703 | 688 | 141.5 |
| B | 5 | 172 | 280924 | 2086.59 | 699 | 680 | 134.3 |
| B | 0 | 229 | 120704 | 893.65 | 699 | 680 | 134.3 |
| B | 0 | 183 | 91265 | 674.46 | 699 | 680 | 134.3 |
| C | 15 | 214 | 271749 | 1675.04 | 691 | 694 | 161.8 |
| C | 14 | 67 | 7196 | 40.18 | 691 | 694 | 161.8 |
| C | 13 | 61 | 4708 | 24.81 | 691 | 694 | 161.8 |
| D | 10 | 203 | 3839562 | 26527.94 | 592 | 575 | 144.7 |
| D | 2 | 16 | 1885677 | 13026.32 | 592 | 575 | 144.7 |
| D | 12 | 235 | 709290 | 4897.32 | 592 | 575 | 144.7 |
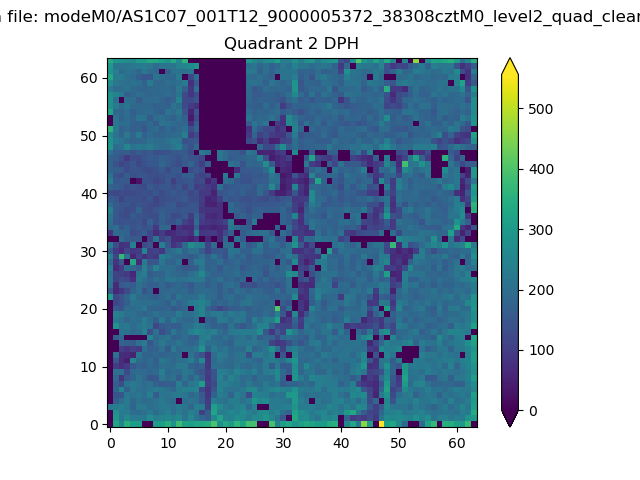
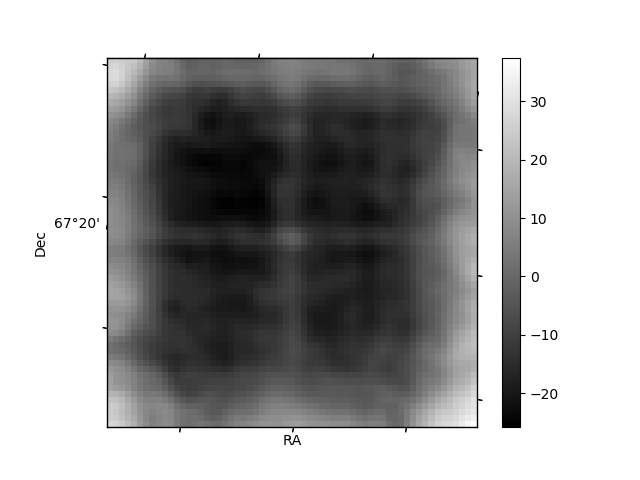
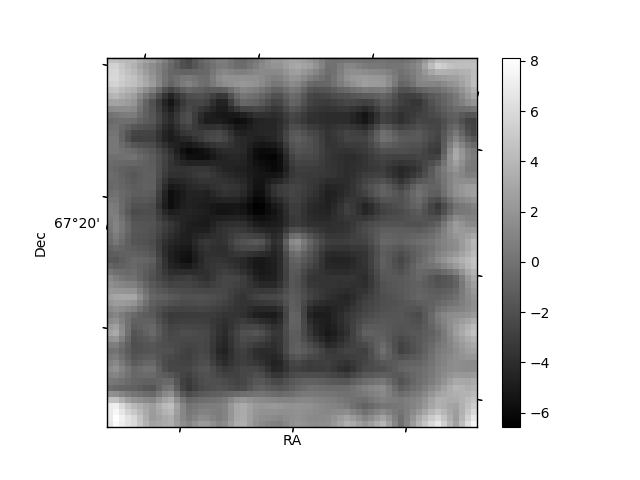
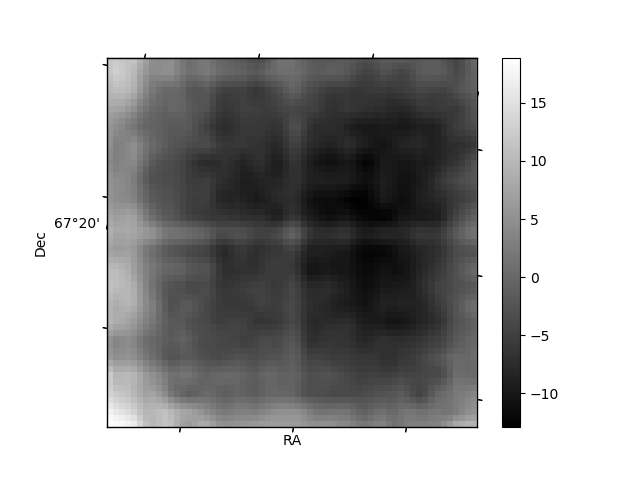
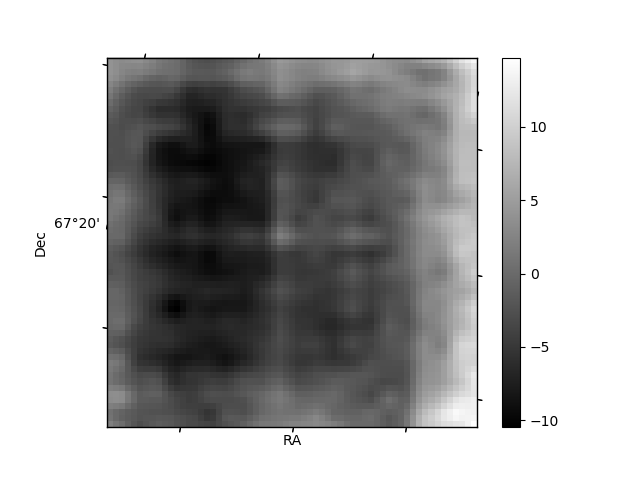
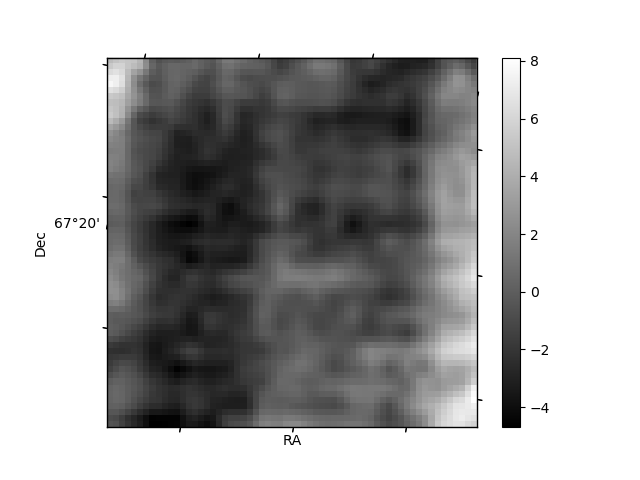
Histogram calculated using DETX and DETY for each event in the final _common_clean file
| Quadrant A | 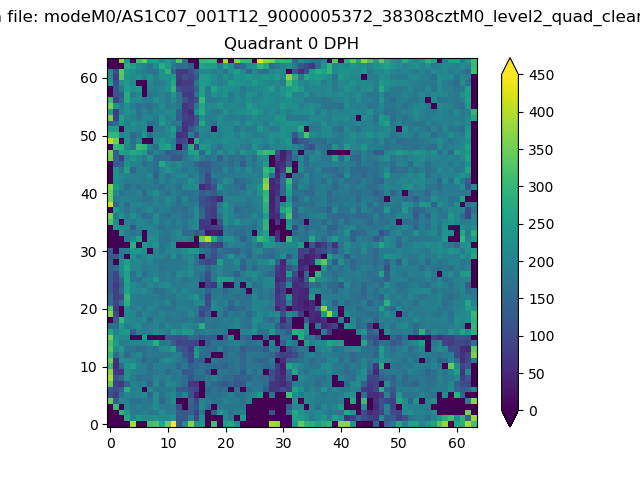 |
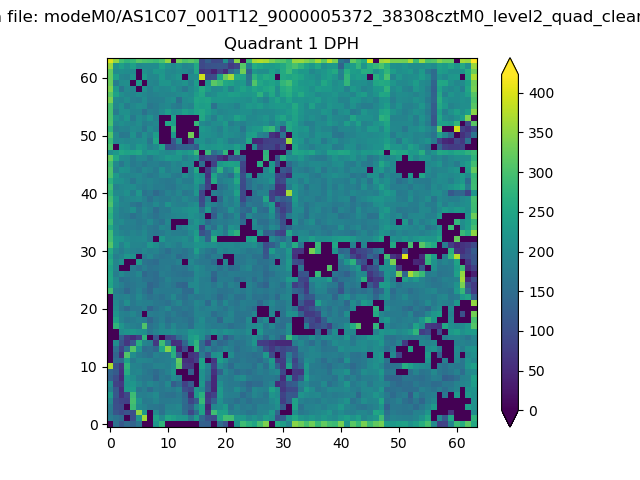 |
Quadrant B |
|---|---|---|---|
| Quadrant D | 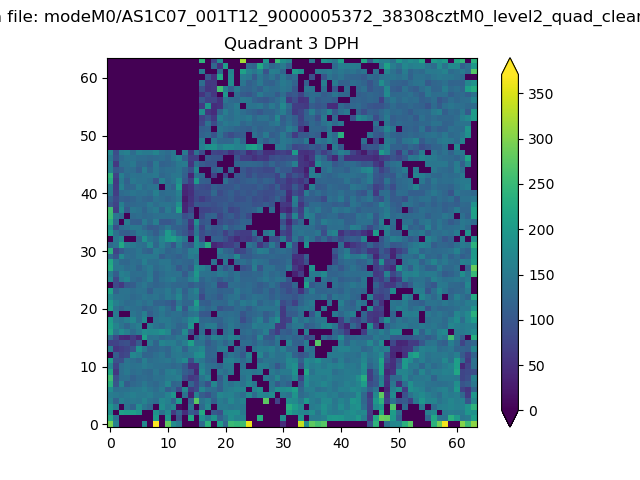 |
 |
Quadrant C |
| Plot type | Count rate plots | Images |
|---|---|---|
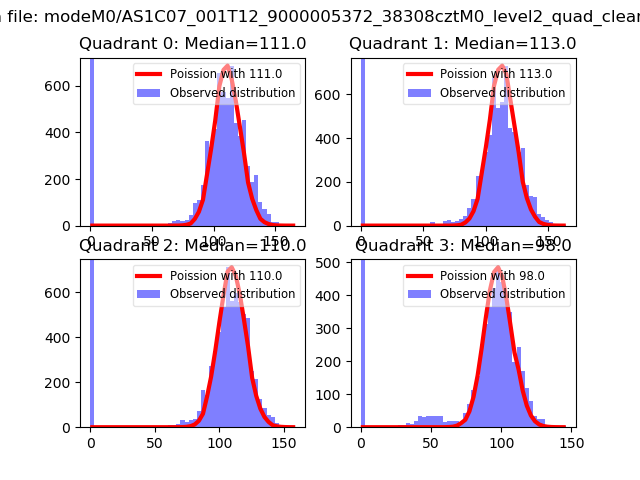
| Comparison with Poisson distribution Blue bars denote a histogram of data divided into 1 sec bins. Red curve is a Poisson curve with rate = median count rate of data. |
 |
 |
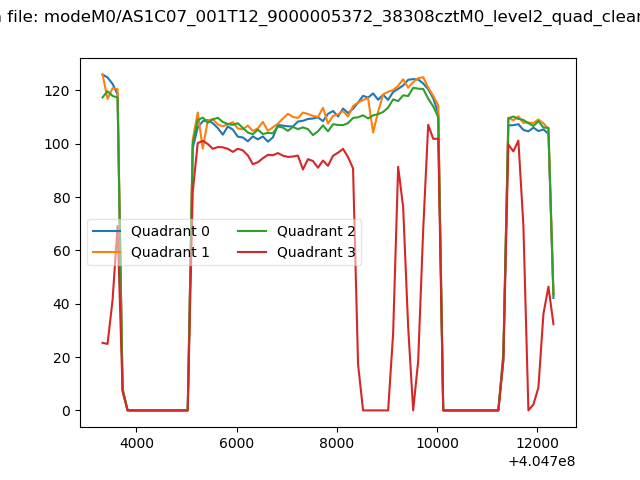
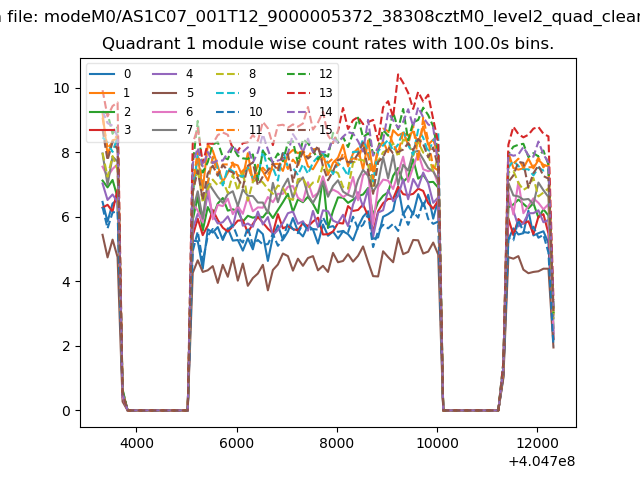
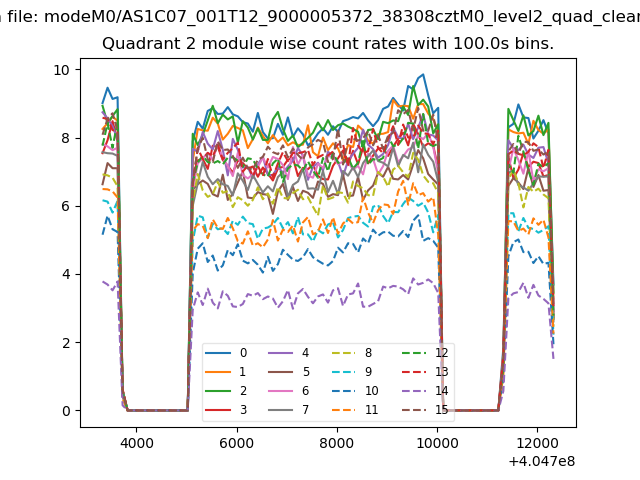
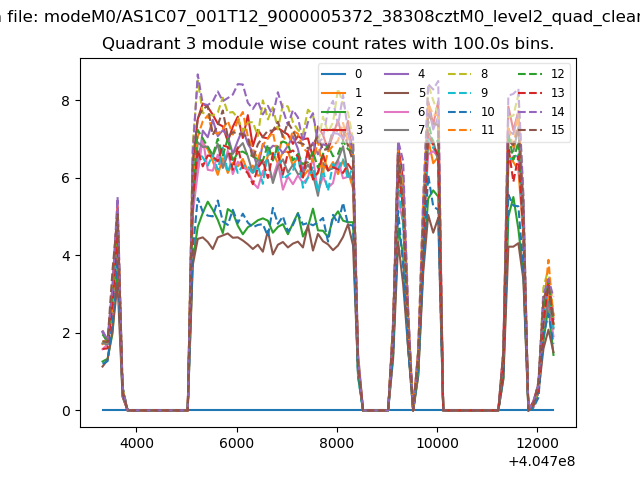
| Quadrant-wise count rates Data is divided into 100 sec bins |
 |
|
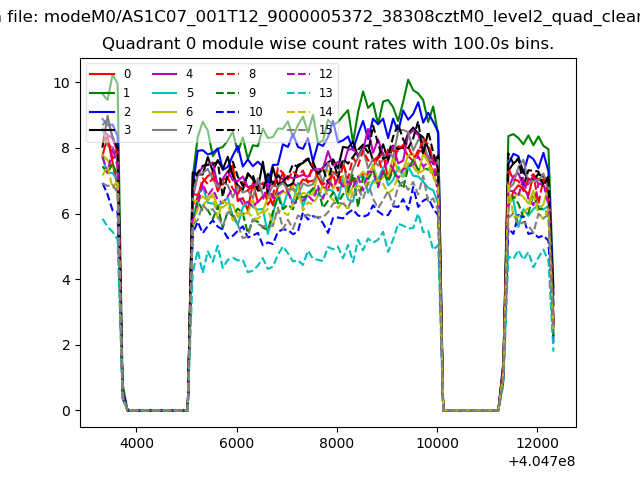
| Module-wise count rates for Quadrant A Data is divided into 100 sec bins |
 |
 |
| Module-wise count rates for Quadrant B Data is divided into 100 sec bins |
 |
 |
| Module-wise count rates for Quadrant C Data is divided into 100 sec bins |
 |
 |
| Module-wise count rates for Quadrant D Data is divided into 100 sec bins |
 |
 |
| Parameter | Plot |
|---|---|
| CZT HV Monitor |  |
| D_VDD | 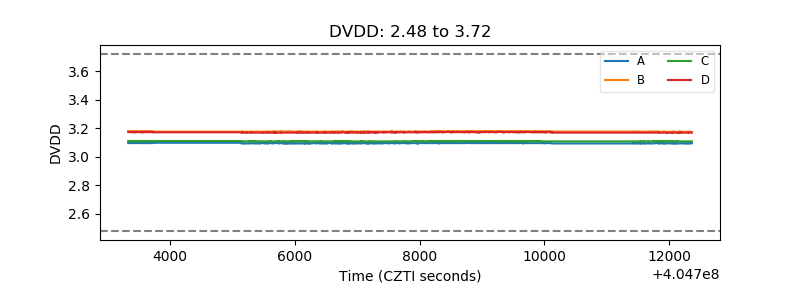 |
| Temperature 1 | 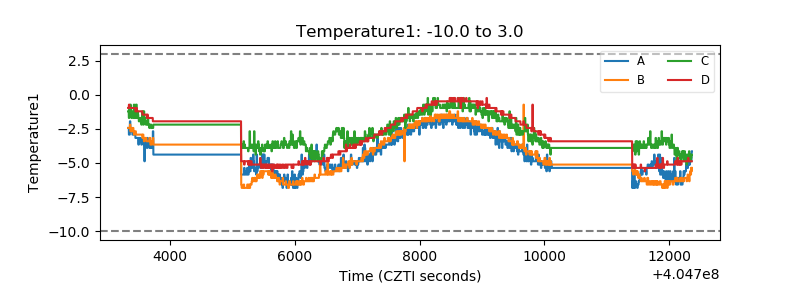 |
| Veto HV Monitor | 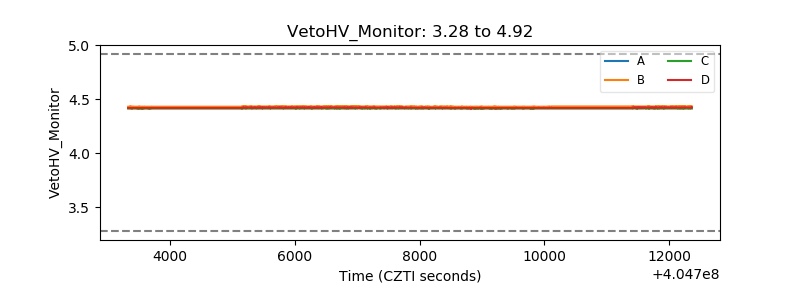 |
| Veto LLD | 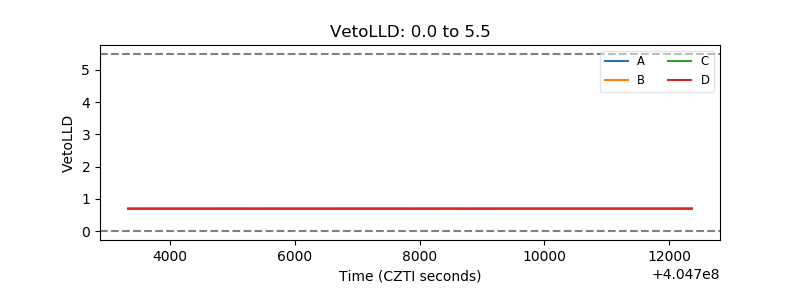 |
| Alpha Counter |  |
| _CPM_Rate | 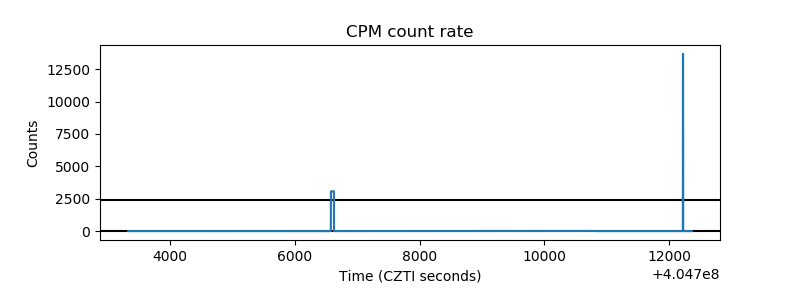 |
| CZT Counter | 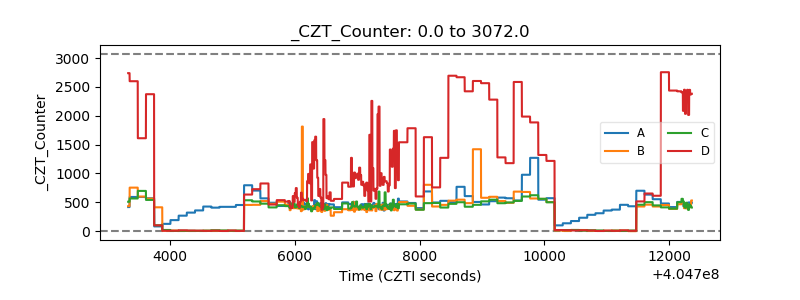 |
| +2.5 Volts monitor | 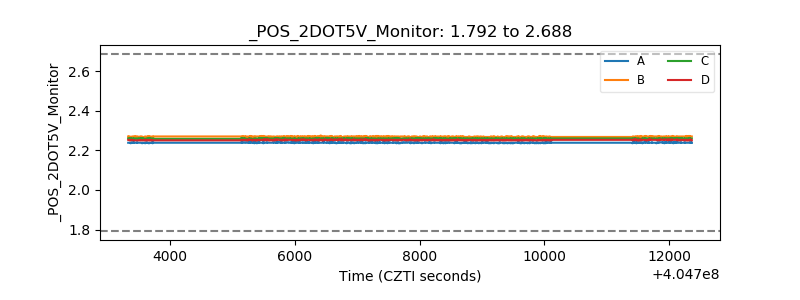 |
| +5 Volts monitor | 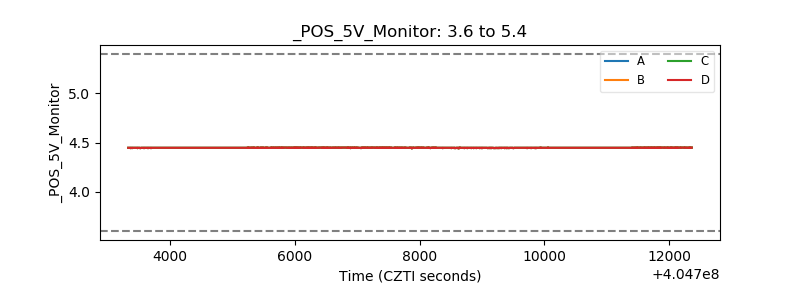 |
| _ROLL_ROT | 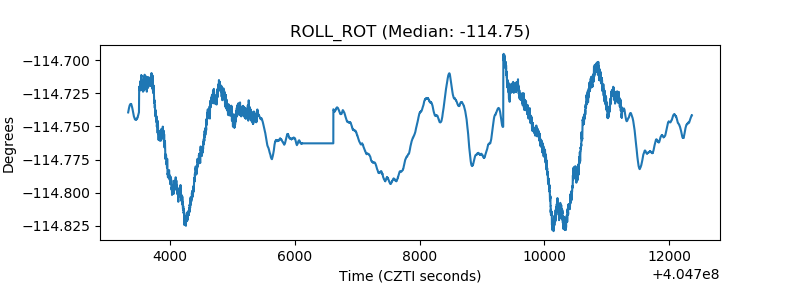 |
| _Roll_DEC | 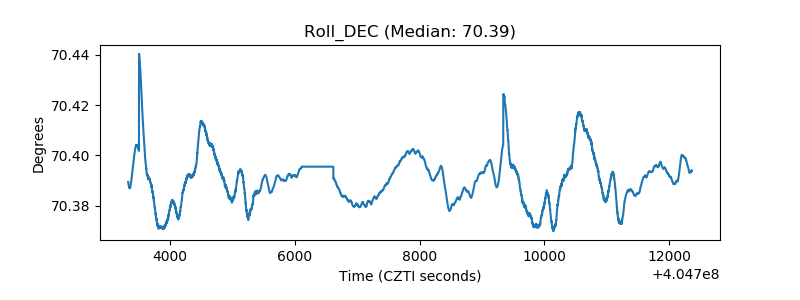 |
| _Roll_RA | 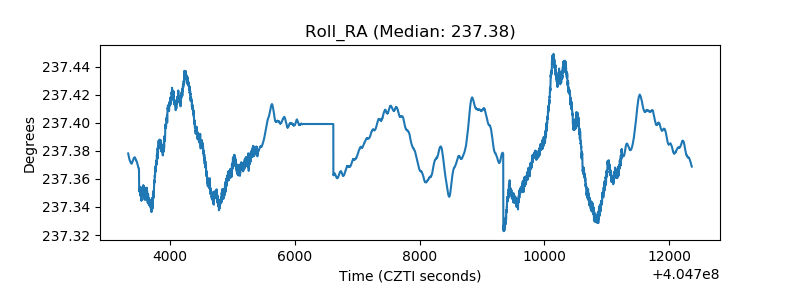 |
| Veto Counter | 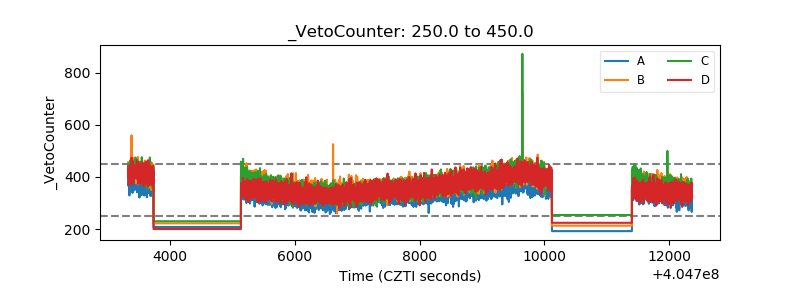 |