| Param | Original file | Final file |
|---|---|---|
| Filename | modeM0/AS1C07_001T12_9000005372_38311cztM0_level2.fits | modeM0/AS1C07_001T12_9000005372_38311cztM0_level2_quad_clean.evt |
| Size (bytes) | 1,641,798,720 | 219,816,000 |
| Size | 1.5 GB | 209.6 MB |
| Events in quadrant A | 9,761,048 | 1,680,714 |
| Events in quadrant B | 7,712,558 | 1,736,390 |
| Events in quadrant C | 7,355,662 | 1,674,483 |
| Events in quadrant D | 34,741,738 | 489,634 |
| Mode SS | |||
|---|---|---|---|
| Quadrant | BADHDUFLAG | Total packets | Discarded packets |
| A | 0 | 320 | 0 |
| B | 0 | 320 | 0 |
| C | 0 | 320 | 0 |
| D | 0 | 320 | 0 |
| Mode M9 | |||
|---|---|---|---|
| Quadrant | BADHDUFLAG | Total packets | Discarded packets |
| A | 0 | 46 | 0 |
| B | 0 | 46 | 0 |
| C | 0 | 46 | 0 |
| D | 0 | 47 | 0 |
| Mode M0 | |||
|---|---|---|---|
| Quadrant | BADHDUFLAG | Total packets | Discarded packets |
| A | 0 | 38501 | 5 |
| B | 0 | 33479 | 4 |
| C | 0 | 31642 | 4 |
| D | 0 | 113846 | 4 |
| Quadrant | Total seconds | Saturated seconds | Saturation percentage |
|---|---|---|---|
| A | 15549 | 420 | 2.701138% |
| B | 15549 | 87 | 0.559522% |
| C | 15549 | 12 | 0.077175% |
| D | 15549 | 11280 | 72.544858% |
Noise dominated data is calculated using 1-second bins in cleaned event files. If a bin has >2000 counts, and if more than 50% of those come from <1% of pixels, then it is considered to be noise-dominated and hence unusable.
| Quadrant | # 1 sec bins | Bins with >0 counts | Bins with >2000 counts | High rate bins dominated by noise | Noise dominated (total time) | Noise dominated (detector-on time) | Marked lightcurve |
|---|---|---|---|---|---|---|---|
| A | 19757 | 15552 | 324 | 324 | 1.64% | 2.08% | 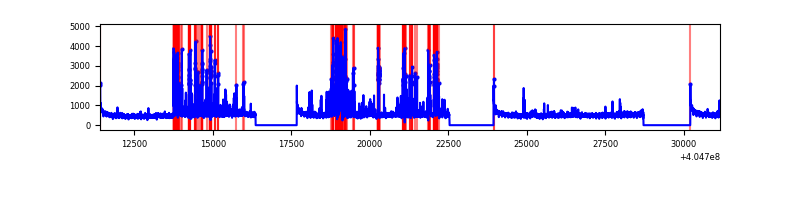 |
| B | 19757 | 15552 | 48 | 48 | 0.24% | 0.31% | 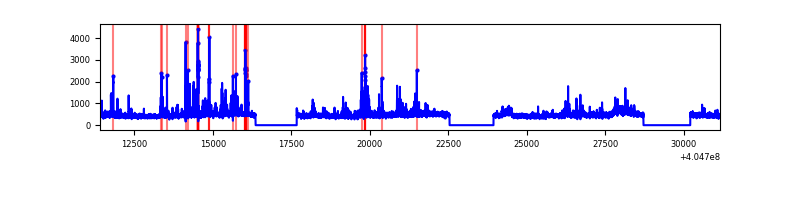 |
| C | 19757 | 15552 | 5 | 5 | 0.03% | 0.03% | 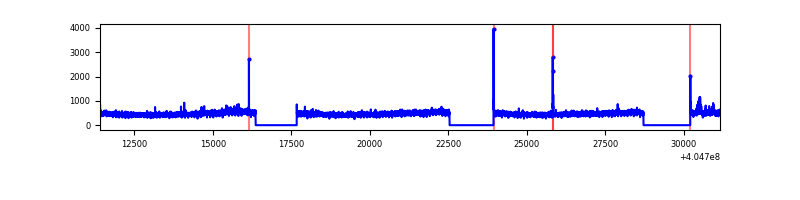 |
| D | 19757 | 15551 | 11247 | 11247 | 56.93% | 72.32% | 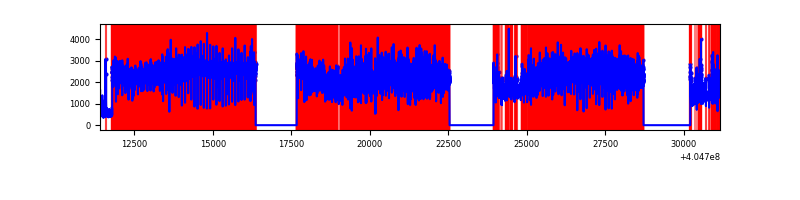 |
Top three noisy pixels from each quadrant. If the there are fewer than three noisy pixels in the level2.evt file, extra rows are filled as -1
| Pixel properties | Quadrant properties | ||||||
|---|---|---|---|---|---|---|---|
| Quadrant | DetID | PixID | Counts | Sigma | Mean | Median | Sigma |
| A | 13 | 248 | 1806038 | 5290.63 | 1710 | 1677 | 341.0 |
| A | 10 | 83 | 1027576 | 3008.08 | 1710 | 1677 | 341.0 |
| A | 12 | 189 | 123193 | 356.3 | 1710 | 1677 | 341.0 |
| B | 0 | 183 | 265918 | 815.7 | 1707 | 1661 | 324.0 |
| B | 0 | 229 | 255349 | 783.07 | 1707 | 1661 | 324.0 |
| B | 5 | 172 | 212507 | 650.83 | 1707 | 1661 | 324.0 |
| C | 15 | 214 | 655475 | 1688.7 | 1676 | 1685 | 387.2 |
| C | 14 | 254 | 72542 | 183.02 | 1676 | 1685 | 387.2 |
| C | 14 | 67 | 37203 | 91.74 | 1676 | 1685 | 387.2 |
| D | 10 | 203 | 20212617 | 69981.69 | 1201 | 1164 | 288.8 |
| D | 2 | 16 | 4723548 | 16351.14 | 1201 | 1164 | 288.8 |
| D | 12 | 235 | 4242065 | 14684.02 | 1201 | 1164 | 288.8 |
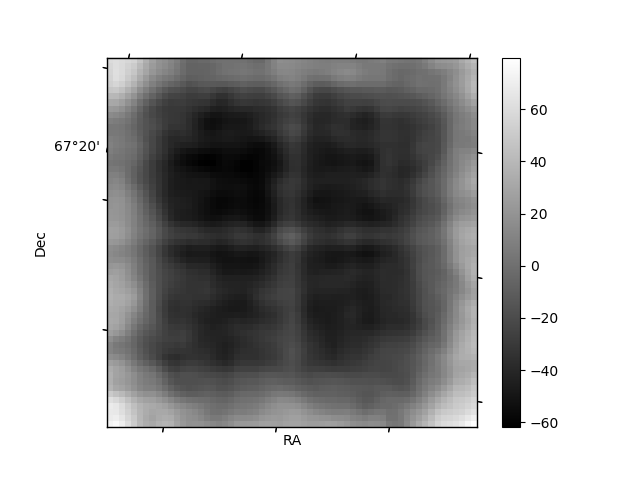
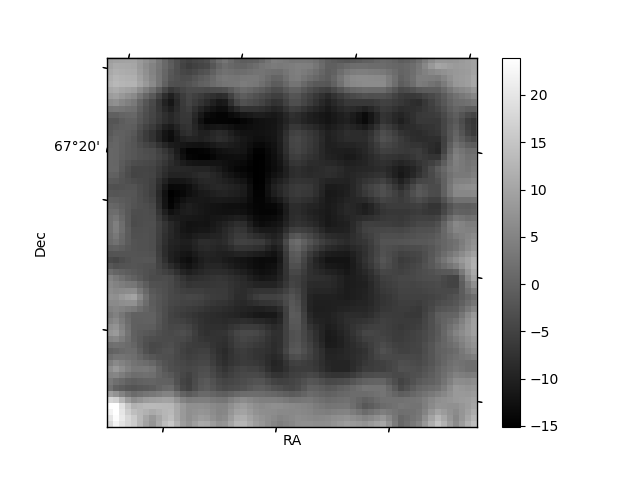
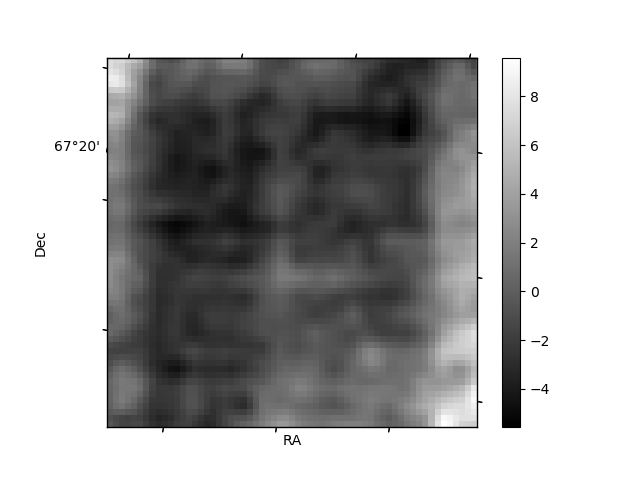
Histogram calculated using DETX and DETY for each event in the final _common_clean file
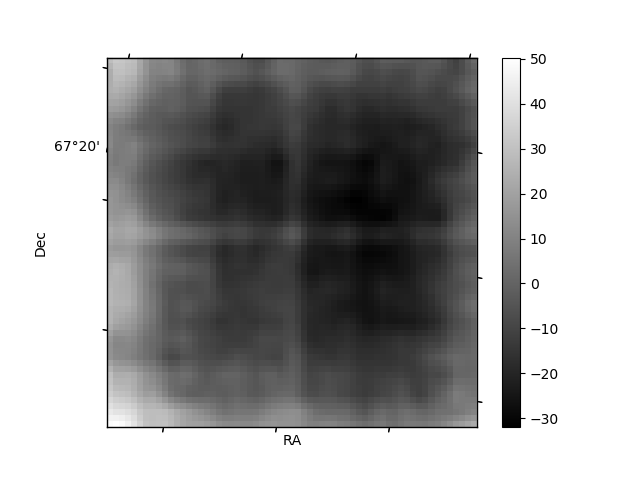
| Quadrant A | 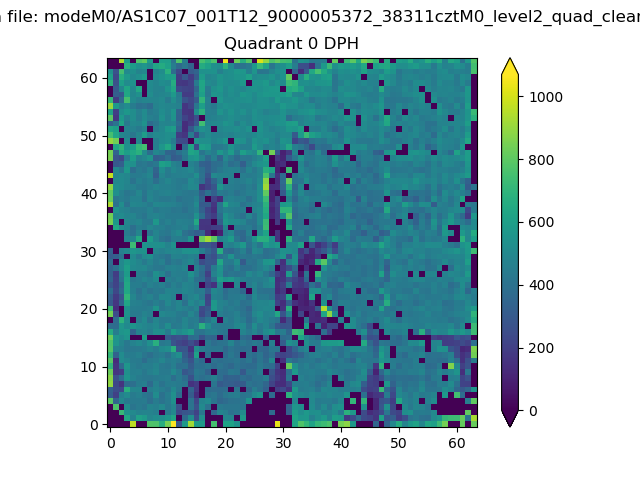 |
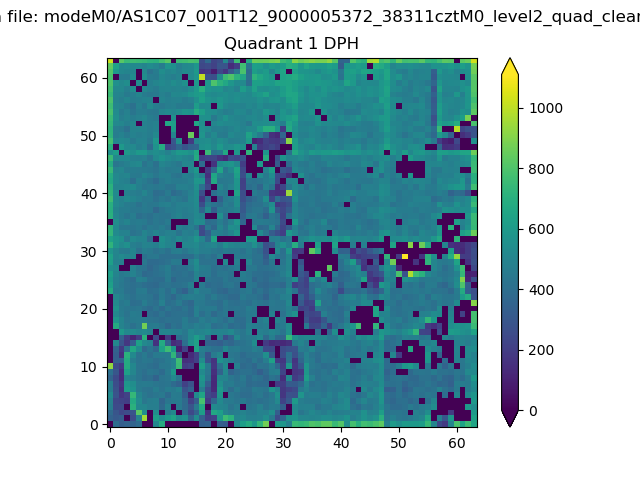 |
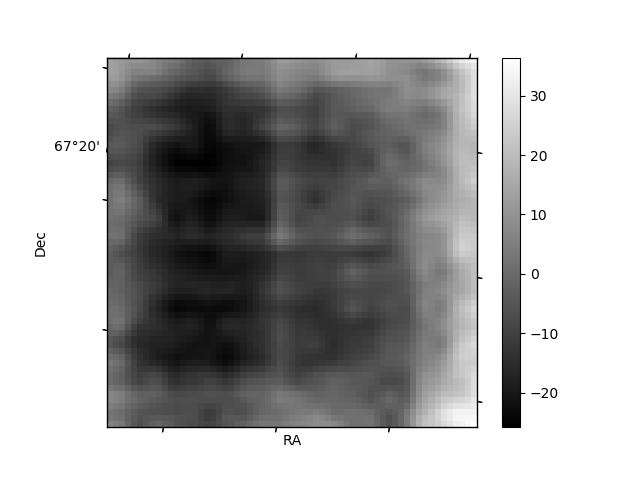
Quadrant B |
|---|---|---|---|
| Quadrant D | 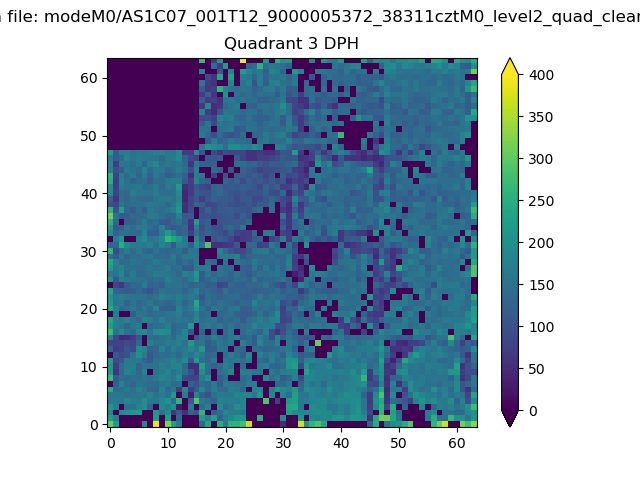 |
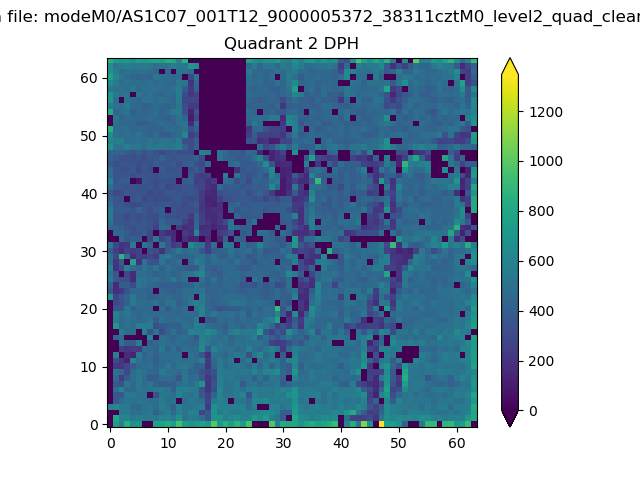 |
Quadrant C |
| Plot type | Count rate plots | Images |
|---|---|---|
| Comparison with Poisson distribution Blue bars denote a histogram of data divided into 1 sec bins. Red curve is a Poisson curve with rate = median count rate of data. |
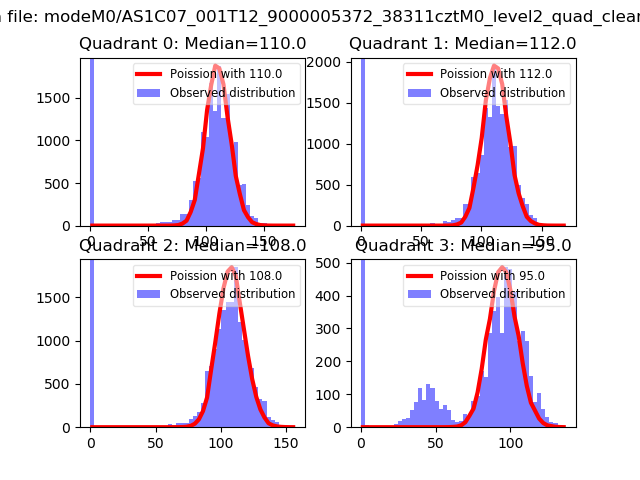 |
 |
| Quadrant-wise count rates Data is divided into 100 sec bins |
 |
|
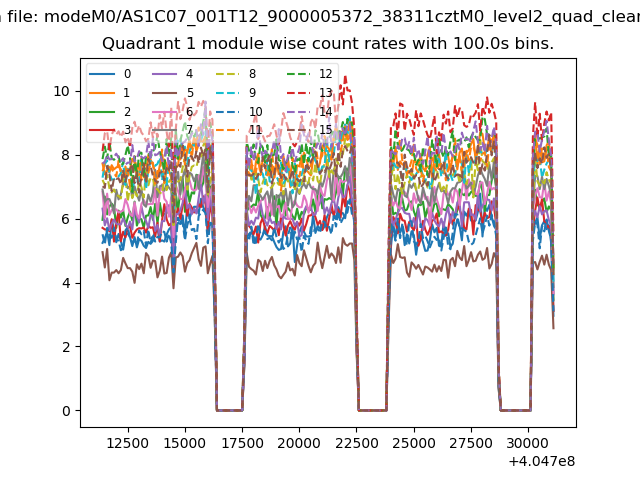
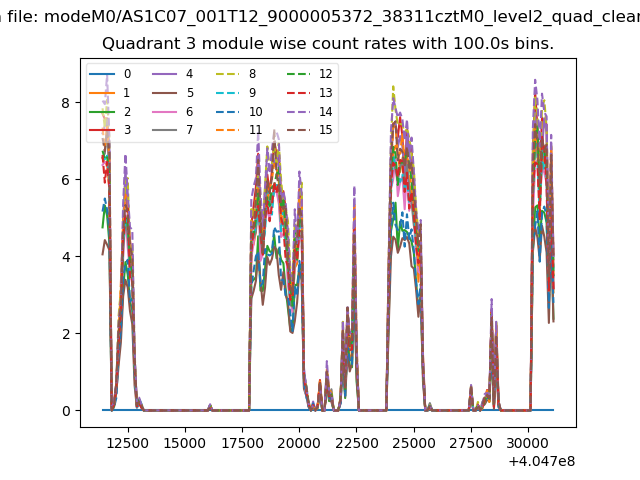
| Module-wise count rates for Quadrant A Data is divided into 100 sec bins |
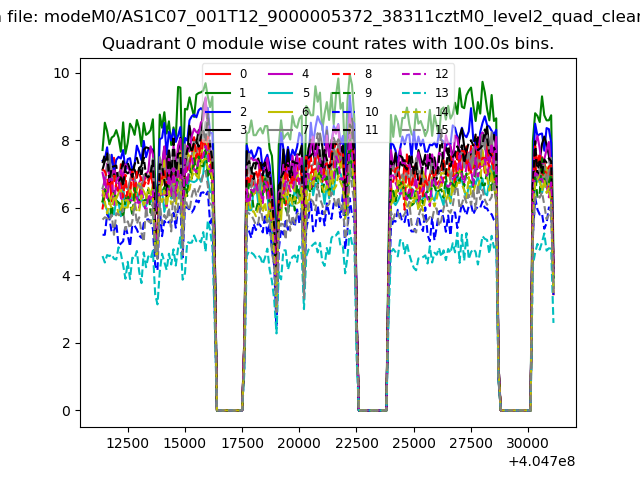 |
 |
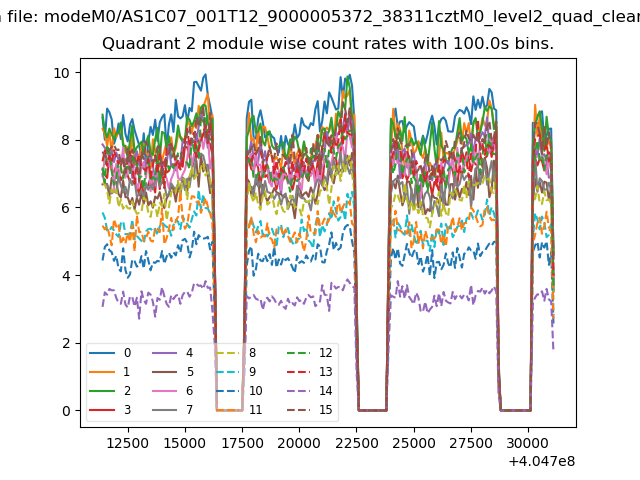
| Module-wise count rates for Quadrant B Data is divided into 100 sec bins |
 |
 |
| Module-wise count rates for Quadrant C Data is divided into 100 sec bins |
 |
 |
| Module-wise count rates for Quadrant D Data is divided into 100 sec bins |
 |
 |
| Parameter | Plot |
|---|---|
| CZT HV Monitor | 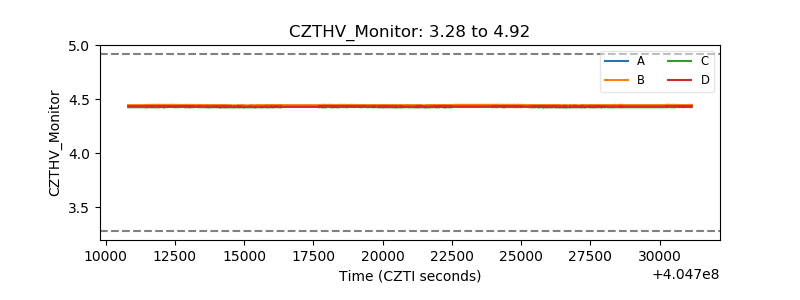 |
| D_VDD | 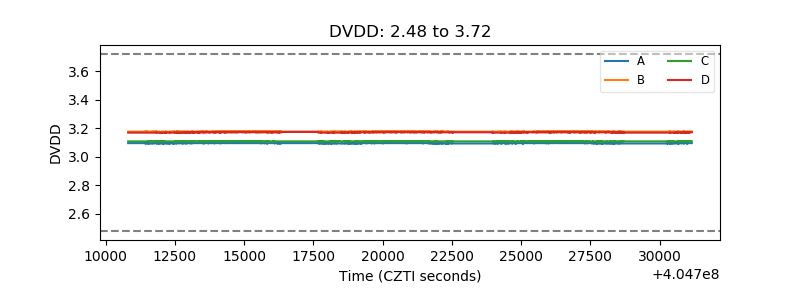 |
| Temperature 1 | 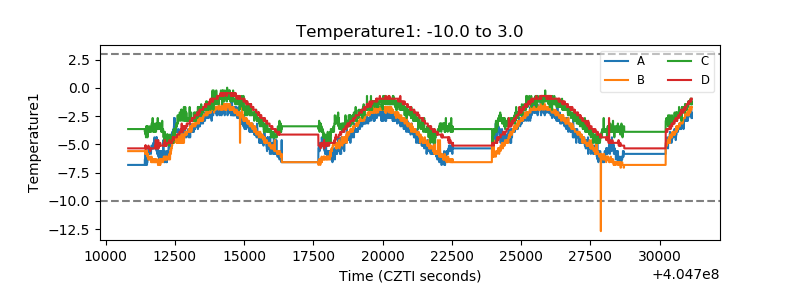 |
| Veto HV Monitor | 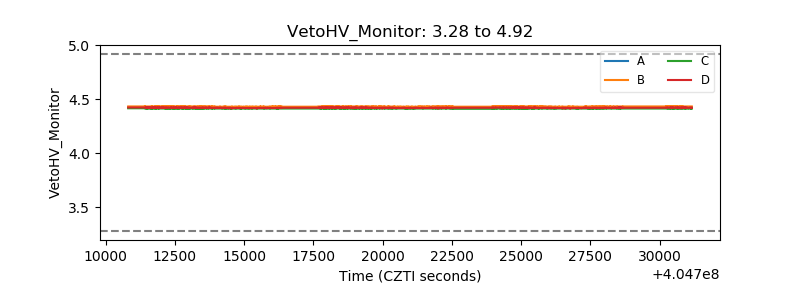 |
| Veto LLD | 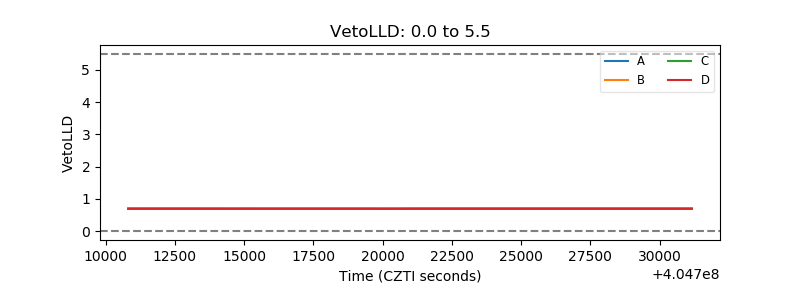 |
| Alpha Counter | 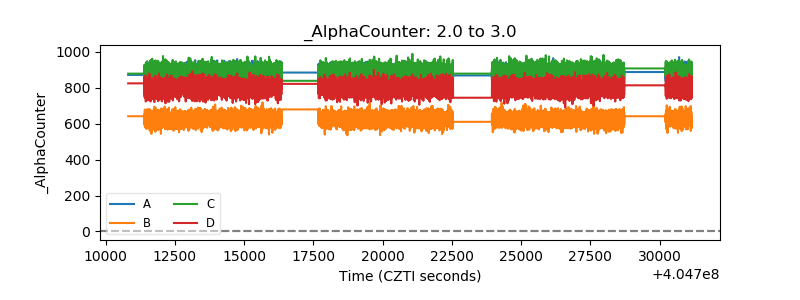 |
| _CPM_Rate | 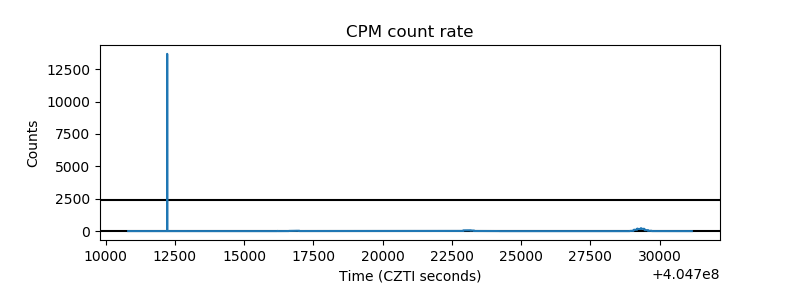 |
| CZT Counter | 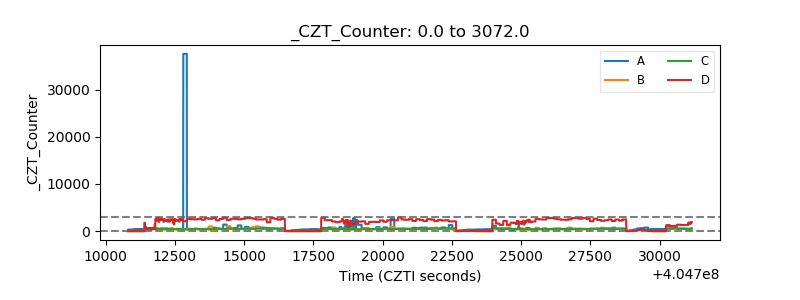 |
| +2.5 Volts monitor | 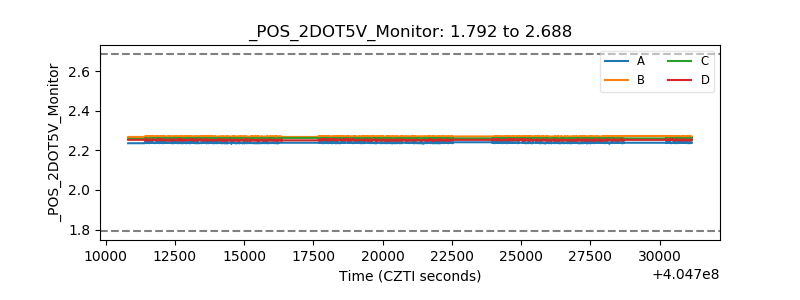 |
| +5 Volts monitor | 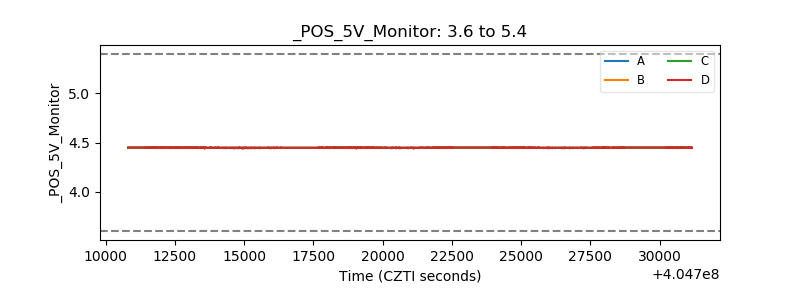 |
| _ROLL_ROT | 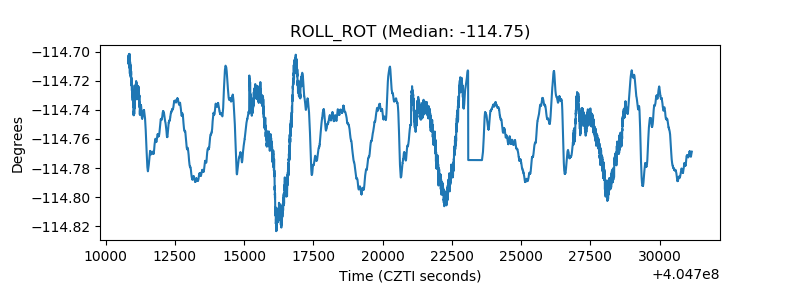 |
| _Roll_DEC | 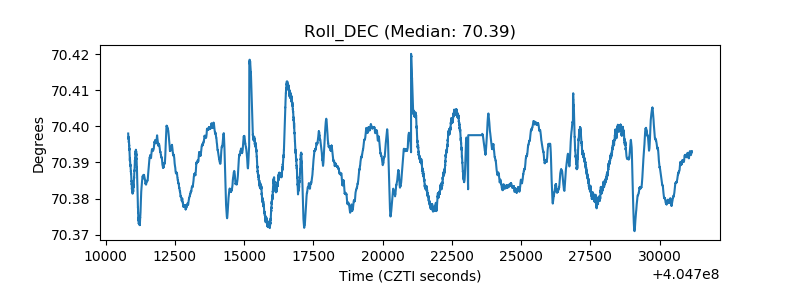 |
| _Roll_RA | 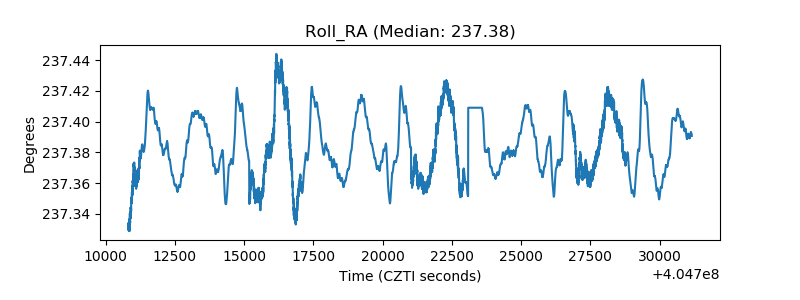 |
| Veto Counter | 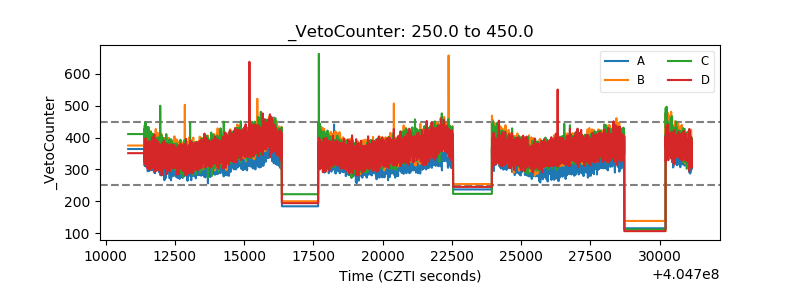 |