| Param | Original file | Final file |
|---|---|---|
| Filename | modeM0/AS1C07_001T12_9000005372_38312cztM0_level2.fits | modeM0/AS1C07_001T12_9000005372_38312cztM0_level2_quad_clean.evt |
| Size (bytes) | 537,975,360 | 84,476,160 |
| Size | 513.1 MB | 80.6 MB |
| Events in quadrant A | 2,965,628 | 624,356 |
| Events in quadrant B | 2,693,761 | 632,699 |
| Events in quadrant C | 2,715,440 | 598,502 |
| Events in quadrant D | 11,110,518 | 315,722 |
| Mode SS | |||
|---|---|---|---|
| Quadrant | BADHDUFLAG | Total packets | Discarded packets |
| A | 0 | 114 | 0 |
| B | 0 | 114 | 0 |
| C | 0 | 114 | 0 |
| D | 0 | 114 | 0 |
| Mode M9 | |||
|---|---|---|---|
| Quadrant | BADHDUFLAG | Total packets | Discarded packets |
| A | 0 | 20 | 0 |
| B | 0 | 20 | 0 |
| C | 0 | 20 | 0 |
| D | 0 | 21 | 0 |
| Mode M0 | |||
|---|---|---|---|
| Quadrant | BADHDUFLAG | Total packets | Discarded packets |
| A | 0 | 12170 | 3 |
| B | 0 | 11684 | 2 |
| C | 0 | 11461 | 2 |
| D | 0 | 36796 | 2 |
| Quadrant | Total seconds | Saturated seconds | Saturation percentage |
|---|---|---|---|
| A | 5516 | 18 | 0.326323% |
| B | 5516 | 14 | 0.253807% |
| C | 5516 | 16 | 0.290065% |
| D | 5516 | 2849 | 51.649746% |
Noise dominated data is calculated using 1-second bins in cleaned event files. If a bin has >2000 counts, and if more than 50% of those come from <1% of pixels, then it is considered to be noise-dominated and hence unusable.
| Quadrant | # 1 sec bins | Bins with >0 counts | Bins with >2000 counts | High rate bins dominated by noise | Noise dominated (total time) | Noise dominated (detector-on time) | Marked lightcurve |
|---|---|---|---|---|---|---|---|
| A | 7159 | 5517 | 7 | 7 | 0.10% | 0.13% | 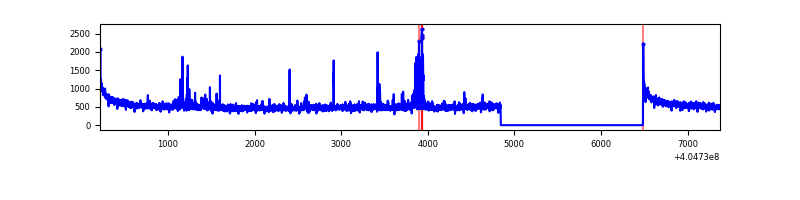 |
| B | 7159 | 5517 | 5 | 5 | 0.07% | 0.09% | 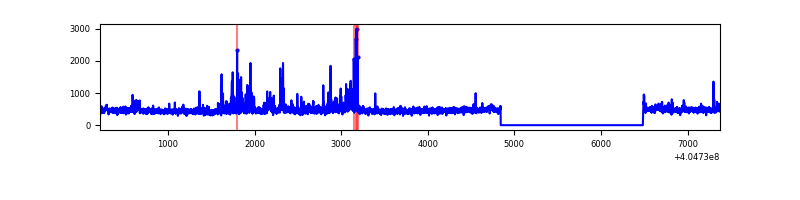 |
| C | 7159 | 5517 | 13 | 13 | 0.18% | 0.24% | 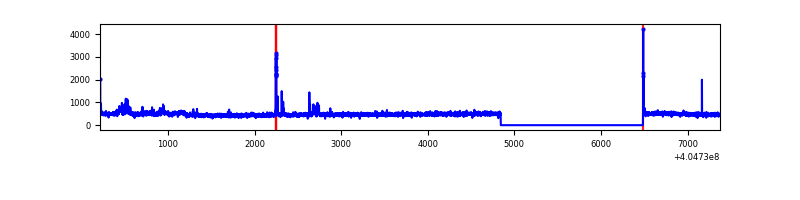 |
| D | 7159 | 5517 | 2998 | 2998 | 41.88% | 54.34% | 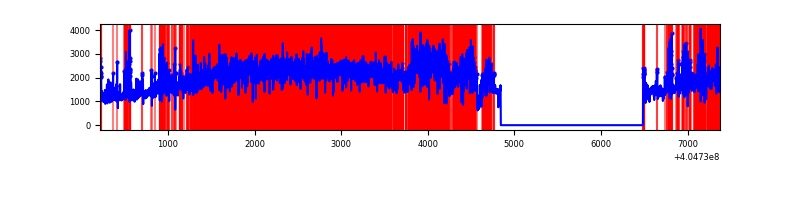 |
Top three noisy pixels from each quadrant. If the there are fewer than three noisy pixels in the level2.evt file, extra rows are filled as -1
| Pixel properties | Quadrant properties | ||||||
|---|---|---|---|---|---|---|---|
| Quadrant | DetID | PixID | Counts | Sigma | Mean | Median | Sigma |
| A | 10 | 83 | 409907 | 3308.64 | 613 | 600 | 123.7 |
| A | 12 | 189 | 120370 | 968.16 | 613 | 600 | 123.7 |
| A | 13 | 248 | 32169 | 255.19 | 613 | 600 | 123.7 |
| B | 0 | 229 | 180747 | 1550.14 | 607 | 589 | 116.2 |
| B | 0 | 183 | 55494 | 472.42 | 607 | 589 | 116.2 |
| B | 15 | 32 | 33635 | 284.34 | 607 | 589 | 116.2 |
| C | 15 | 214 | 236648 | 1712.38 | 594 | 598 | 137.8 |
| C | 14 | 254 | 74105 | 533.24 | 594 | 598 | 137.8 |
| C | 5 | 250 | 46978 | 336.45 | 594 | 598 | 137.8 |
| D | 10 | 203 | 6191875 | 48869.2 | 520 | 504 | 126.7 |
| D | 2 | 16 | 1321394 | 10425.93 | 520 | 504 | 126.7 |
| D | 12 | 235 | 1159259 | 9146.18 | 520 | 504 | 126.7 |
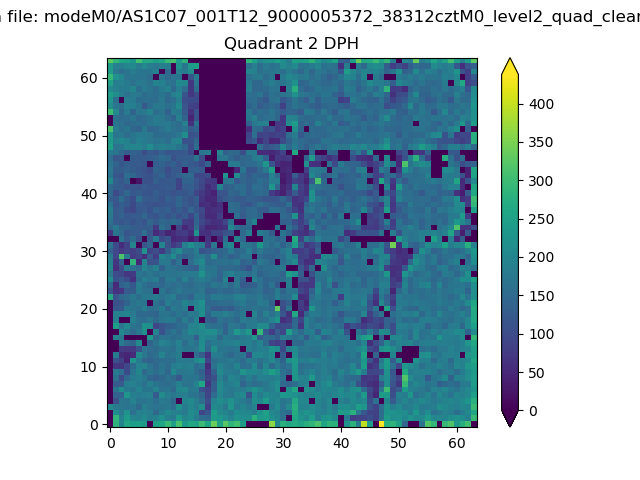
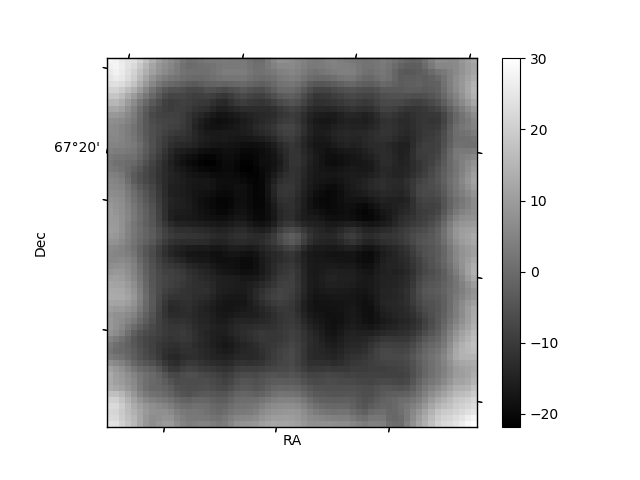
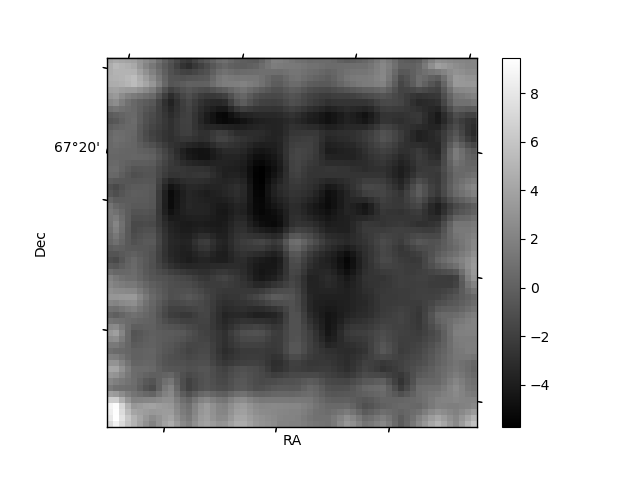
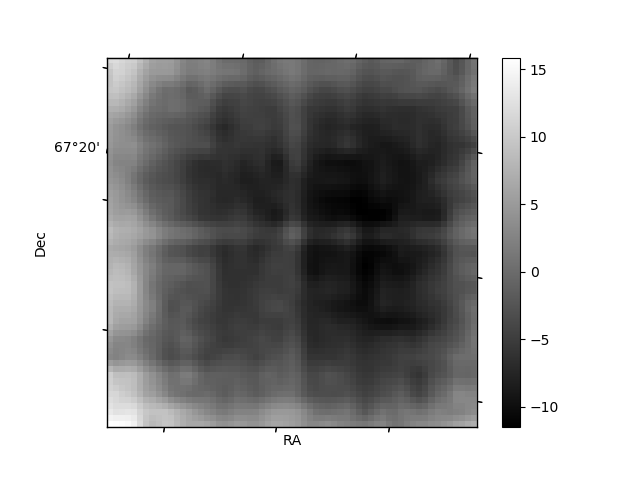
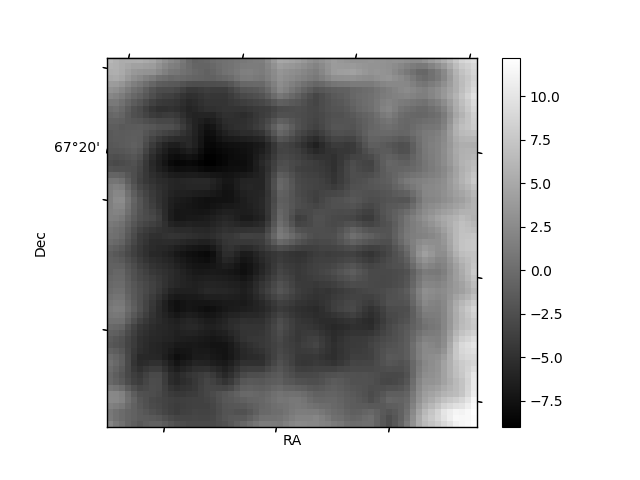
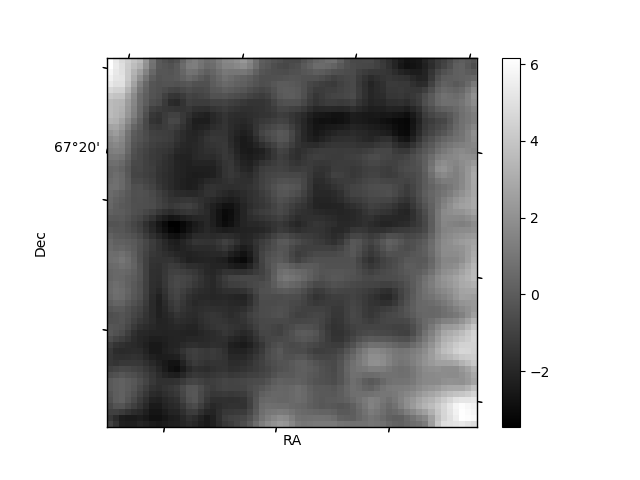
Histogram calculated using DETX and DETY for each event in the final _common_clean file
| Quadrant A | 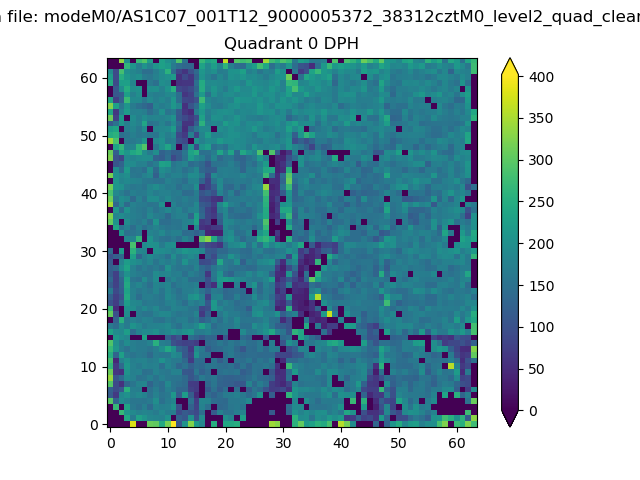 |
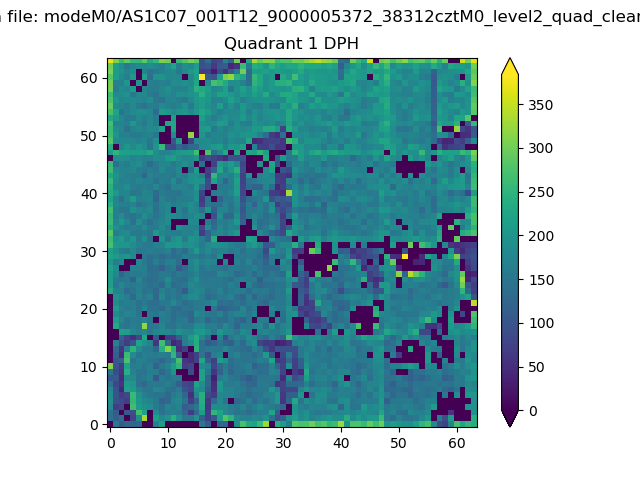 |
Quadrant B |
|---|---|---|---|
| Quadrant D | 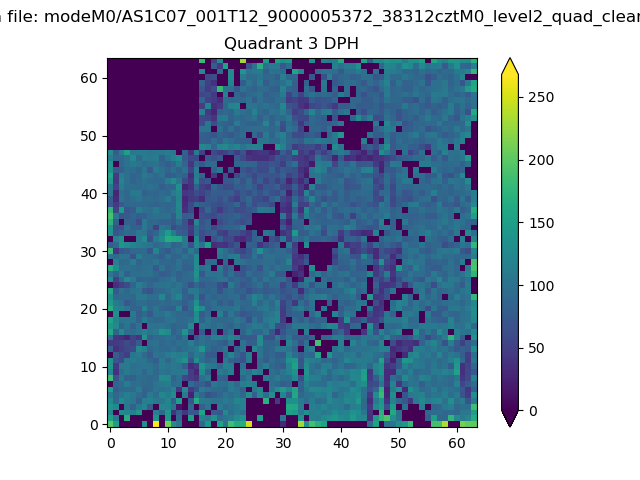 |
 |
Quadrant C |
| Plot type | Count rate plots | Images |
|---|---|---|
| Comparison with Poisson distribution Blue bars denote a histogram of data divided into 1 sec bins. Red curve is a Poisson curve with rate = median count rate of data. |
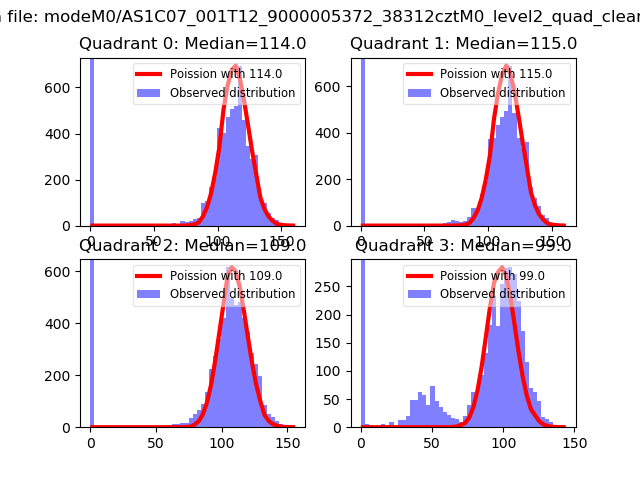 |
 |
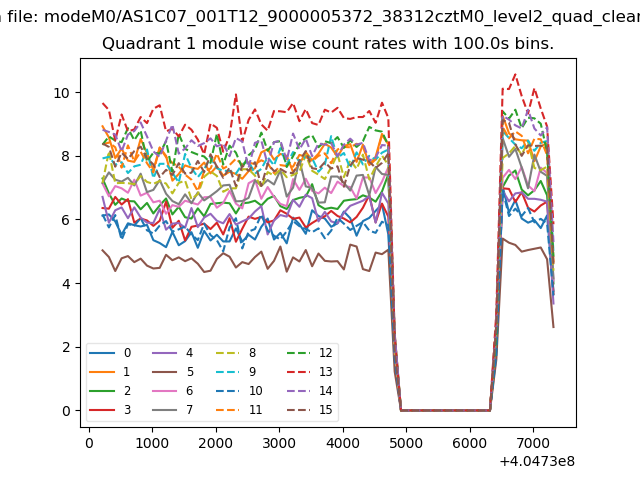
| Quadrant-wise count rates Data is divided into 100 sec bins |
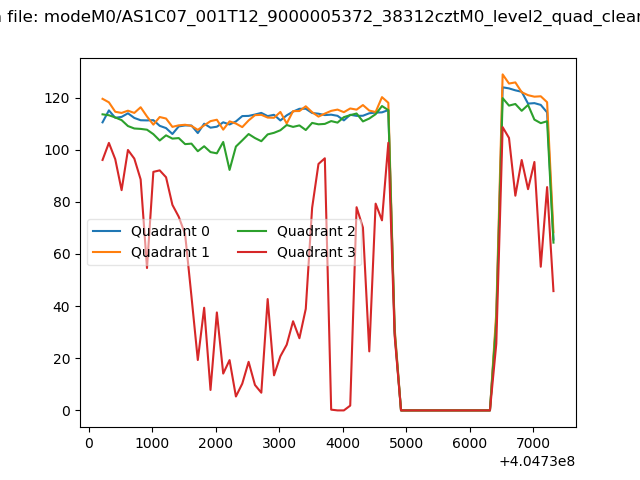 |
|
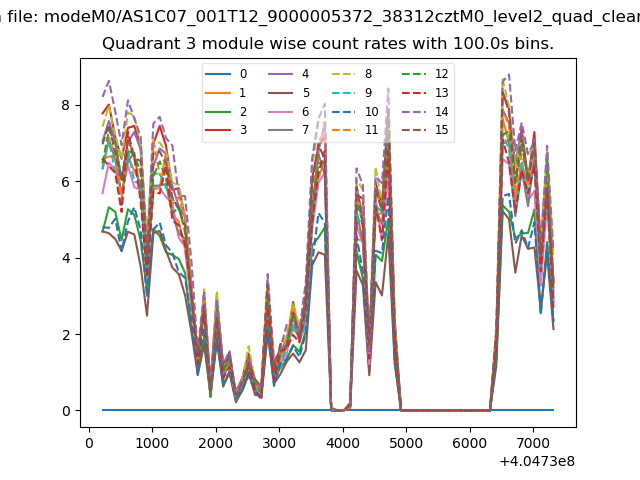
| Module-wise count rates for Quadrant A Data is divided into 100 sec bins |
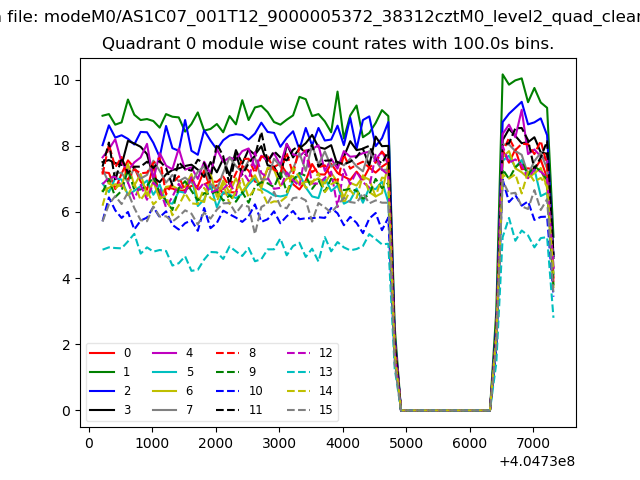 |
 |
| Module-wise count rates for Quadrant B Data is divided into 100 sec bins |
 |
 |
| Module-wise count rates for Quadrant C Data is divided into 100 sec bins |
 |
 |
| Module-wise count rates for Quadrant D Data is divided into 100 sec bins |
 |
 |
| Parameter | Plot |
|---|---|
| CZT HV Monitor | 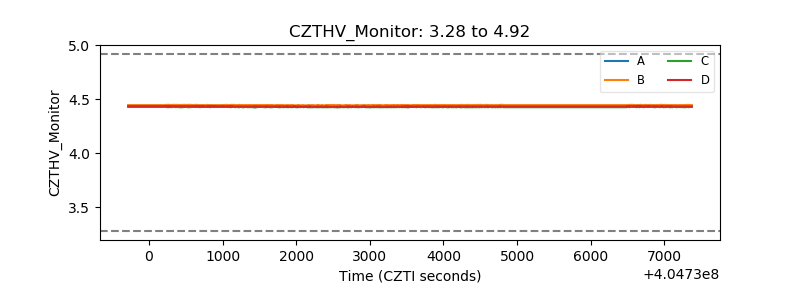 |
| D_VDD | 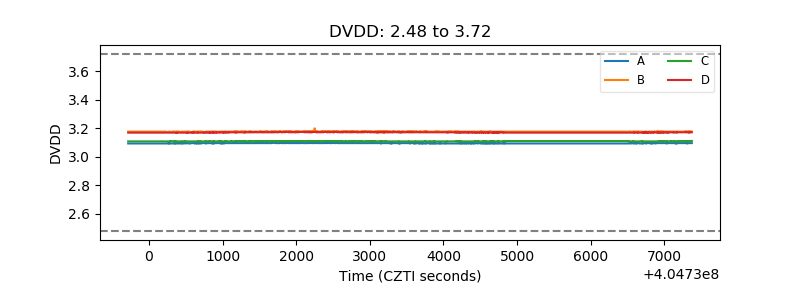 |
| Temperature 1 | 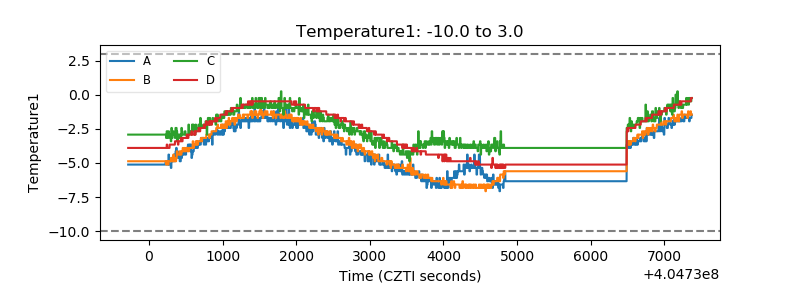 |
| Veto HV Monitor |  |
| Veto LLD | 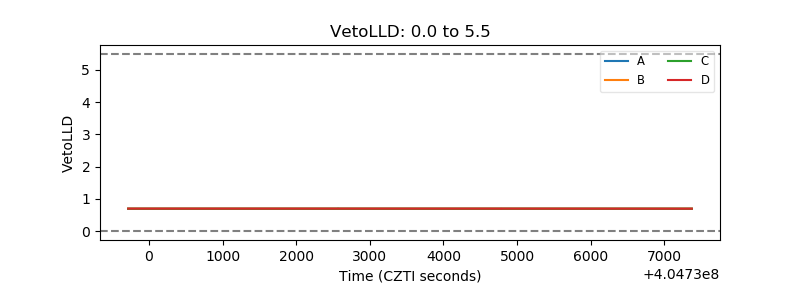 |
| Alpha Counter | 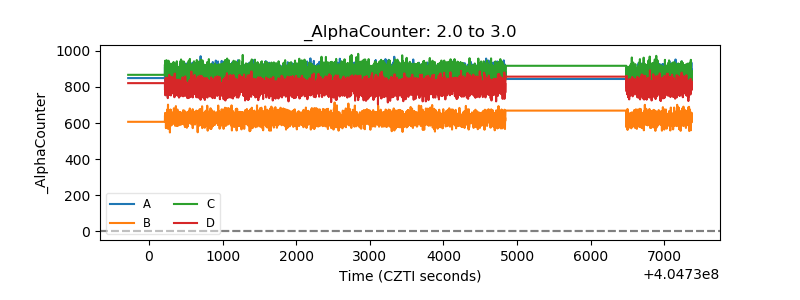 |
| _CPM_Rate | 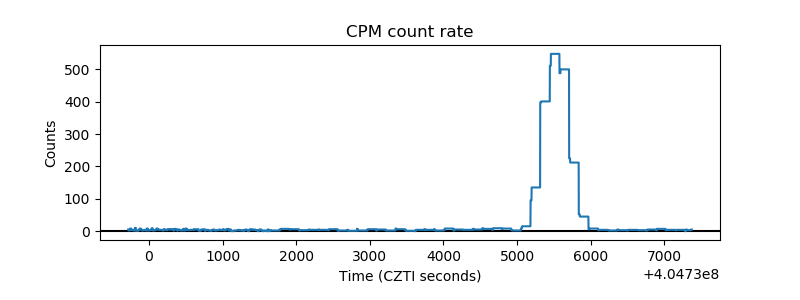 |
| CZT Counter | 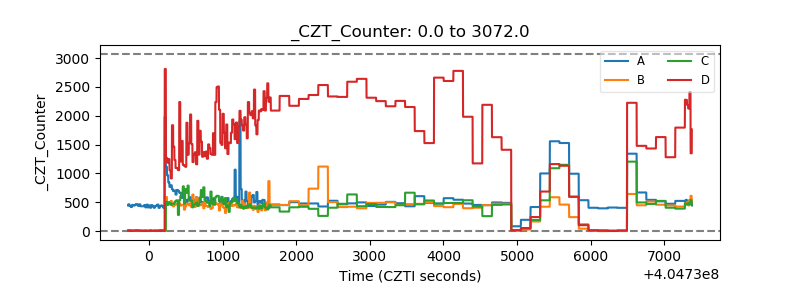 |
| +2.5 Volts monitor | 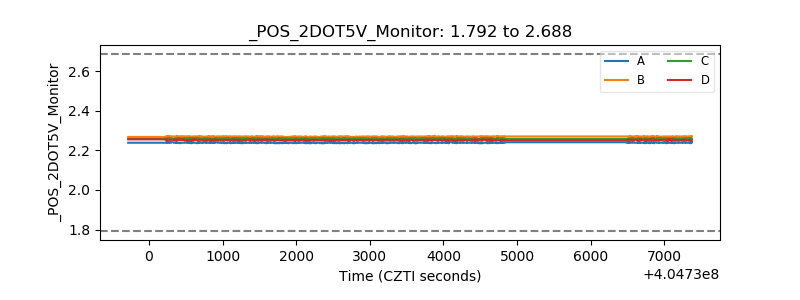 |
| +5 Volts monitor | 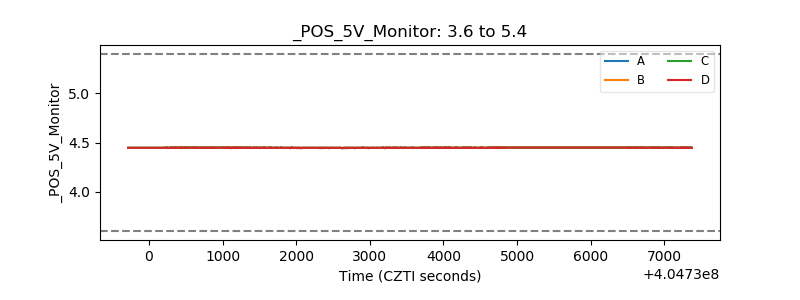 |
| _ROLL_ROT | 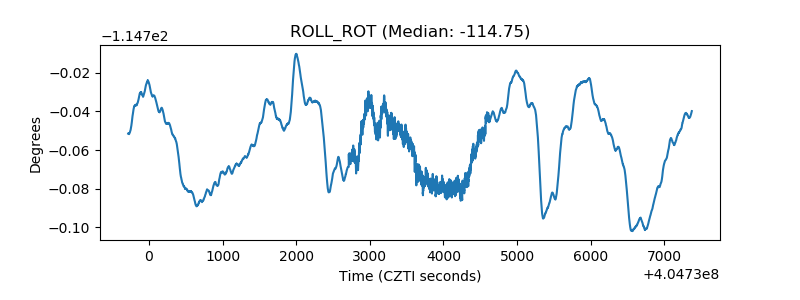 |
| _Roll_DEC | 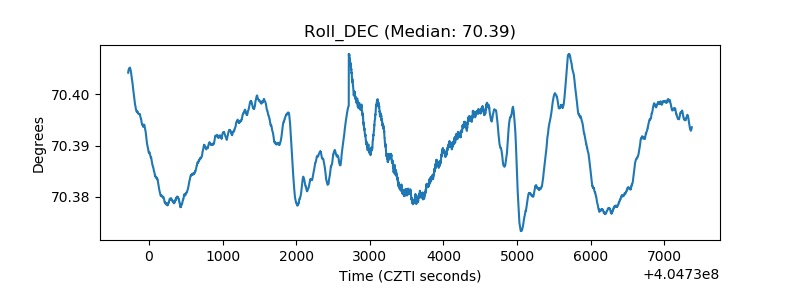 |
| _Roll_RA | 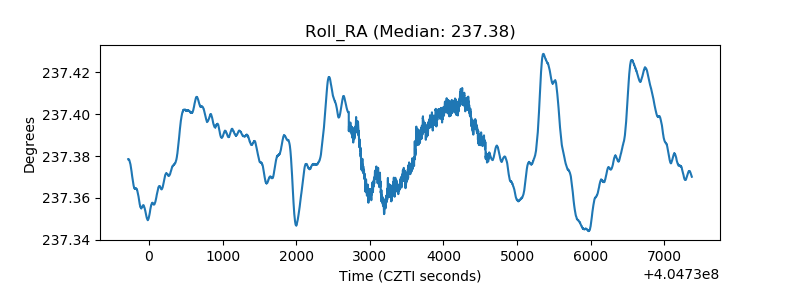 |
| Veto Counter | 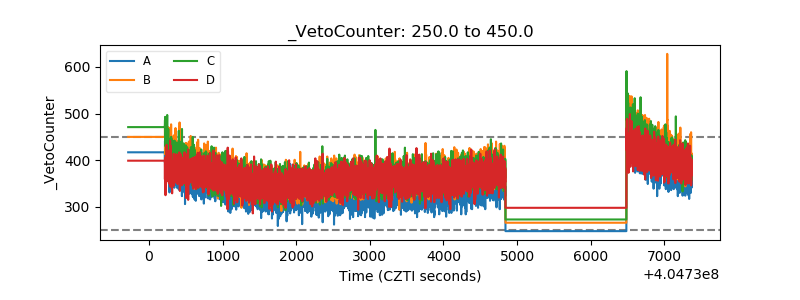 |