| Param | Original file | Final file |
|---|---|---|
| Filename | modeM0/AS1C07_001T12_9000005372_38314cztM0_level2.fits | modeM0/AS1C07_001T12_9000005372_38314cztM0_level2_quad_clean.evt |
| Size (bytes) | 523,860,480 | 84,162,240 |
| Size | 499.6 MB | 80.3 MB |
| Events in quadrant A | 2,813,241 | 629,121 |
| Events in quadrant B | 2,551,350 | 635,435 |
| Events in quadrant C | 2,614,077 | 604,514 |
| Events in quadrant D | 10,995,695 | 303,752 |
| Mode SS | |||
|---|---|---|---|
| Quadrant | BADHDUFLAG | Total packets | Discarded packets |
| A | 0 | 108 | 0 |
| B | 0 | 108 | 0 |
| C | 0 | 108 | 0 |
| D | 0 | 108 | 0 |
| Mode M9 | |||
|---|---|---|---|
| Quadrant | BADHDUFLAG | Total packets | Discarded packets |
| A | 0 | 20 | 0 |
| B | 0 | 20 | 0 |
| C | 0 | 20 | 0 |
| D | 0 | 21 | 0 |
| Mode M0 | |||
|---|---|---|---|
| Quadrant | BADHDUFLAG | Total packets | Discarded packets |
| A | 0 | 11642 | 3 |
| B | 0 | 11138 | 2 |
| C | 0 | 11022 | 2 |
| D | 0 | 36382 | 2 |
| Quadrant | Total seconds | Saturated seconds | Saturation percentage |
|---|---|---|---|
| A | 5366 | 12 | 0.223630% |
| B | 5366 | 37 | 0.689527% |
| C | 5366 | 23 | 0.428625% |
| D | 5366 | 2867 | 53.428997% |
Noise dominated data is calculated using 1-second bins in cleaned event files. If a bin has >2000 counts, and if more than 50% of those come from <1% of pixels, then it is considered to be noise-dominated and hence unusable.
| Quadrant | # 1 sec bins | Bins with >0 counts | Bins with >2000 counts | High rate bins dominated by noise | Noise dominated (total time) | Noise dominated (detector-on time) | Marked lightcurve |
|---|---|---|---|---|---|---|---|
| A | 7129 | 5367 | 4 | 4 | 0.06% | 0.07% | 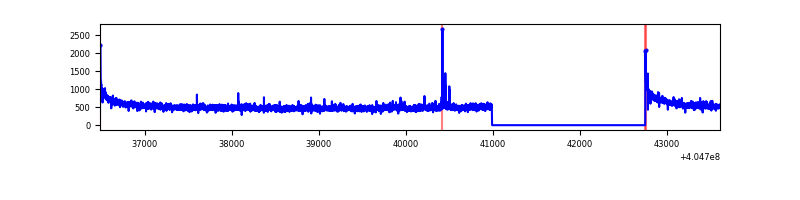 |
| B | 7129 | 5367 | 21 | 21 | 0.29% | 0.39% | 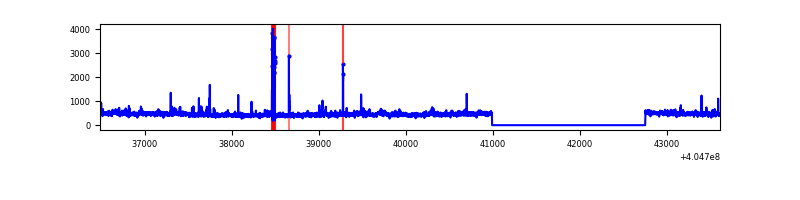 |
| C | 7129 | 5367 | 14 | 14 | 0.20% | 0.26% |  |
| D | 7129 | 5367 | 3023 | 3023 | 42.40% | 56.33% | 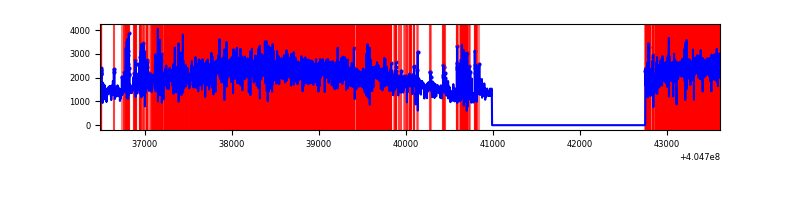 |
Top three noisy pixels from each quadrant. If the there are fewer than three noisy pixels in the level2.evt file, extra rows are filled as -1
| Pixel properties | Quadrant properties | ||||||
|---|---|---|---|---|---|---|---|
| Quadrant | DetID | PixID | Counts | Sigma | Mean | Median | Sigma |
| A | 10 | 83 | 407692 | 3358.08 | 603 | 590 | 121.2 |
| A | 9 | 143 | 26292 | 212.01 | 603 | 590 | 121.2 |
| A | 13 | 6 | 21201 | 170.02 | 603 | 590 | 121.2 |
| B | 5 | 184 | 86948 | 765.05 | 596 | 580 | 112.9 |
| B | 0 | 183 | 54392 | 476.67 | 596 | 580 | 112.9 |
| B | 0 | 229 | 27478 | 238.26 | 596 | 580 | 112.9 |
| C | 15 | 214 | 232957 | 1703.46 | 587 | 591 | 136.4 |
| C | 14 | 254 | 55064 | 399.34 | 587 | 591 | 136.4 |
| C | 0 | 10 | 20608 | 146.74 | 587 | 591 | 136.4 |
| D | 10 | 203 | 6809966 | 54515.75 | 513 | 498 | 124.9 |
| D | 2 | 16 | 1027578 | 8222.67 | 513 | 498 | 124.9 |
| D | 12 | 235 | 555834 | 4445.95 | 513 | 498 | 124.9 |
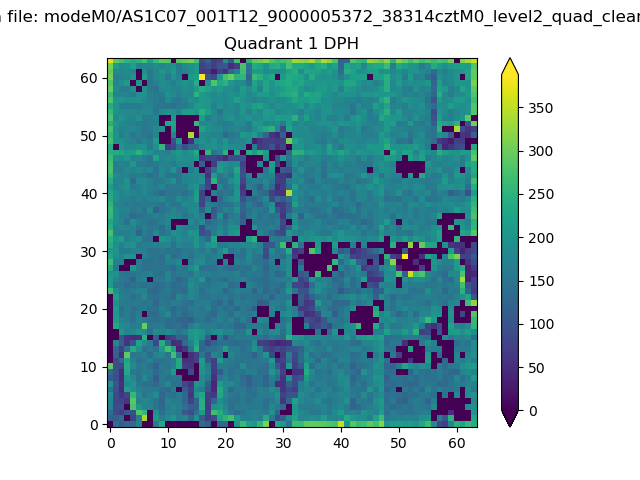
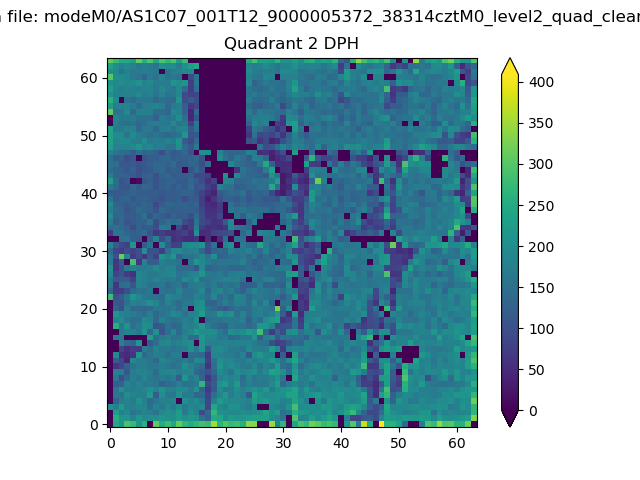
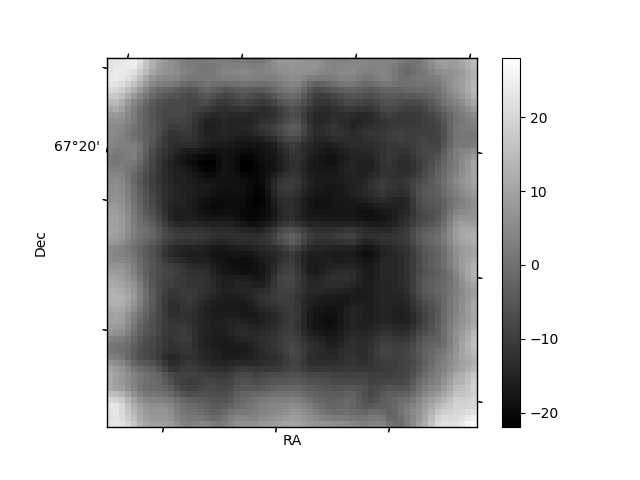
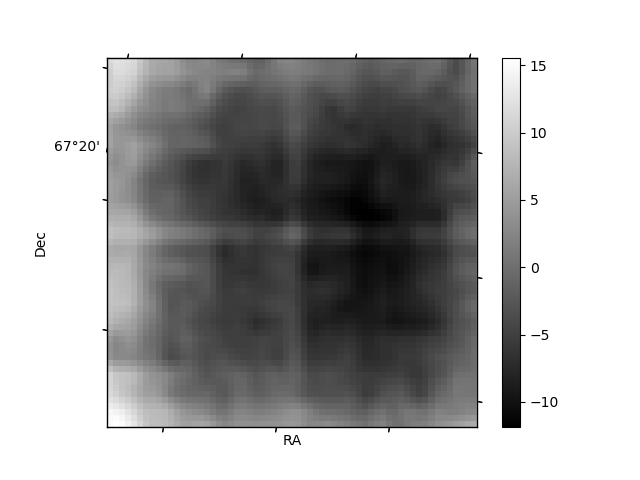
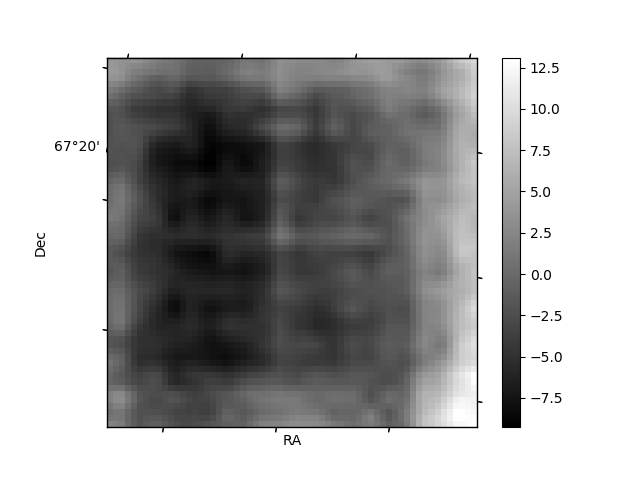
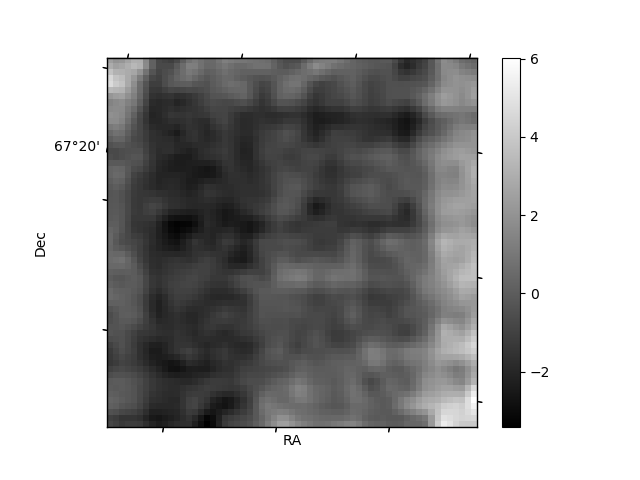
Histogram calculated using DETX and DETY for each event in the final _common_clean file
| Quadrant A | 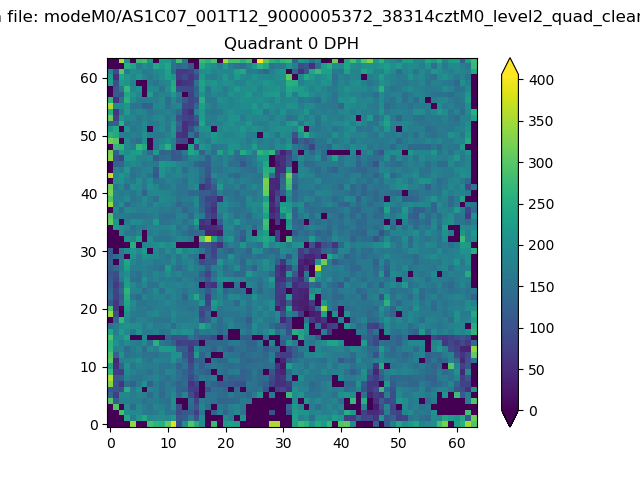 |
 |
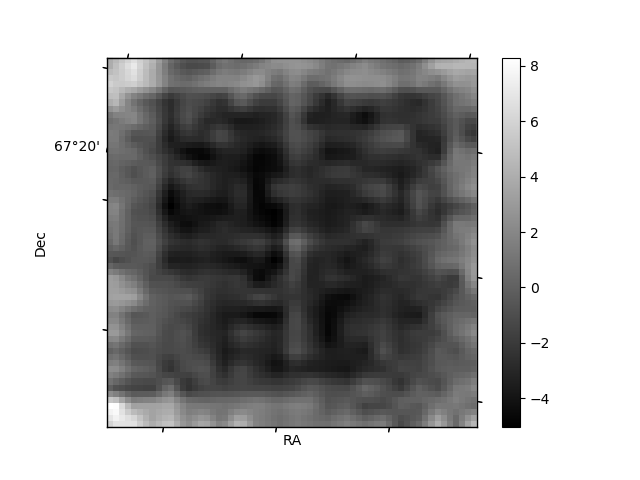
Quadrant B |
|---|---|---|---|
| Quadrant D | 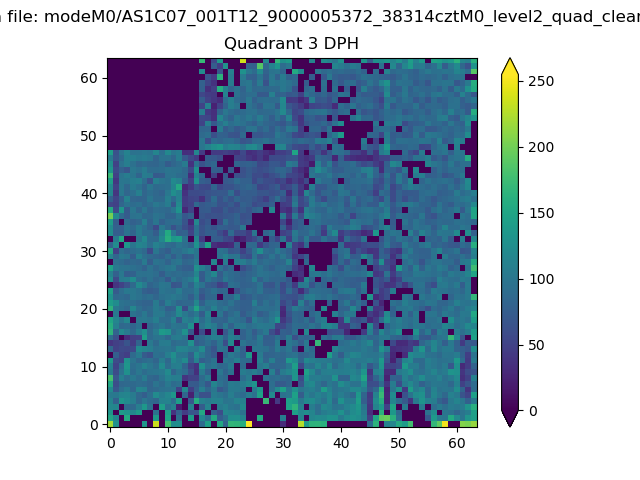 |
 |
Quadrant C |
| Plot type | Count rate plots | Images |
|---|---|---|
| Comparison with Poisson distribution Blue bars denote a histogram of data divided into 1 sec bins. Red curve is a Poisson curve with rate = median count rate of data. |
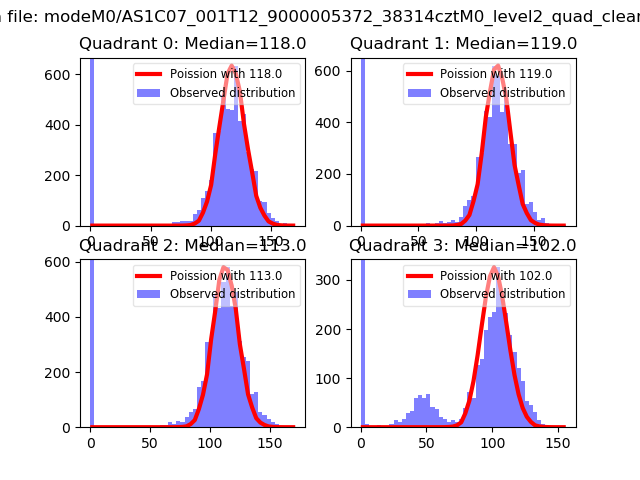 |
 |
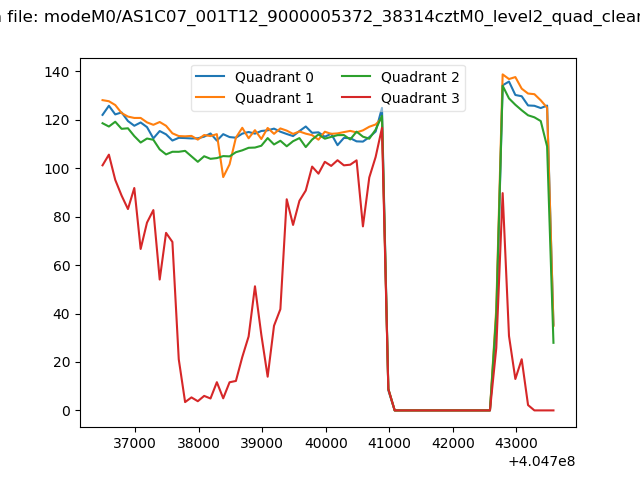
| Quadrant-wise count rates Data is divided into 100 sec bins |
 |
|
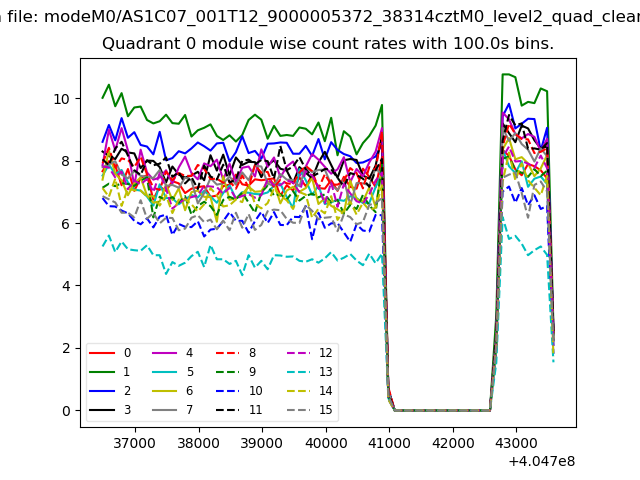
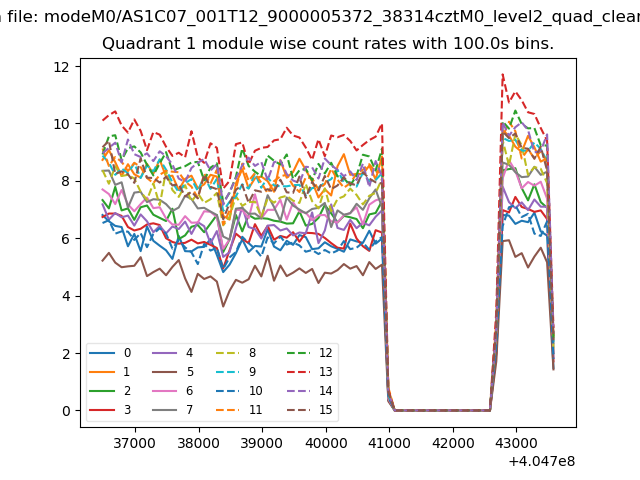
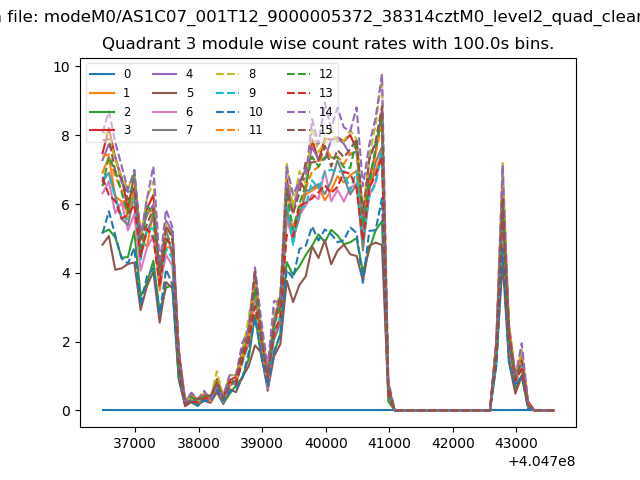
| Module-wise count rates for Quadrant A Data is divided into 100 sec bins |
 |
 |
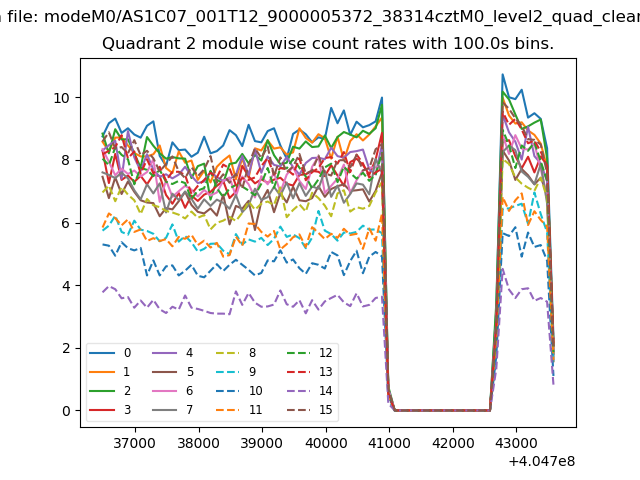
| Module-wise count rates for Quadrant B Data is divided into 100 sec bins |
 |
 |
| Module-wise count rates for Quadrant C Data is divided into 100 sec bins |
 |
 |
| Module-wise count rates for Quadrant D Data is divided into 100 sec bins |
 |
 |
| Parameter | Plot |
|---|---|
| CZT HV Monitor |  |
| D_VDD | 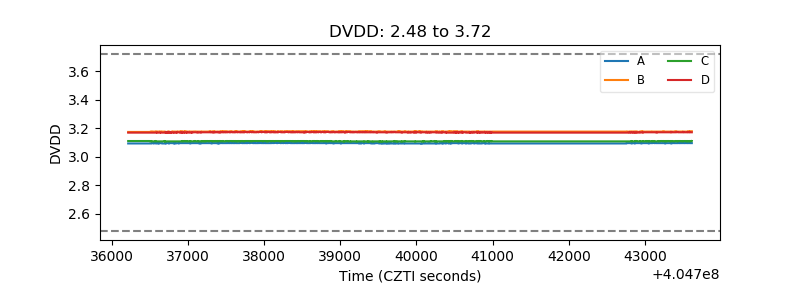 |
| Temperature 1 | 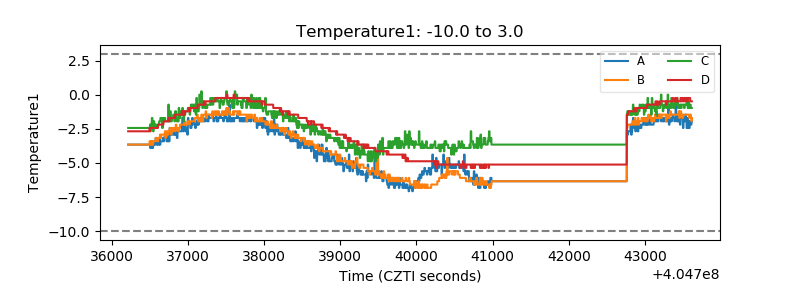 |
| Veto HV Monitor | 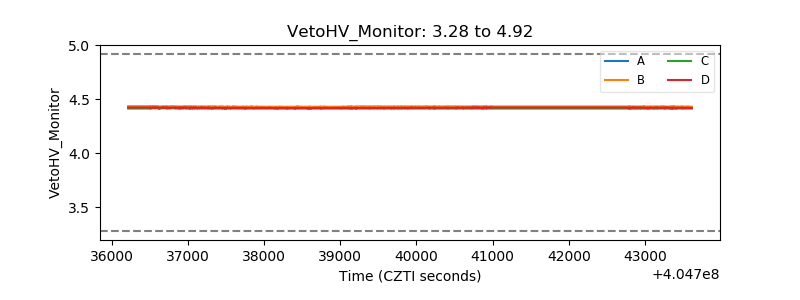 |
| Veto LLD | 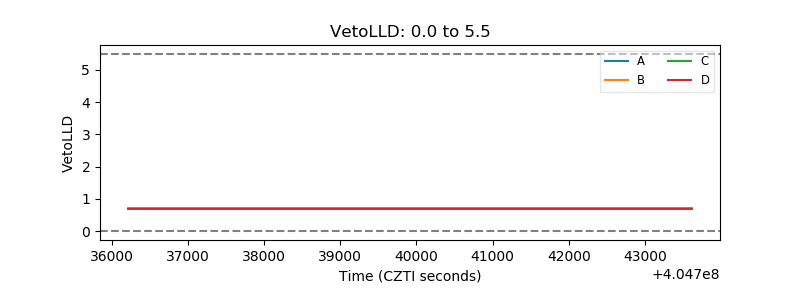 |
| Alpha Counter | 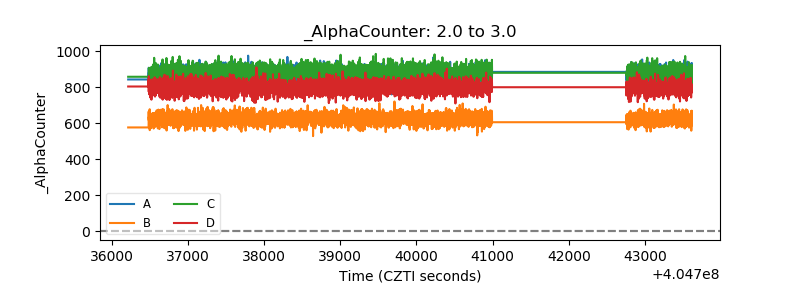 |
| _CPM_Rate | 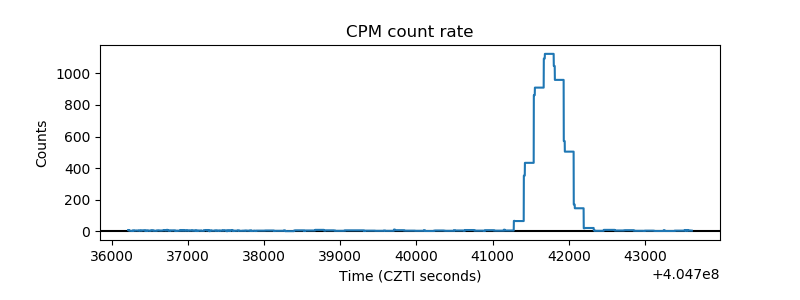 |
| CZT Counter | 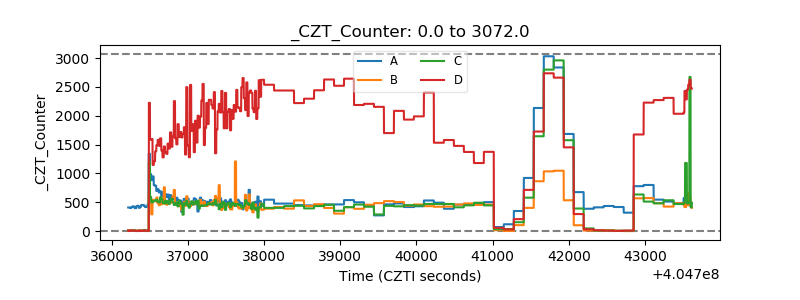 |
| +2.5 Volts monitor | 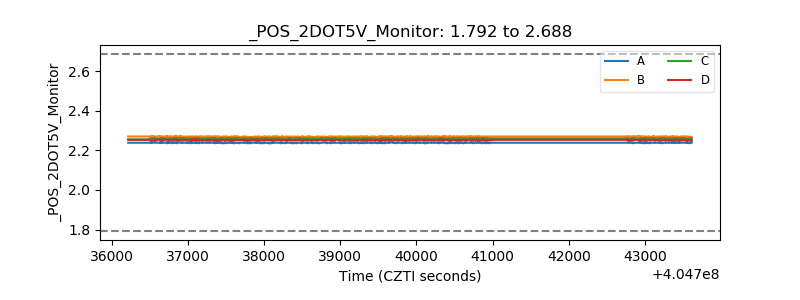 |
| +5 Volts monitor | 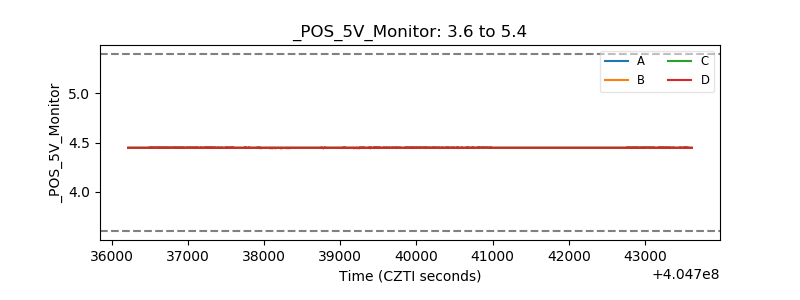 |
| _ROLL_ROT | 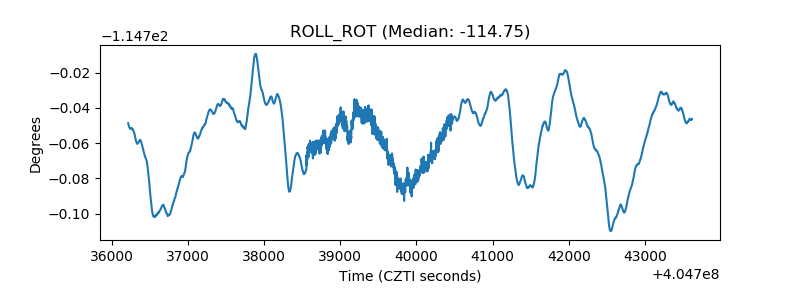 |
| _Roll_DEC | 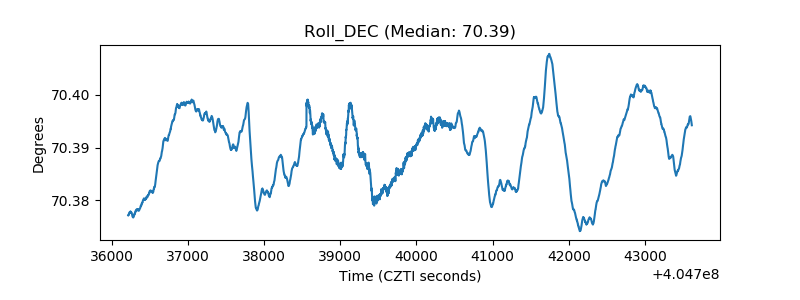 |
| _Roll_RA | 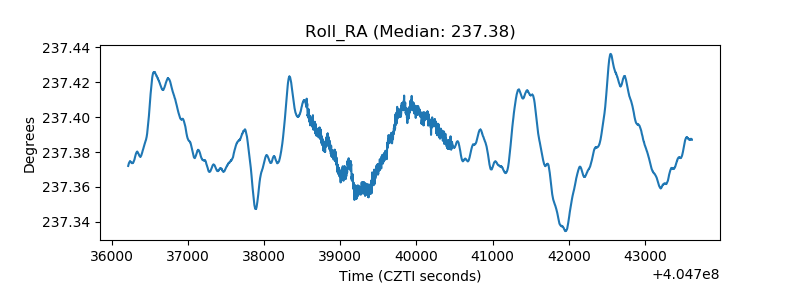 |
| Veto Counter | 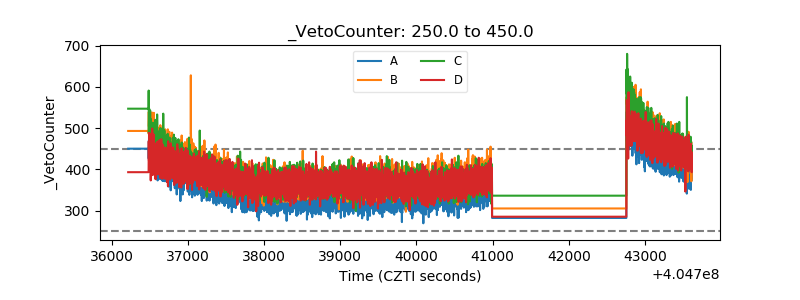 |