| Param | Original file | Final file |
|---|---|---|
| Filename | modeM0/AS1C07_001T12_9000005372_38315cztM0_level2.fits | modeM0/AS1C07_001T12_9000005372_38315cztM0_level2_quad_clean.evt |
| Size (bytes) | 583,056,000 | 83,309,760 |
| Size | 556.0 MB | 79.5 MB |
| Events in quadrant A | 2,969,148 | 672,272 |
| Events in quadrant B | 2,609,294 | 680,710 |
| Events in quadrant C | 2,735,872 | 650,017 |
| Events in quadrant D | 12,842,988 | 137,307 |
| Mode SS | |||
|---|---|---|---|
| Quadrant | BADHDUFLAG | Total packets | Discarded packets |
| A | 0 | 110 | 0 |
| B | 0 | 110 | 0 |
| C | 0 | 110 | 0 |
| D | 0 | 110 | 0 |
| Mode M9 | |||
|---|---|---|---|
| Quadrant | BADHDUFLAG | Total packets | Discarded packets |
| A | 0 | 20 | 0 |
| B | 0 | 20 | 0 |
| C | 0 | 20 | 0 |
| D | 0 | 21 | 0 |
| Mode M0 | |||
|---|---|---|---|
| Quadrant | BADHDUFLAG | Total packets | Discarded packets |
| A | 0 | 12233 | 3 |
| B | 0 | 11373 | 2 |
| C | 0 | 11301 | 2 |
| D | 0 | 41850 | 2 |
| Quadrant | Total seconds | Saturated seconds | Saturation percentage |
|---|---|---|---|
| A | 5464 | 15 | 0.274524% |
| B | 5464 | 12 | 0.219619% |
| C | 5464 | 22 | 0.402635% |
| D | 5464 | 4450 | 81.442167% |
Noise dominated data is calculated using 1-second bins in cleaned event files. If a bin has >2000 counts, and if more than 50% of those come from <1% of pixels, then it is considered to be noise-dominated and hence unusable.
| Quadrant | # 1 sec bins | Bins with >0 counts | Bins with >2000 counts | High rate bins dominated by noise | Noise dominated (total time) | Noise dominated (detector-on time) | Marked lightcurve |
|---|---|---|---|---|---|---|---|
| A | 7377 | 5465 | 5 | 5 | 0.07% | 0.09% | 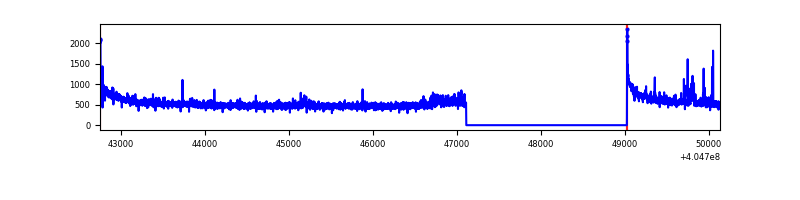 |
| B | 7377 | 5465 | 4 | 4 | 0.05% | 0.07% | 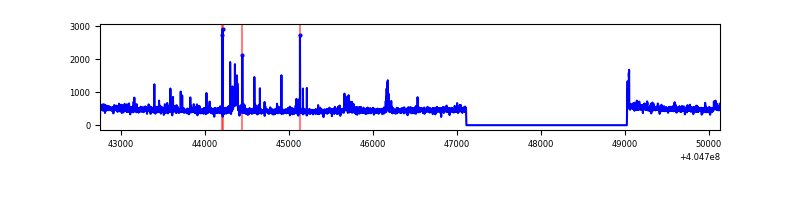 |
| C | 7377 | 5465 | 14 | 14 | 0.19% | 0.26% | 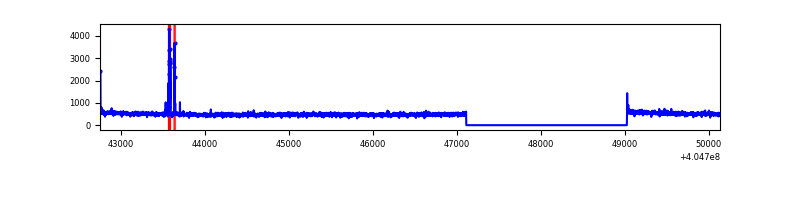 |
| D | 7377 | 5465 | 4369 | 4369 | 59.22% | 79.95% | 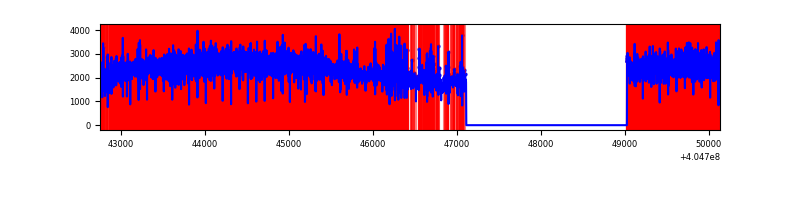 |
Top three noisy pixels from each quadrant. If the there are fewer than three noisy pixels in the level2.evt file, extra rows are filled as -1
| Pixel properties | Quadrant properties | ||||||
|---|---|---|---|---|---|---|---|
| Quadrant | DetID | PixID | Counts | Sigma | Mean | Median | Sigma |
| A | 10 | 83 | 418517 | 3303.77 | 628 | 617 | 126.5 |
| A | 12 | 189 | 79409 | 622.9 | 628 | 617 | 126.5 |
| A | 13 | 6 | 17466 | 133.2 | 628 | 617 | 126.5 |
| B | 15 | 35 | 61430 | 516.27 | 622 | 604 | 117.8 |
| B | 0 | 189 | 43215 | 361.67 | 622 | 604 | 117.8 |
| B | 15 | 85 | 15632 | 127.55 | 622 | 604 | 117.8 |
| C | 15 | 214 | 236274 | 1660.11 | 617 | 621 | 141.9 |
| C | 14 | 254 | 62603 | 436.65 | 617 | 621 | 141.9 |
| C | 0 | 10 | 10819 | 71.84 | 617 | 621 | 141.9 |
| D | 10 | 203 | 7474089 | 68093.6 | 445 | 432 | 109.8 |
| D | 12 | 235 | 2055402 | 18723.14 | 445 | 432 | 109.8 |
| D | 2 | 16 | 814432 | 7416.48 | 445 | 432 | 109.8 |
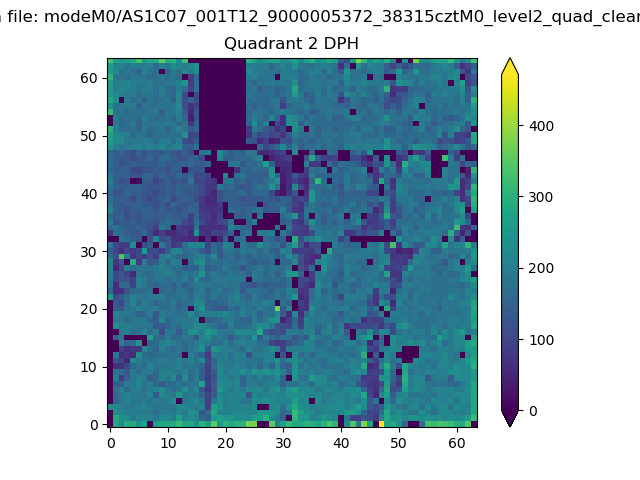
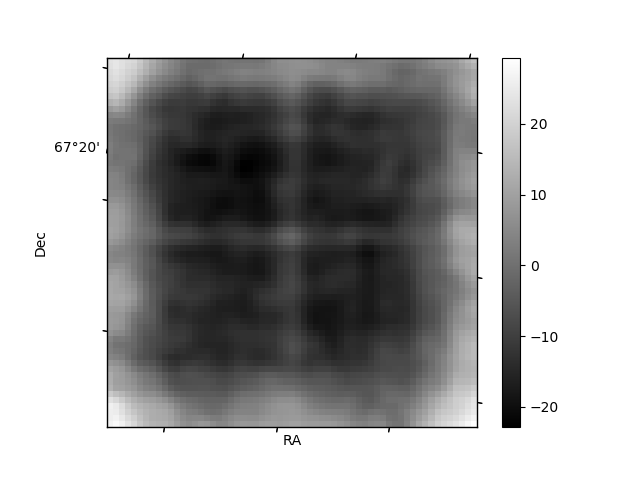
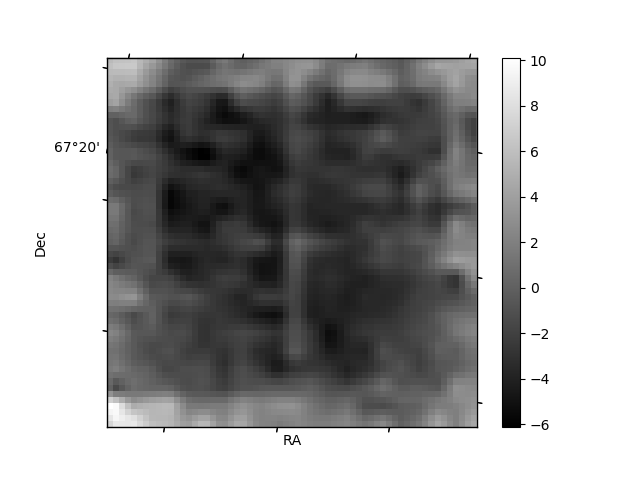
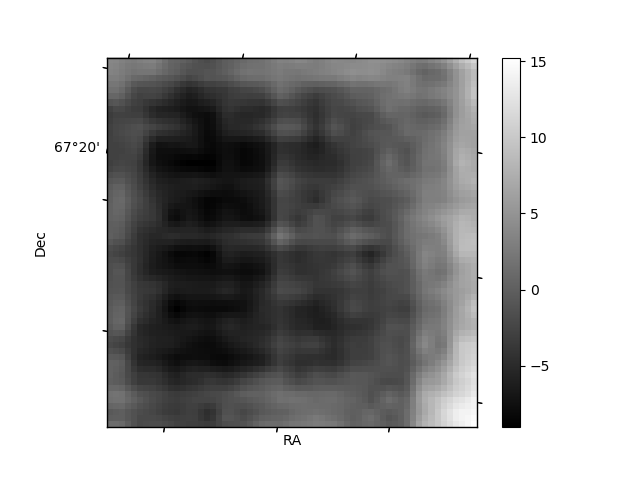
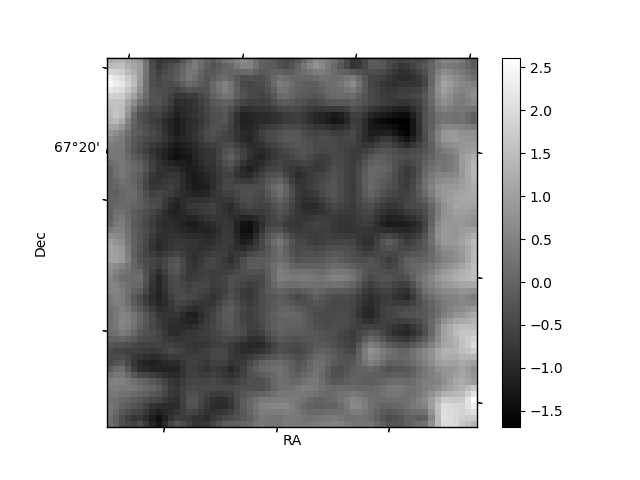
Histogram calculated using DETX and DETY for each event in the final _common_clean file
| Quadrant A | 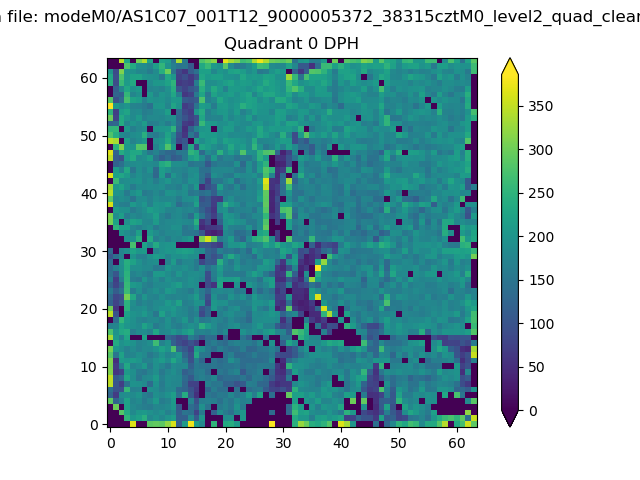 |
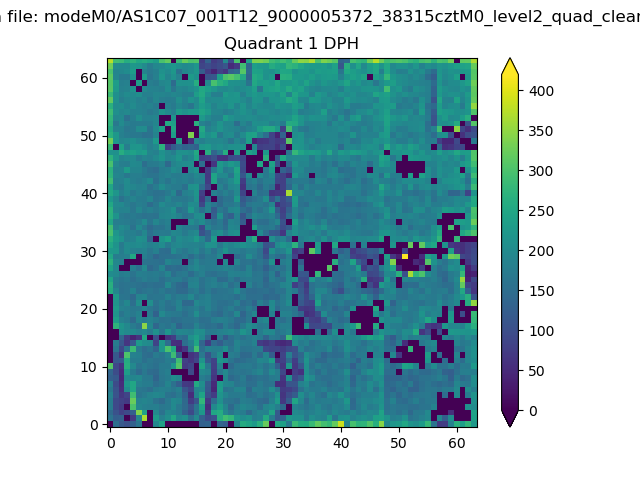 |
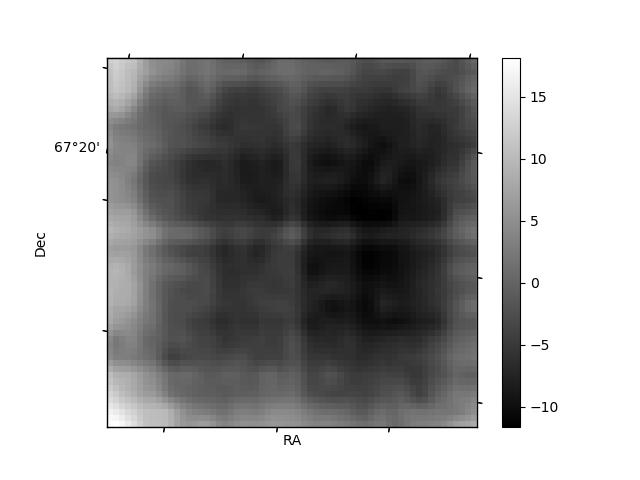
Quadrant B |
|---|---|---|---|
| Quadrant D | 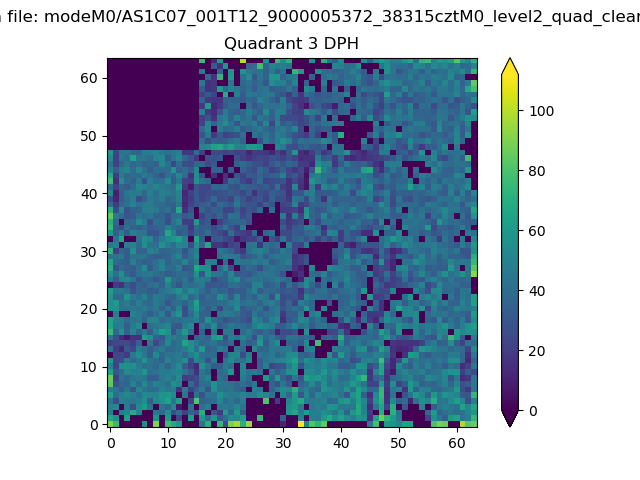 |
 |
Quadrant C |
| Plot type | Count rate plots | Images |
|---|---|---|
| Comparison with Poisson distribution Blue bars denote a histogram of data divided into 1 sec bins. Red curve is a Poisson curve with rate = median count rate of data. |
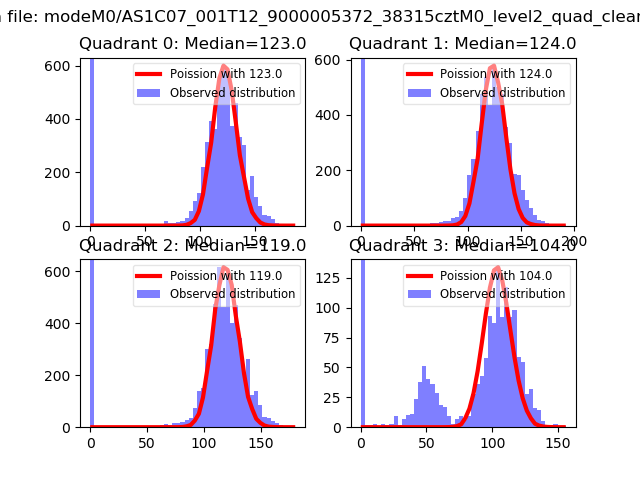 |
 |
| Quadrant-wise count rates Data is divided into 100 sec bins |
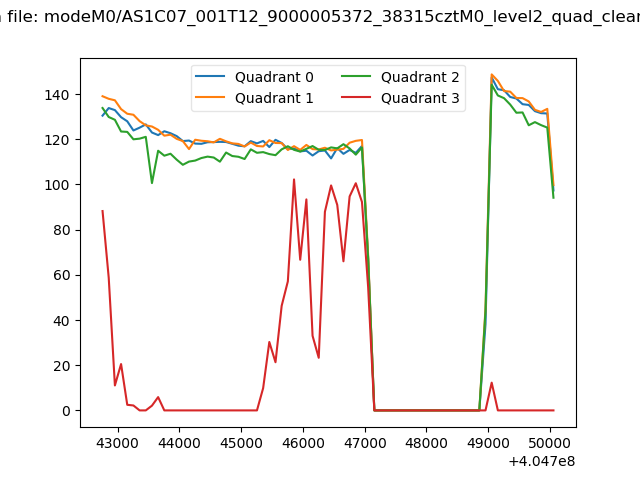 |
|
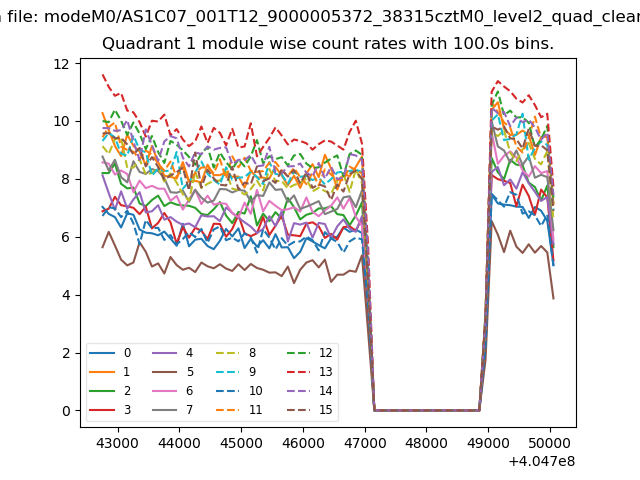
| Module-wise count rates for Quadrant A Data is divided into 100 sec bins |
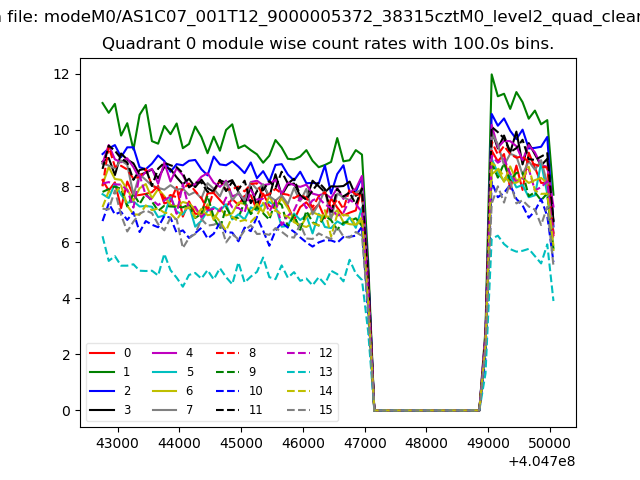 |
 |
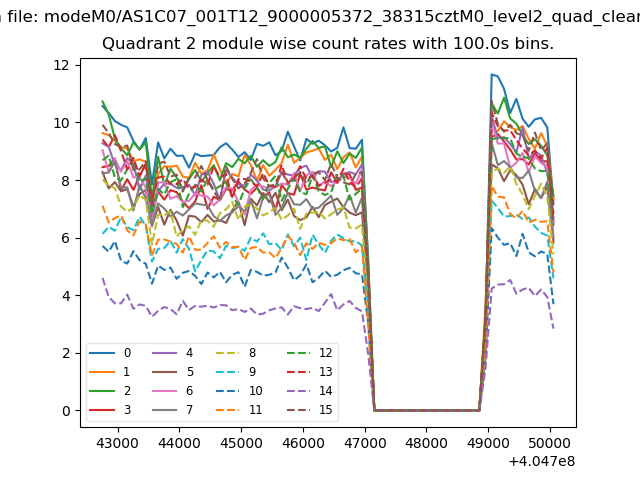
| Module-wise count rates for Quadrant B Data is divided into 100 sec bins |
 |
 |
| Module-wise count rates for Quadrant C Data is divided into 100 sec bins |
 |
 |
| Module-wise count rates for Quadrant D Data is divided into 100 sec bins |
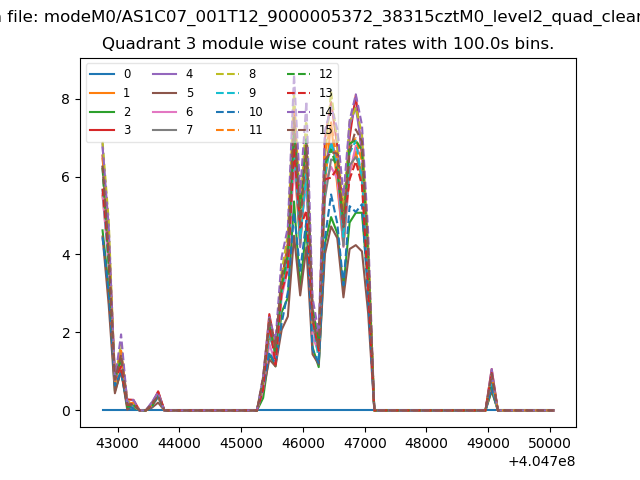 |
 |
| Parameter | Plot |
|---|---|
| CZT HV Monitor | 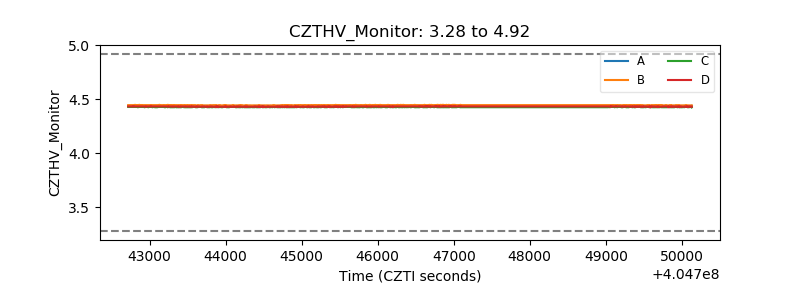 |
| D_VDD | 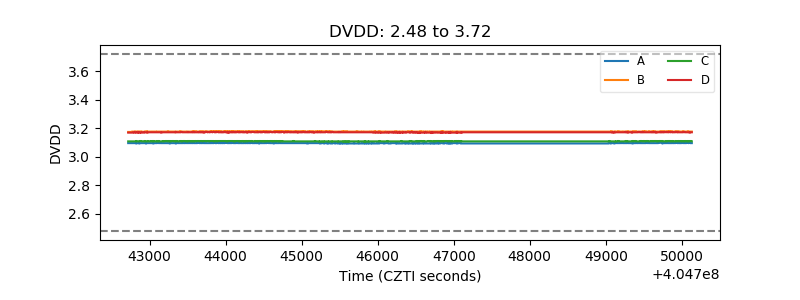 |
| Temperature 1 | 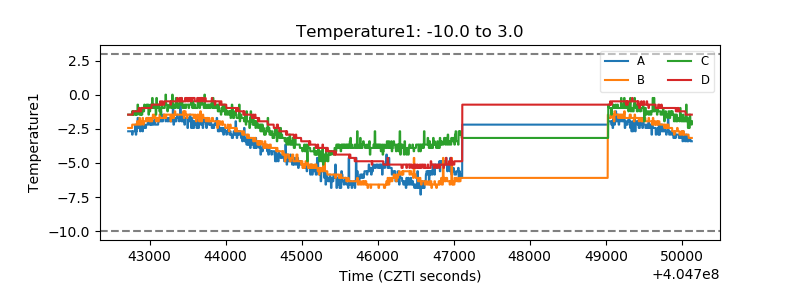 |
| Veto HV Monitor | 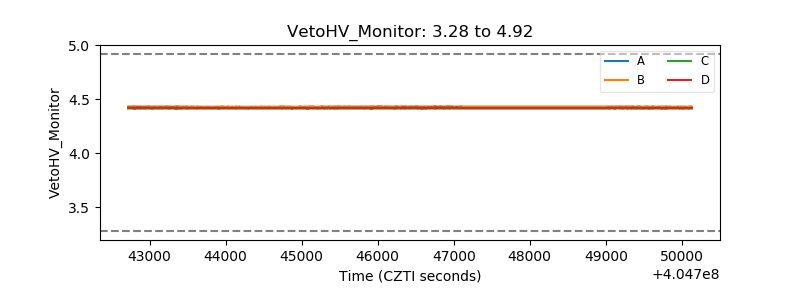 |
| Veto LLD | 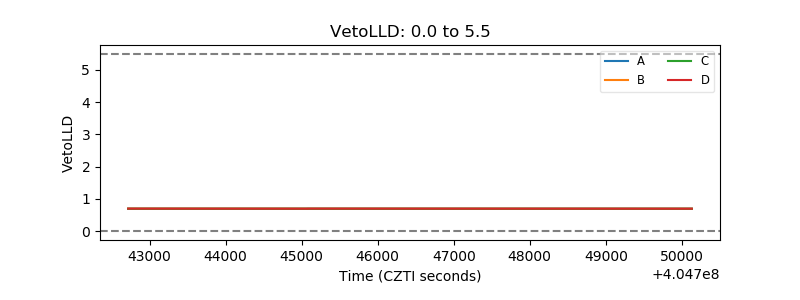 |
| Alpha Counter | 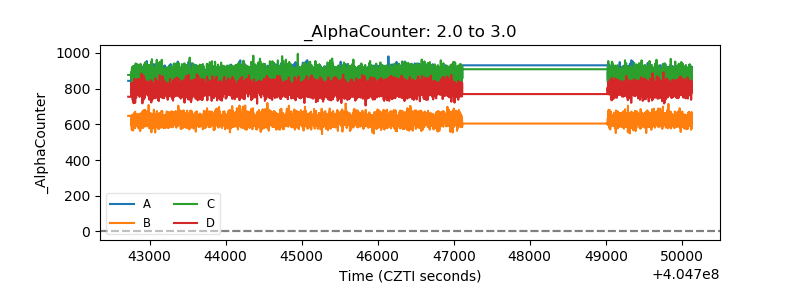 |
| _CPM_Rate | 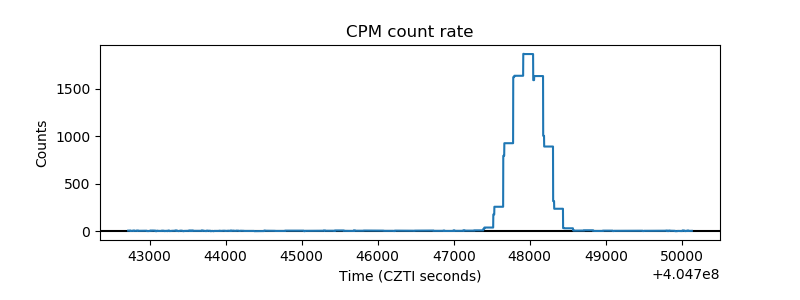 |
| CZT Counter | 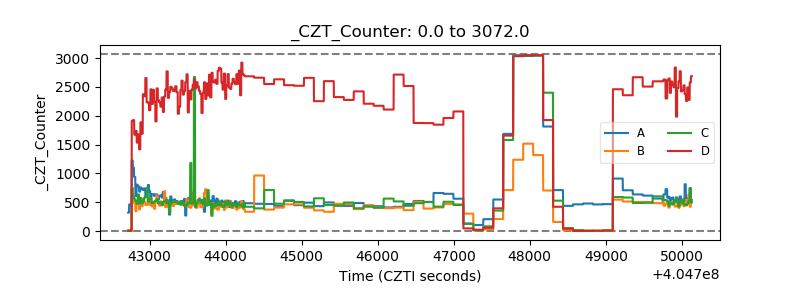 |
| +2.5 Volts monitor | 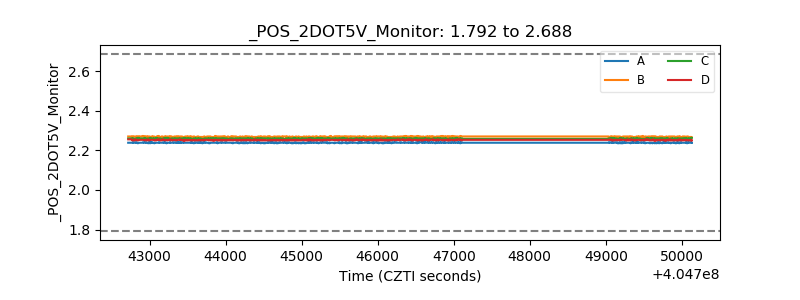 |
| +5 Volts monitor | 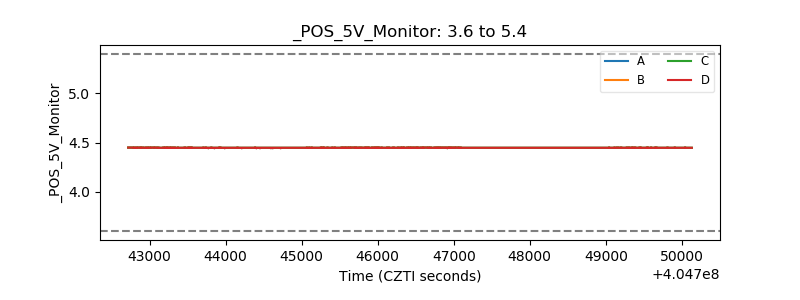 |
| _ROLL_ROT | 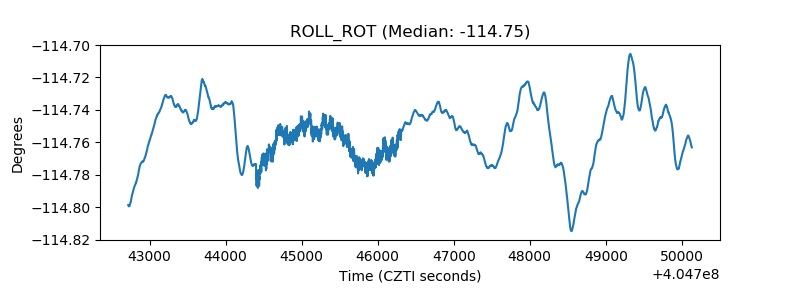 |
| _Roll_DEC | 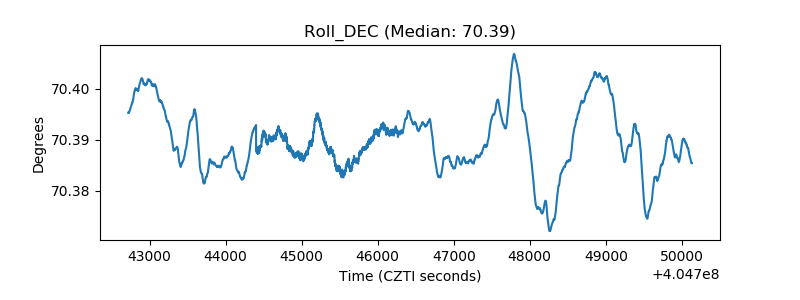 |
| _Roll_RA | 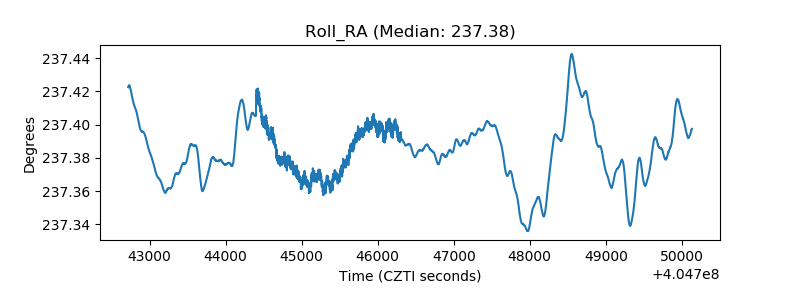 |
| Veto Counter | 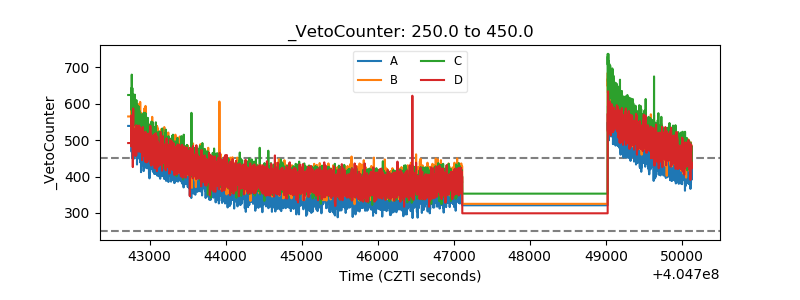 |