| Param | Original file | Final file |
|---|---|---|
| Filename | modeM0/AS1C07_001T12_9000005372_38316cztM0_level2.fits | modeM0/AS1C07_001T12_9000005372_38316cztM0_level2_quad_clean.evt |
| Size (bytes) | 525,844,800 | 83,073,600 |
| Size | 501.5 MB | 79.2 MB |
| Events in quadrant A | 2,842,655 | 652,399 |
| Events in quadrant B | 2,857,726 | 642,528 |
| Events in quadrant C | 2,559,407 | 640,706 |
| Events in quadrant D | 10,807,619 | 221,807 |
| Mode SS | |||
|---|---|---|---|
| Quadrant | BADHDUFLAG | Total packets | Discarded packets |
| A | 0 | 104 | 0 |
| B | 0 | 104 | 0 |
| C | 0 | 104 | 0 |
| D | 0 | 104 | 0 |
| Mode M9 | |||
|---|---|---|---|
| Quadrant | BADHDUFLAG | Total packets | Discarded packets |
| A | 0 | 20 | 0 |
| B | 0 | 20 | 0 |
| C | 0 | 20 | 0 |
| D | 0 | 20 | 0 |
| Mode M0 | |||
|---|---|---|---|
| Quadrant | BADHDUFLAG | Total packets | Discarded packets |
| A | 0 | 11546 | 3 |
| B | 0 | 11832 | 2 |
| C | 0 | 10545 | 2 |
| D | 0 | 35589 | 2 |
| Quadrant | Total seconds | Saturated seconds | Saturation percentage |
|---|---|---|---|
| A | 5109 | 9 | 0.176160% |
| B | 5109 | 158 | 3.092582% |
| C | 5109 | 5 | 0.097867% |
| D | 5109 | 3279 | 64.180857% |
Noise dominated data is calculated using 1-second bins in cleaned event files. If a bin has >2000 counts, and if more than 50% of those come from <1% of pixels, then it is considered to be noise-dominated and hence unusable.
| Quadrant | # 1 sec bins | Bins with >0 counts | Bins with >2000 counts | High rate bins dominated by noise | Noise dominated (total time) | Noise dominated (detector-on time) | Marked lightcurve |
|---|---|---|---|---|---|---|---|
| A | 7112 | 5110 | 4 | 4 | 0.06% | 0.08% | 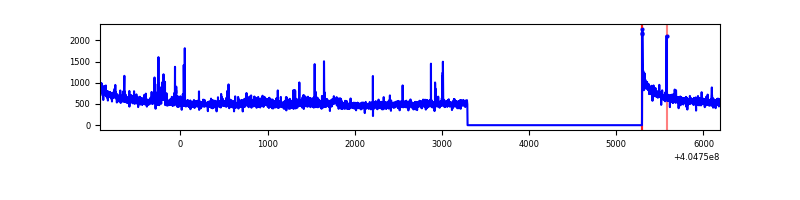 |
| B | 7112 | 5110 | 125 | 125 | 1.76% | 2.45% | 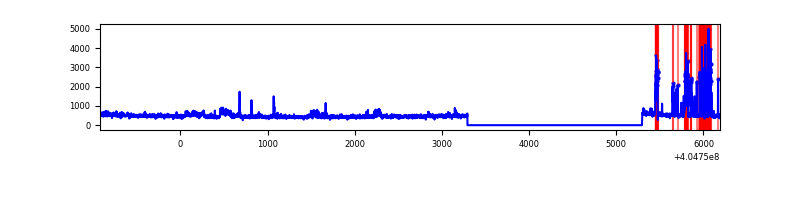 |
| C | 7112 | 5110 | 1 | 1 | 0.01% | 0.02% | 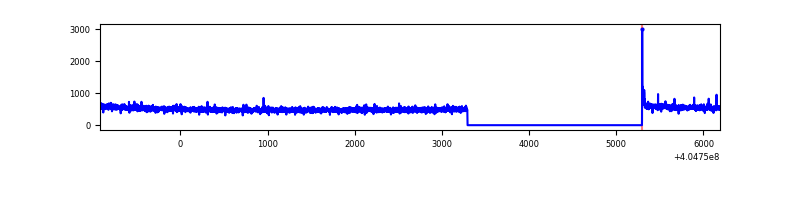 |
| D | 7112 | 5110 | 3204 | 3204 | 45.05% | 62.70% | 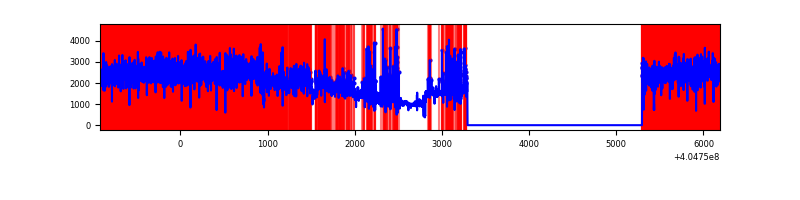 |
Top three noisy pixels from each quadrant. If the there are fewer than three noisy pixels in the level2.evt file, extra rows are filled as -1
| Pixel properties | Quadrant properties | ||||||
|---|---|---|---|---|---|---|---|
| Quadrant | DetID | PixID | Counts | Sigma | Mean | Median | Sigma |
| A | 10 | 83 | 370601 | 3112.46 | 597 | 587 | 118.9 |
| A | 11 | 84 | 63003 | 525.03 | 597 | 587 | 118.9 |
| A | 12 | 189 | 33784 | 279.24 | 597 | 587 | 118.9 |
| B | 5 | 184 | 447092 | 4086.15 | 584 | 569 | 109.3 |
| B | 0 | 189 | 42521 | 383.9 | 584 | 569 | 109.3 |
| B | 0 | 186 | 23719 | 211.85 | 584 | 569 | 109.3 |
| C | 15 | 214 | 218114 | 1598.4 | 593 | 598 | 136.1 |
| C | 0 | 10 | 10886 | 75.6 | 593 | 598 | 136.1 |
| C | 14 | 67 | 6675 | 44.66 | 593 | 598 | 136.1 |
| D | 10 | 203 | 6521341 | 58843.06 | 449 | 436 | 110.8 |
| D | 12 | 235 | 1063756 | 9595.14 | 449 | 436 | 110.8 |
| D | 2 | 16 | 778986 | 7025.45 | 449 | 436 | 110.8 |
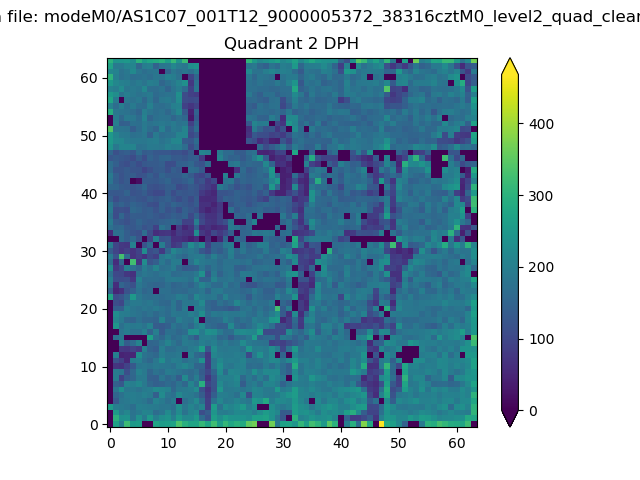
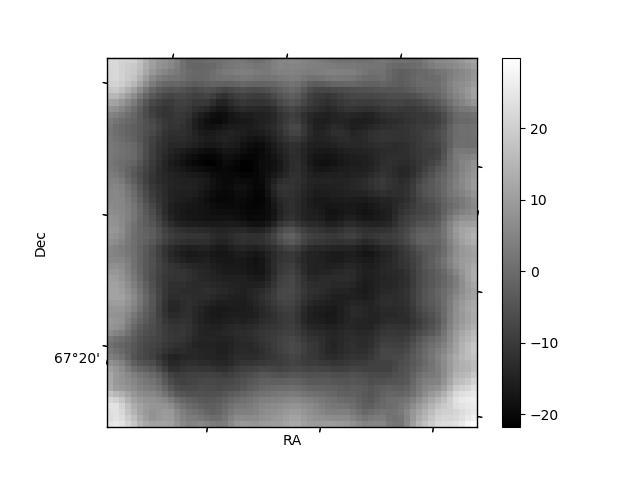
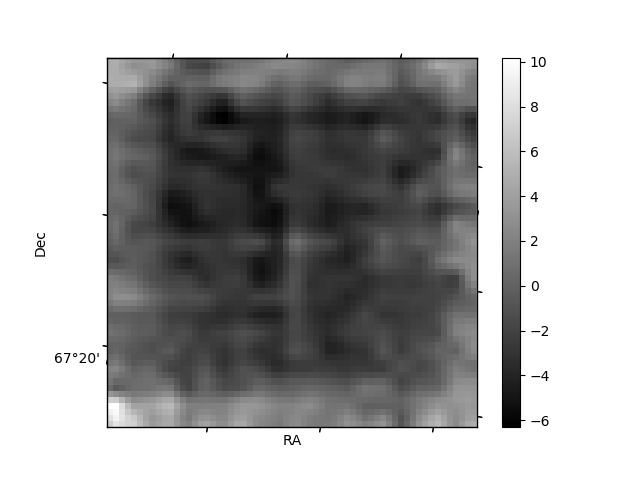
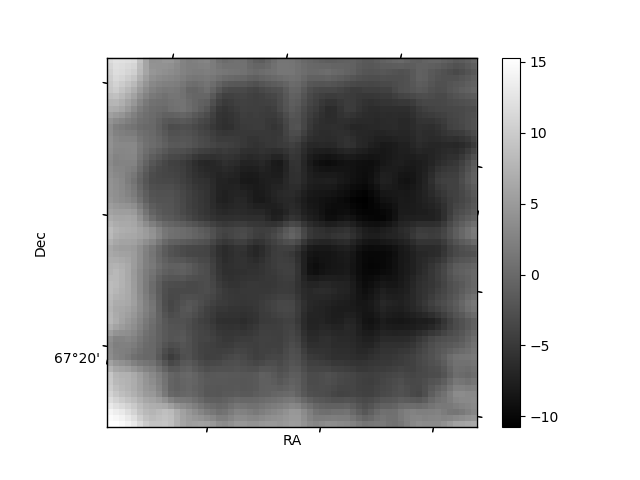
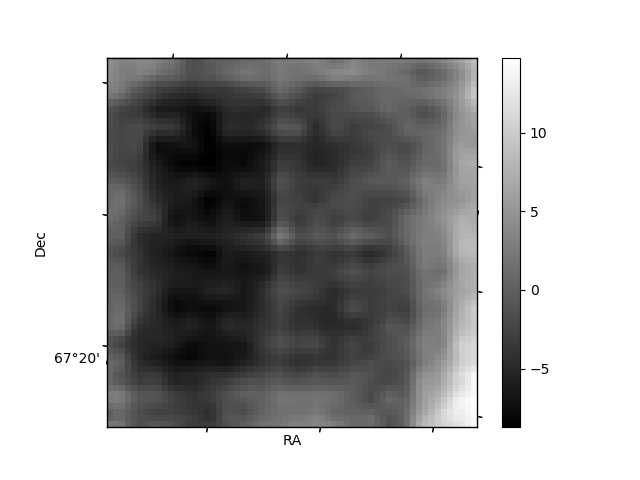
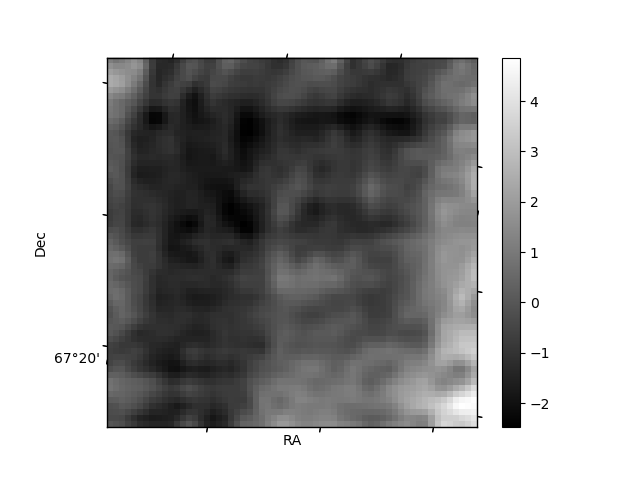
Histogram calculated using DETX and DETY for each event in the final _common_clean file
| Quadrant A | 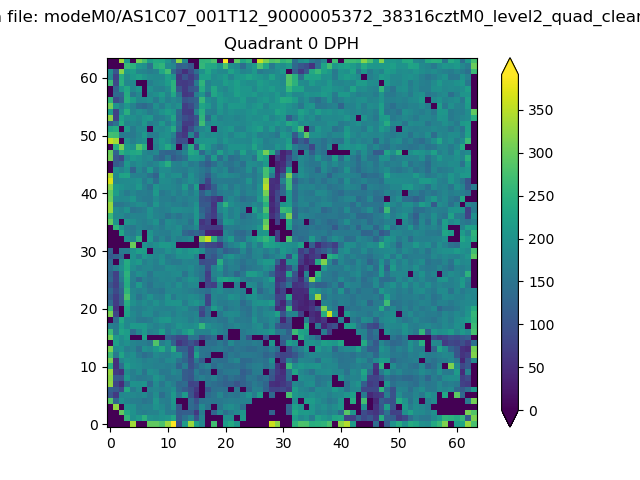 |
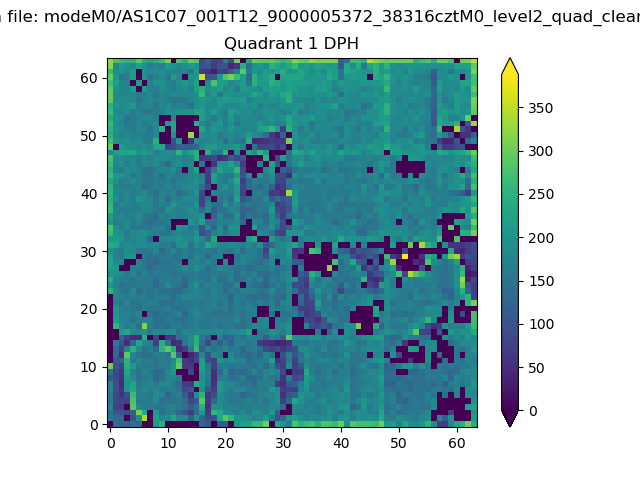 |
Quadrant B |
|---|---|---|---|
| Quadrant D | 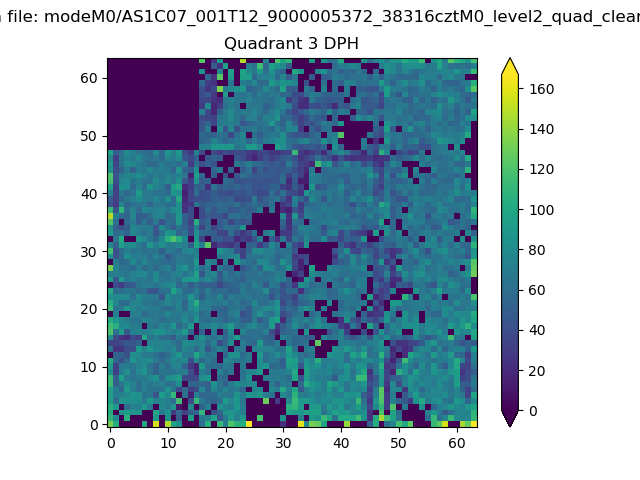 |
 |
Quadrant C |
| Plot type | Count rate plots | Images |
|---|---|---|
| Comparison with Poisson distribution Blue bars denote a histogram of data divided into 1 sec bins. Red curve is a Poisson curve with rate = median count rate of data. |
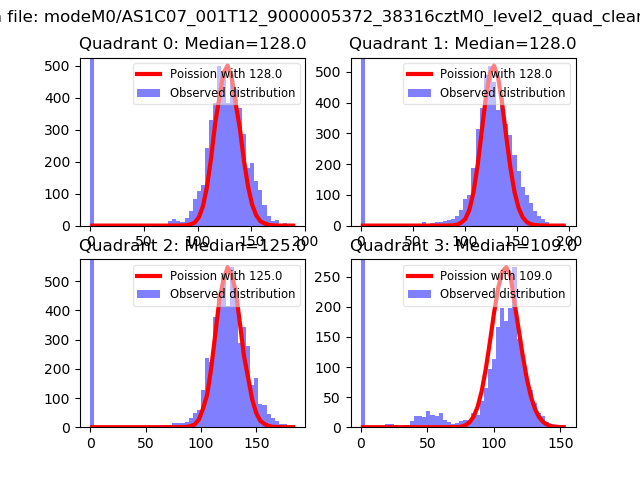 |
 |
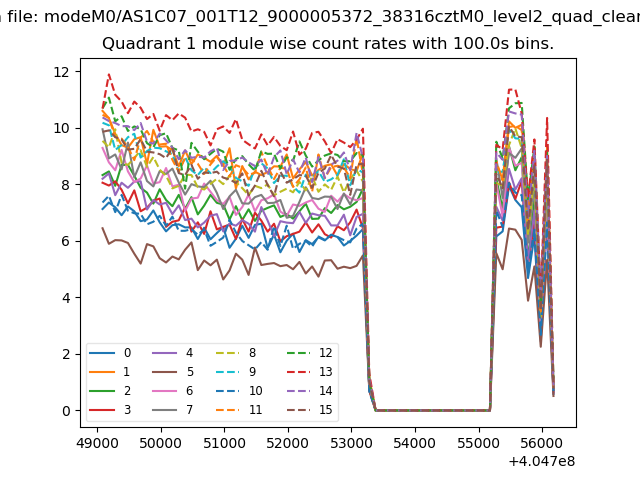
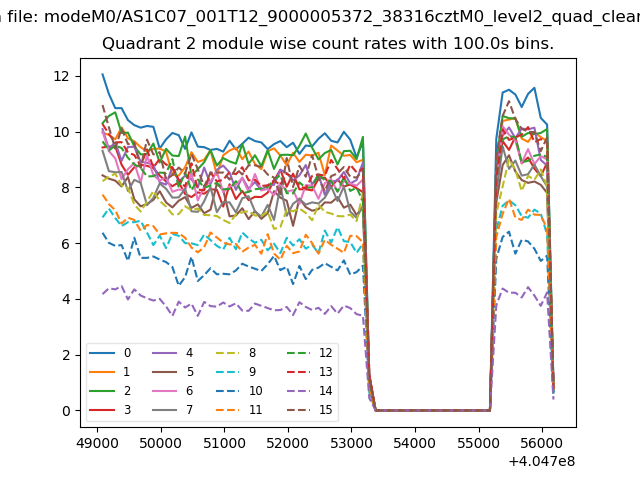
| Quadrant-wise count rates Data is divided into 100 sec bins |
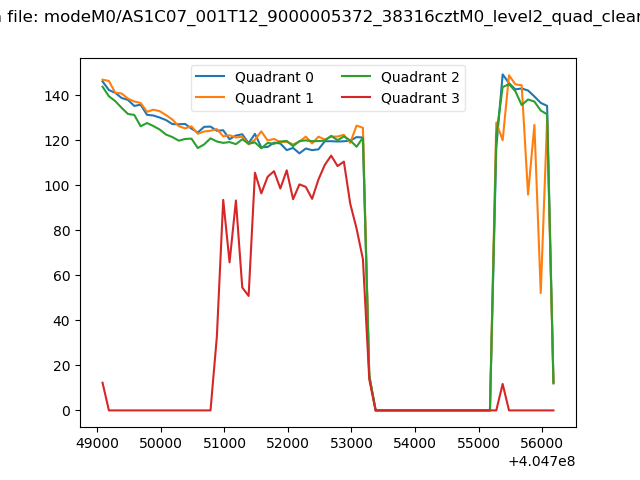 |
|
| Module-wise count rates for Quadrant A Data is divided into 100 sec bins |
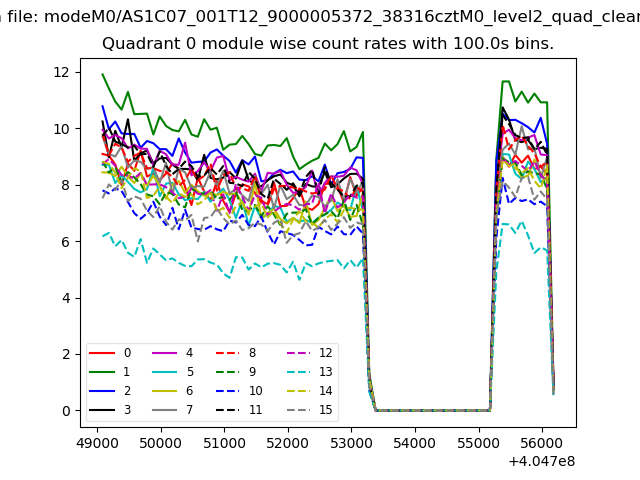 |
 |
| Module-wise count rates for Quadrant B Data is divided into 100 sec bins |
 |
 |
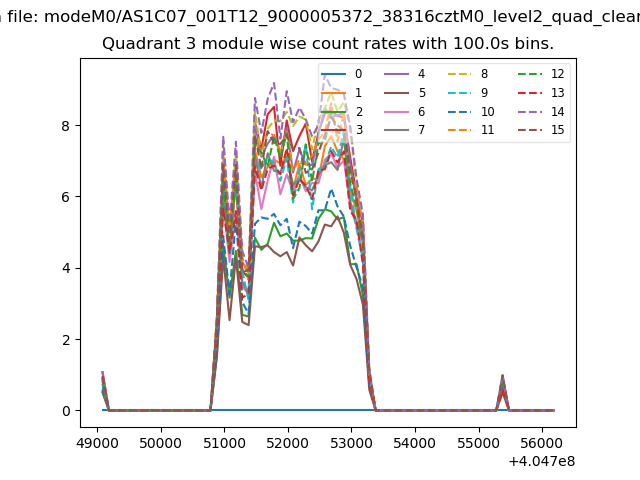
| Module-wise count rates for Quadrant C Data is divided into 100 sec bins |
 |
 |
| Module-wise count rates for Quadrant D Data is divided into 100 sec bins |
 |
 |
| Parameter | Plot |
|---|---|
| CZT HV Monitor | 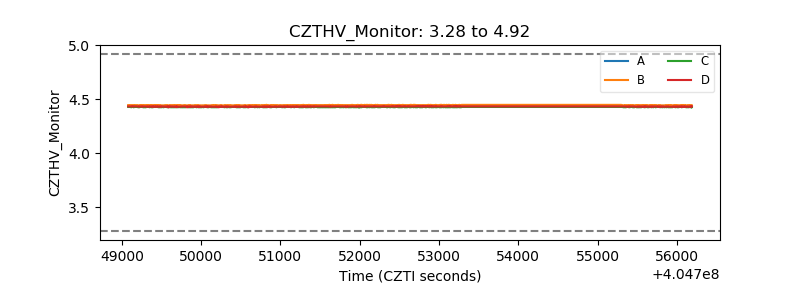 |
| D_VDD | 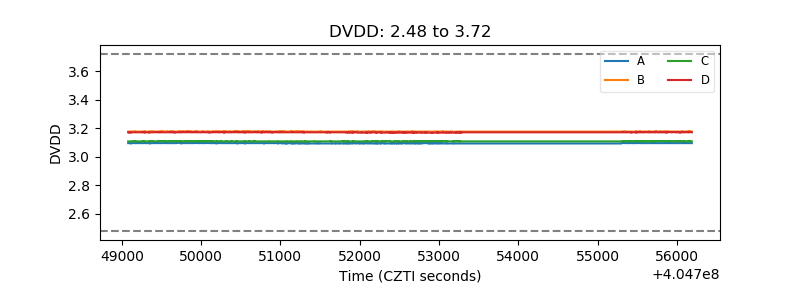 |
| Temperature 1 | 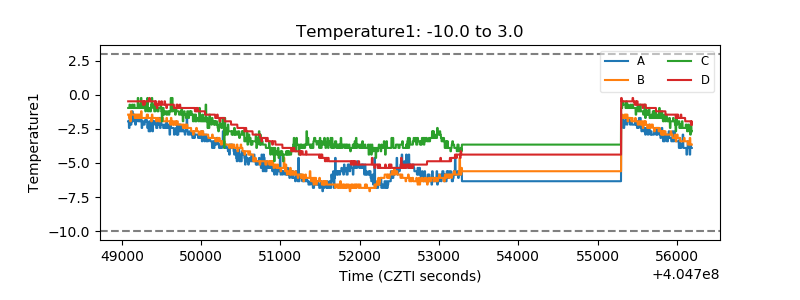 |
| Veto HV Monitor | 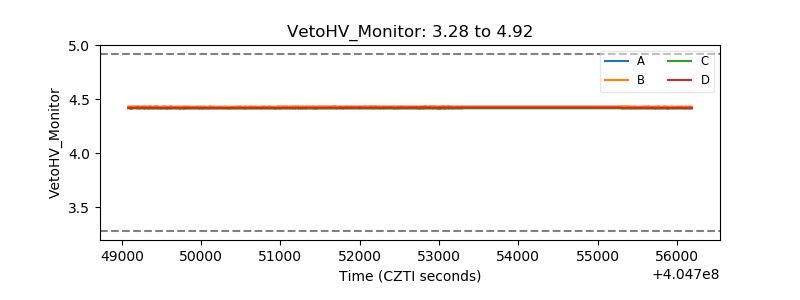 |
| Veto LLD | 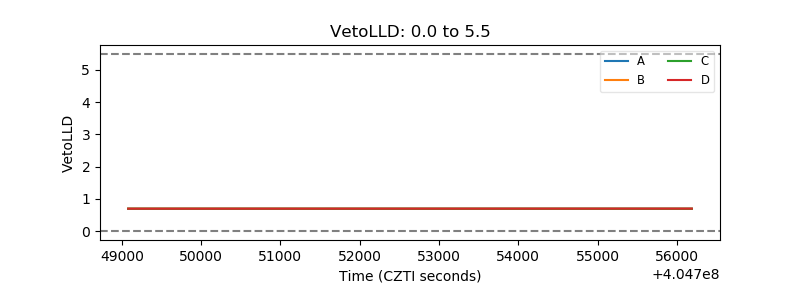 |
| Alpha Counter | 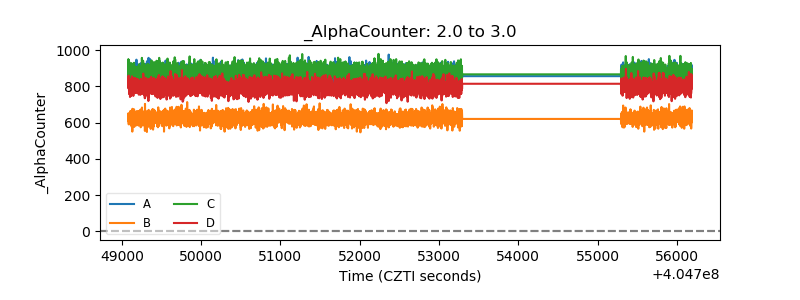 |
| _CPM_Rate | 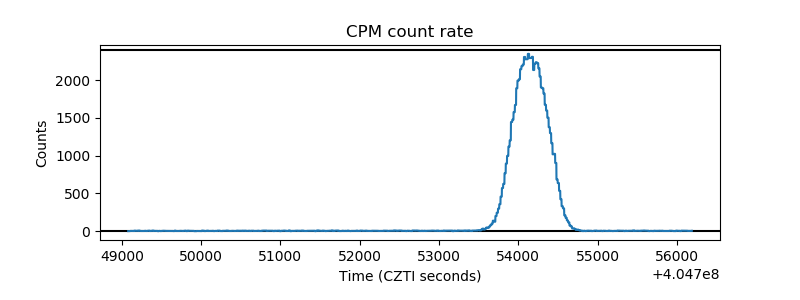 |
| CZT Counter | 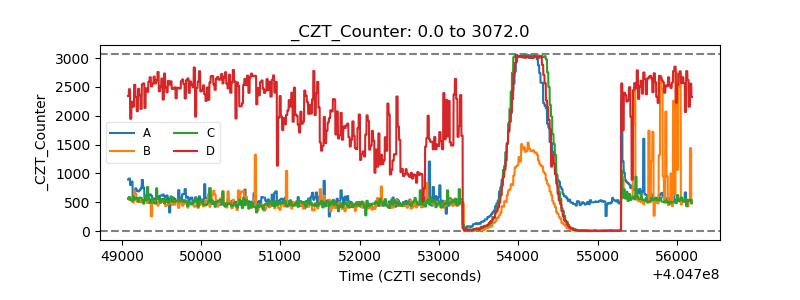 |
| +2.5 Volts monitor | 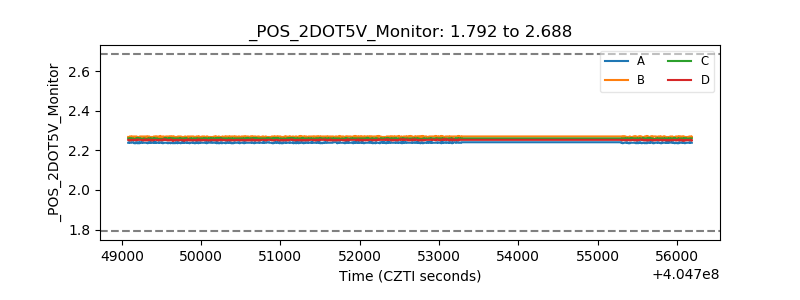 |
| +5 Volts monitor | 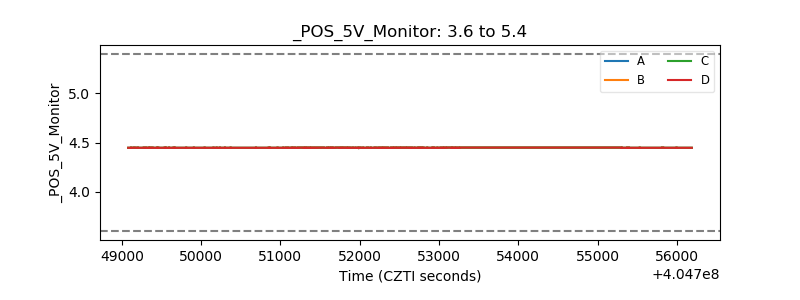 |
| _ROLL_ROT | 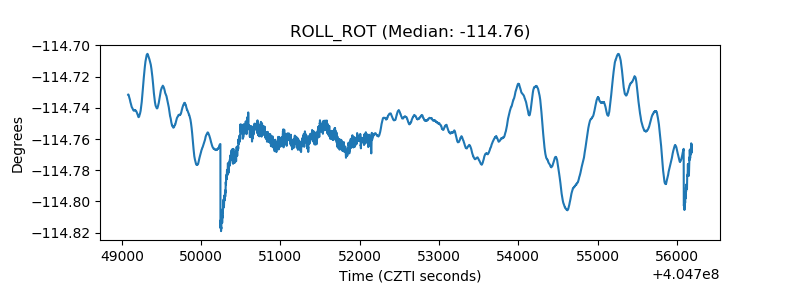 |
| _Roll_DEC | 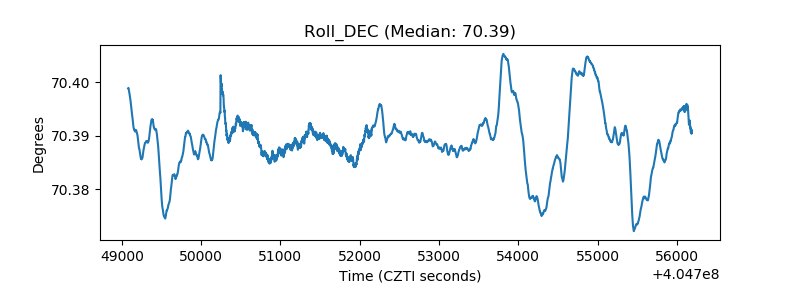 |
| _Roll_RA | 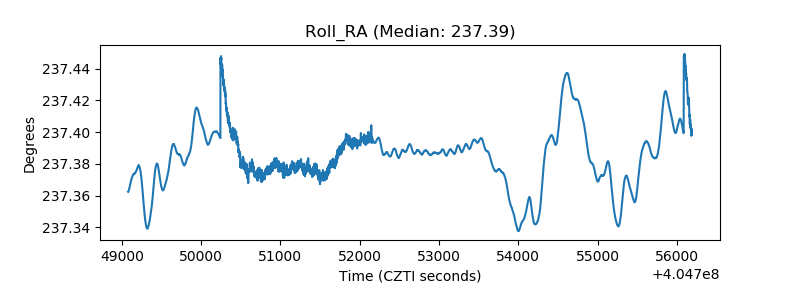 |
| Veto Counter | 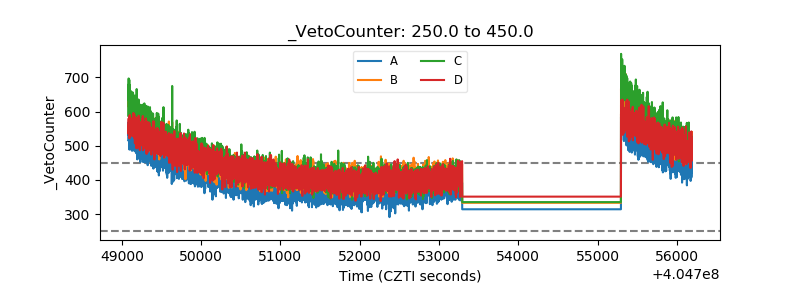 |