| Param | Original file | Final file |
|---|---|---|
| Filename | modeM0/AS1C07_001T12_9000005372_38317cztM0_level2.fits | modeM0/AS1C07_001T12_9000005372_38317cztM0_level2_quad_clean.evt |
| Size (bytes) | 513,129,600 | 79,865,280 |
| Size | 489.4 MB | 76.2 MB |
| Events in quadrant A | 2,715,290 | 628,361 |
| Events in quadrant B | 2,764,026 | 621,651 |
| Events in quadrant C | 2,529,191 | 626,818 |
| Events in quadrant D | 10,603,195 | 196,510 |
| Mode SS | |||
|---|---|---|---|
| Quadrant | BADHDUFLAG | Total packets | Discarded packets |
| A | 0 | 102 | 0 |
| B | 0 | 102 | 0 |
| C | 0 | 102 | 0 |
| D | 0 | 102 | 0 |
| Mode M9 | |||
|---|---|---|---|
| Quadrant | BADHDUFLAG | Total packets | Discarded packets |
| A | 0 | 26 | 0 |
| B | 0 | 26 | 0 |
| C | 0 | 26 | 0 |
| D | 0 | 27 | 0 |
| Mode M0 | |||
|---|---|---|---|
| Quadrant | BADHDUFLAG | Total packets | Discarded packets |
| A | 0 | 11090 | 3 |
| B | 0 | 11442 | 2 |
| C | 0 | 10354 | 2 |
| D | 0 | 34842 | 2 |
| Quadrant | Total seconds | Saturated seconds | Saturation percentage |
|---|---|---|---|
| A | 4915 | 24 | 0.488301% |
| B | 4915 | 173 | 3.519837% |
| C | 4915 | 11 | 0.223805% |
| D | 4915 | 3272 | 66.571719% |
Noise dominated data is calculated using 1-second bins in cleaned event files. If a bin has >2000 counts, and if more than 50% of those come from <1% of pixels, then it is considered to be noise-dominated and hence unusable.
| Quadrant | # 1 sec bins | Bins with >0 counts | Bins with >2000 counts | High rate bins dominated by noise | Noise dominated (total time) | Noise dominated (detector-on time) | Marked lightcurve |
|---|---|---|---|---|---|---|---|
| A | 7038 | 4916 | 17 | 17 | 0.24% | 0.35% | 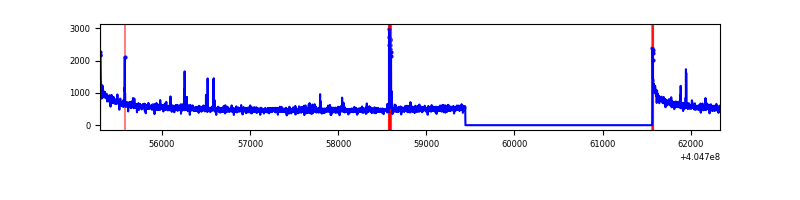 |
| B | 7038 | 4916 | 133 | 133 | 1.89% | 2.71% | 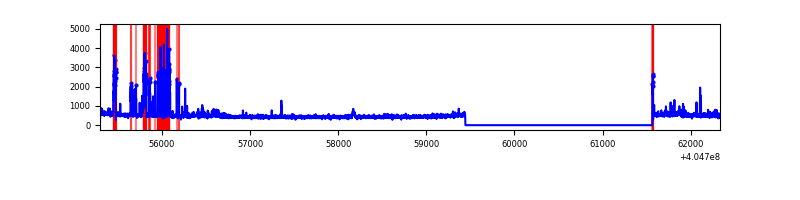 |
| C | 7038 | 4916 | 6 | 6 | 0.09% | 0.12% | 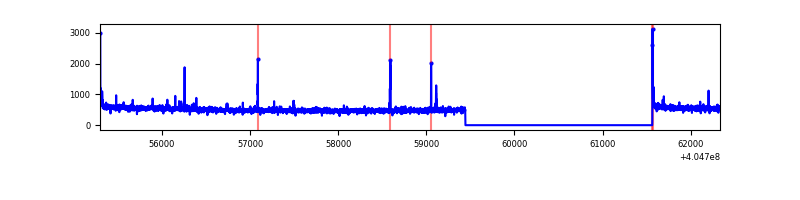 |
| D | 7038 | 4916 | 3159 | 3159 | 44.88% | 64.26% | 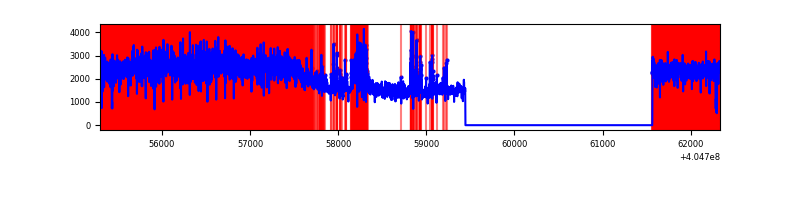 |
Top three noisy pixels from each quadrant. If the there are fewer than three noisy pixels in the level2.evt file, extra rows are filled as -1
| Pixel properties | Quadrant properties | ||||||
|---|---|---|---|---|---|---|---|
| Quadrant | DetID | PixID | Counts | Sigma | Mean | Median | Sigma |
| A | 10 | 83 | 388107 | 3409.75 | 571 | 561 | 113.7 |
| A | 13 | 248 | 40630 | 352.54 | 571 | 561 | 113.7 |
| A | 10 | 248 | 38728 | 335.81 | 571 | 561 | 113.7 |
| B | 5 | 184 | 407218 | 3849.67 | 562 | 547 | 105.6 |
| B | 0 | 183 | 40277 | 376.1 | 562 | 547 | 105.6 |
| B | 0 | 229 | 29592 | 274.95 | 562 | 547 | 105.6 |
| C | 15 | 214 | 209835 | 1579.11 | 575 | 580 | 132.5 |
| C | 0 | 10 | 24726 | 182.21 | 575 | 580 | 132.5 |
| C | 15 | 159 | 12225 | 87.88 | 575 | 580 | 132.5 |
| D | 10 | 203 | 6134232 | 56671.16 | 443 | 431 | 108.2 |
| D | 12 | 235 | 1208334 | 11160.01 | 443 | 431 | 108.2 |
| D | 2 | 16 | 838247 | 7740.72 | 443 | 431 | 108.2 |
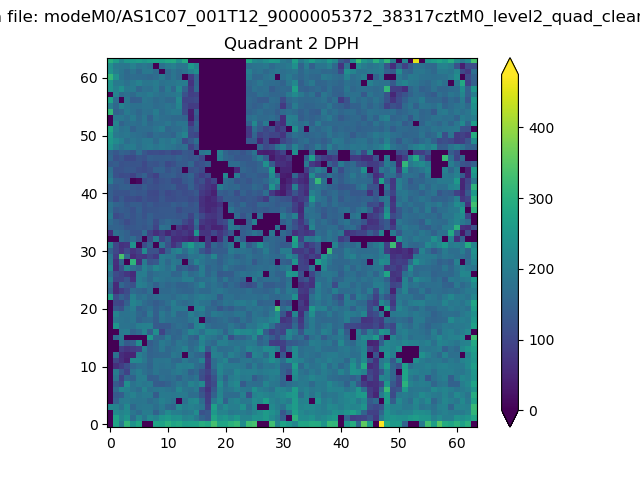
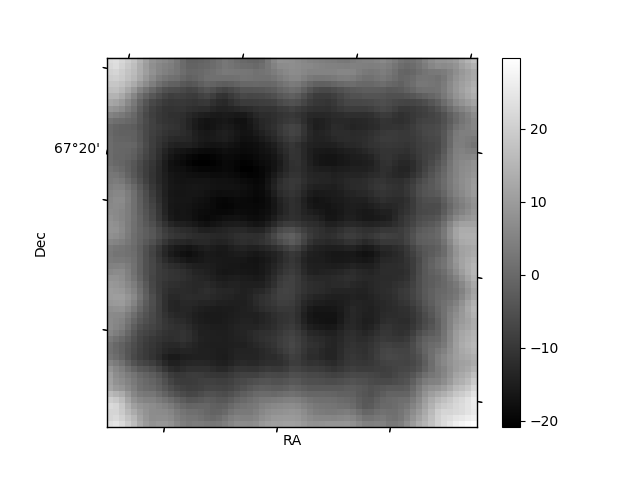
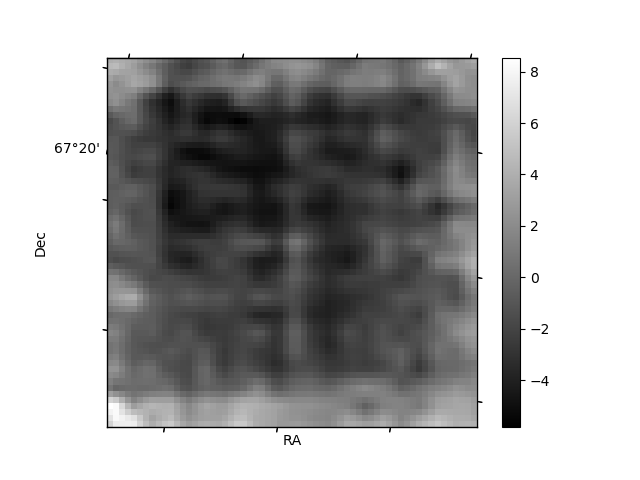
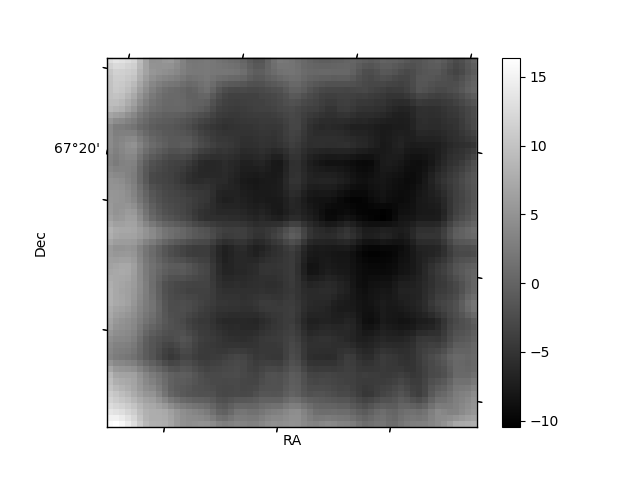
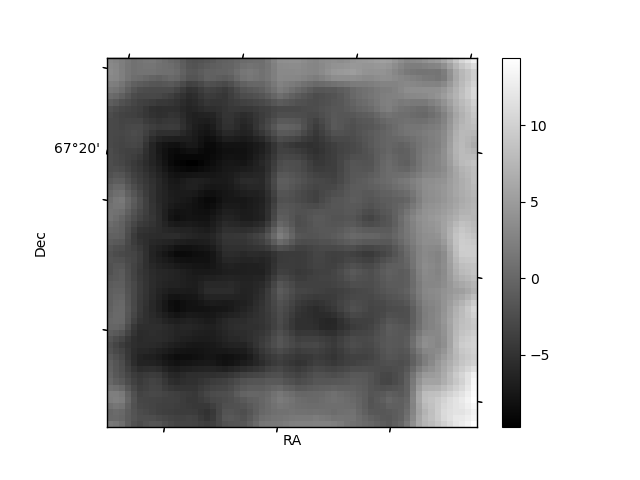
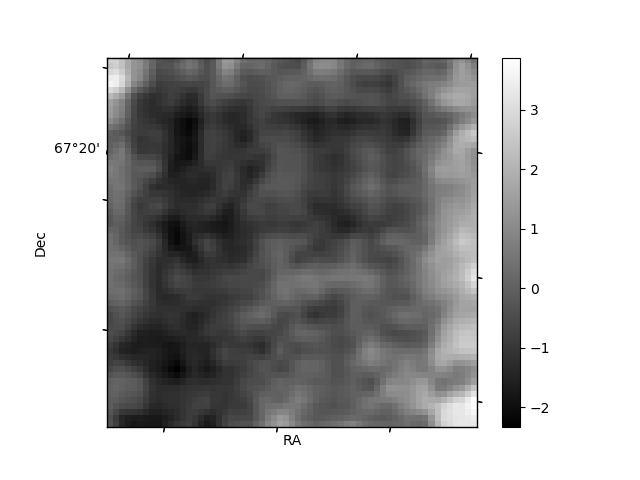
Histogram calculated using DETX and DETY for each event in the final _common_clean file
| Quadrant A | 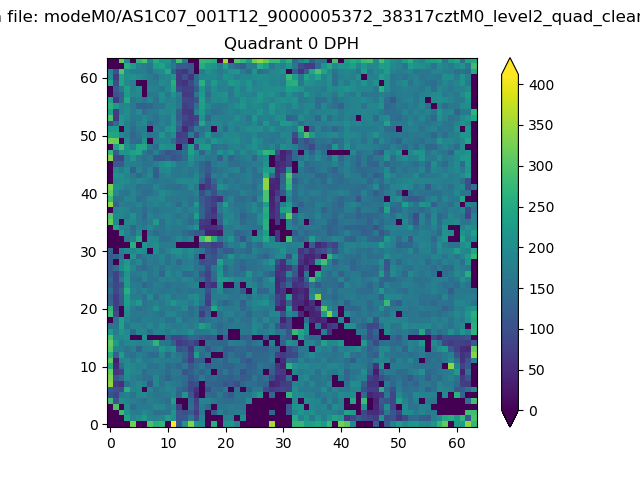 |
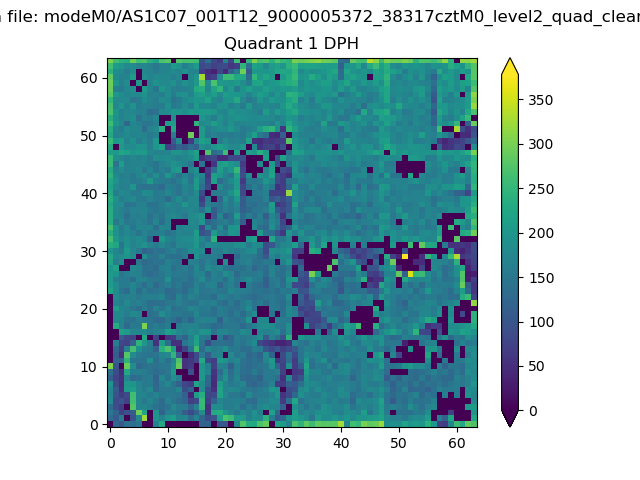 |
Quadrant B |
|---|---|---|---|
| Quadrant D | 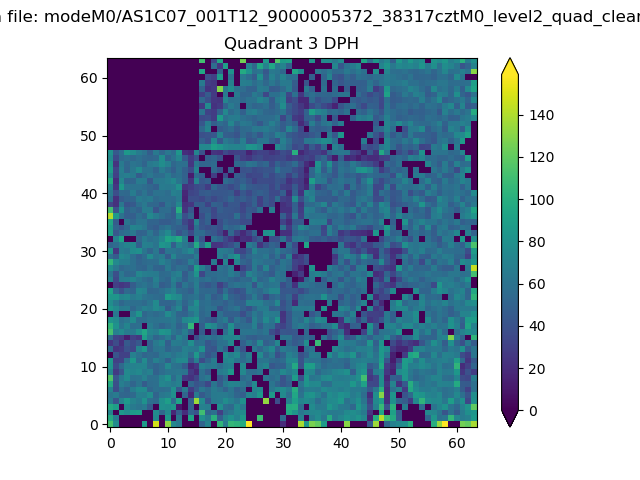 |
 |
Quadrant C |
| Plot type | Count rate plots | Images |
|---|---|---|
| Comparison with Poisson distribution Blue bars denote a histogram of data divided into 1 sec bins. Red curve is a Poisson curve with rate = median count rate of data. |
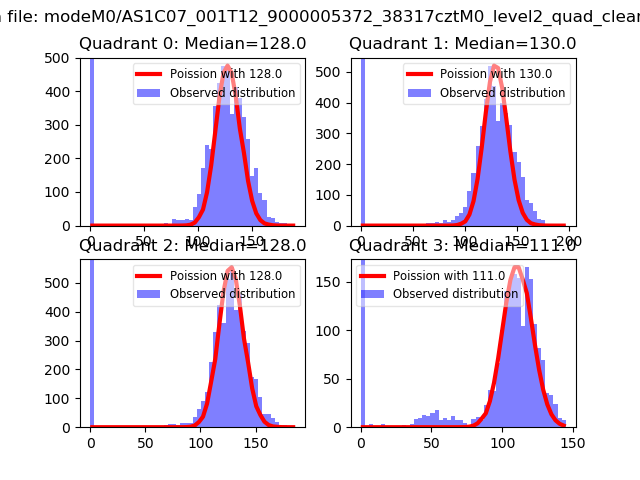 |
 |
| Quadrant-wise count rates Data is divided into 100 sec bins |
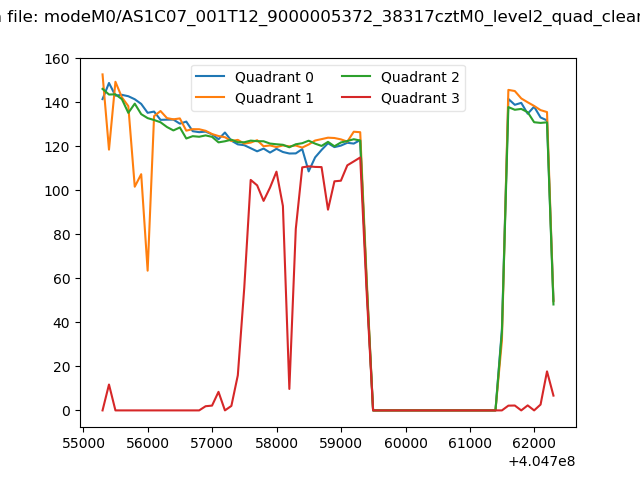 |
|
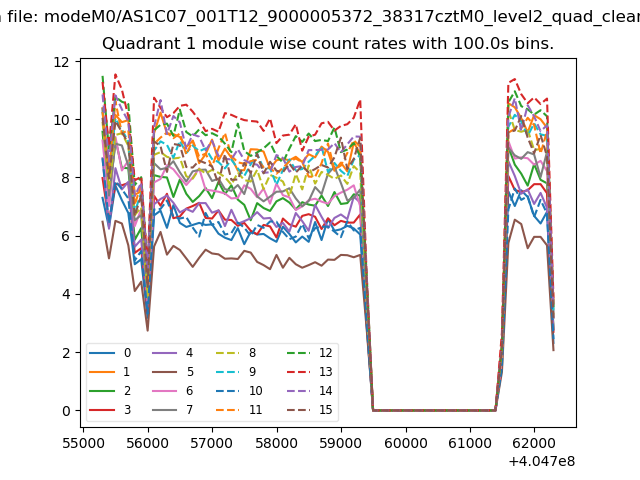
| Module-wise count rates for Quadrant A Data is divided into 100 sec bins |
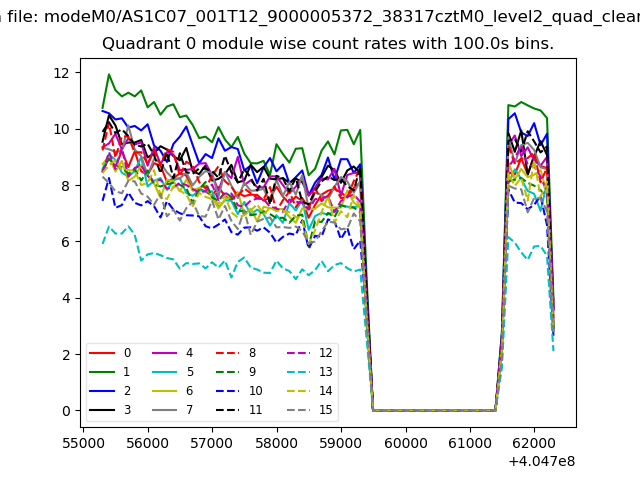 |
 |
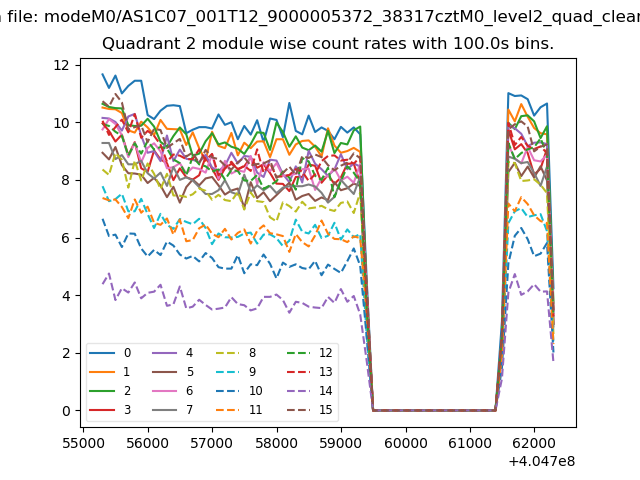
| Module-wise count rates for Quadrant B Data is divided into 100 sec bins |
 |
 |
| Module-wise count rates for Quadrant C Data is divided into 100 sec bins |
 |
 |
| Module-wise count rates for Quadrant D Data is divided into 100 sec bins |
 |
 |
| Parameter | Plot |
|---|---|
| CZT HV Monitor | 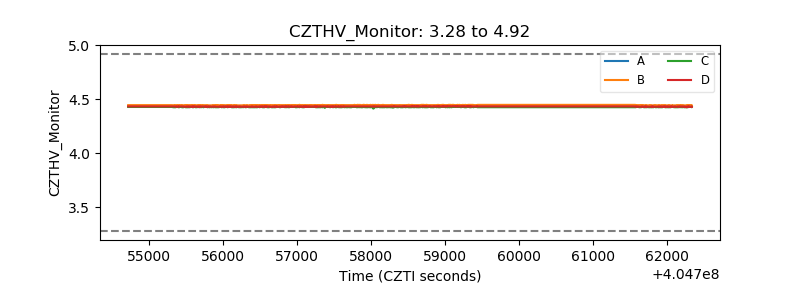 |
| D_VDD | 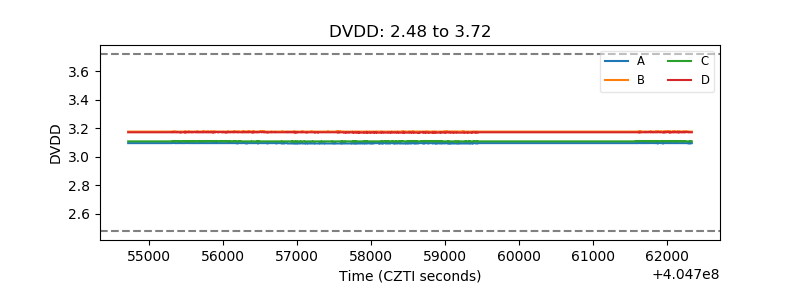 |
| Temperature 1 | 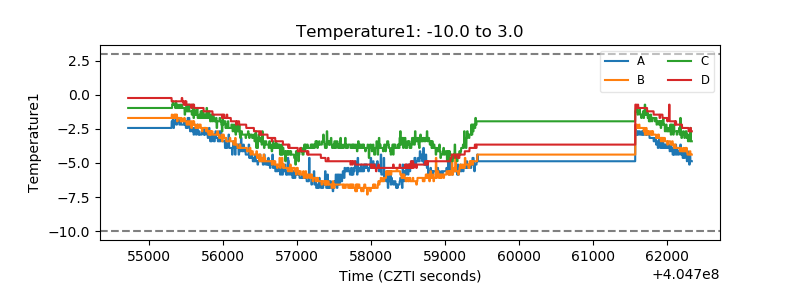 |
| Veto HV Monitor | 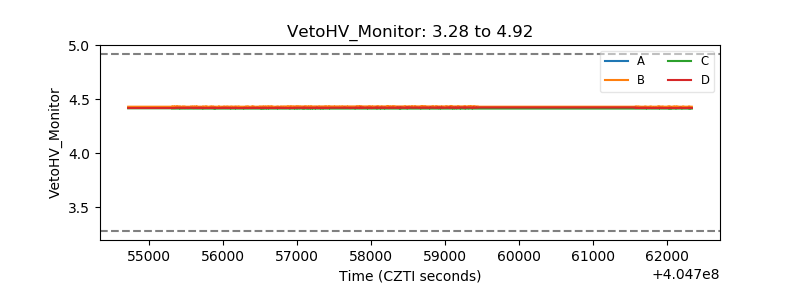 |
| Veto LLD | 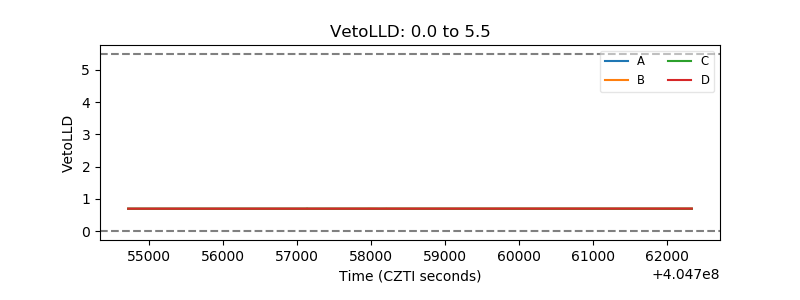 |
| Alpha Counter | 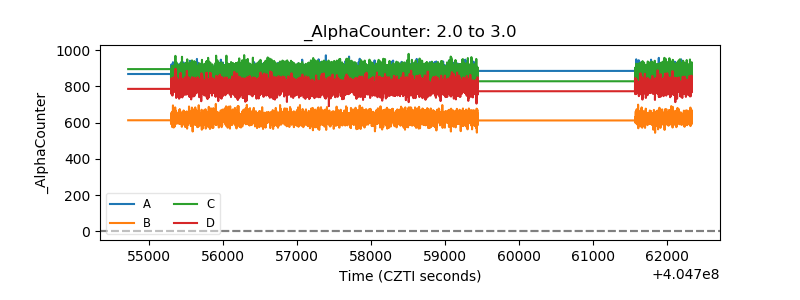 |
| _CPM_Rate | 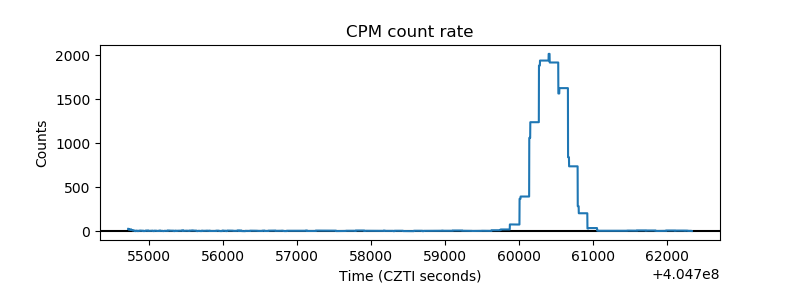 |
| CZT Counter | 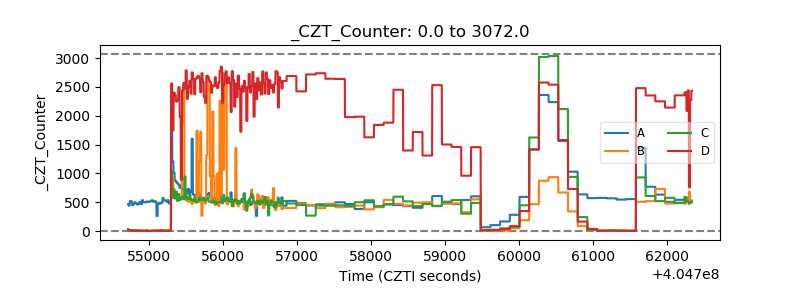 |
| +2.5 Volts monitor | 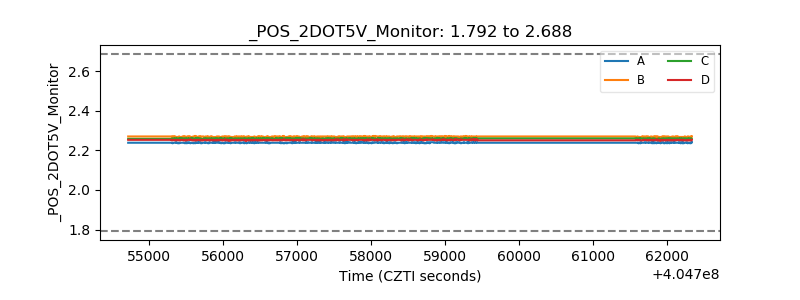 |
| +5 Volts monitor | 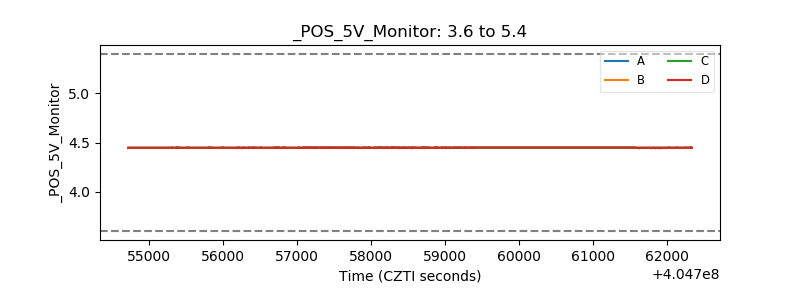 |
| _ROLL_ROT | 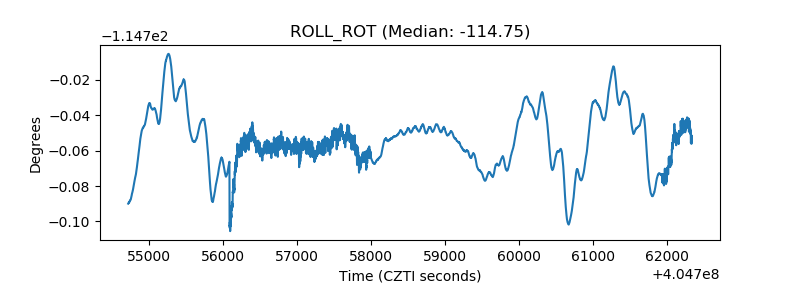 |
| _Roll_DEC | 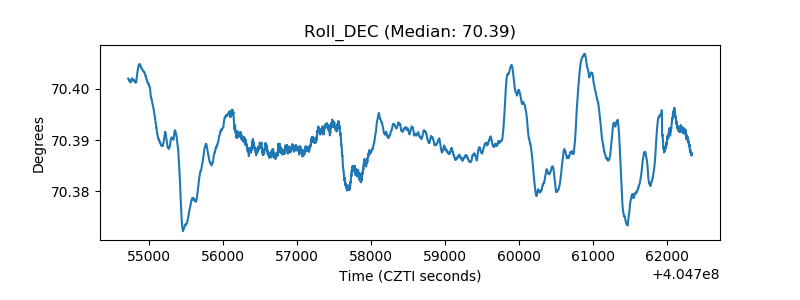 |
| _Roll_RA | 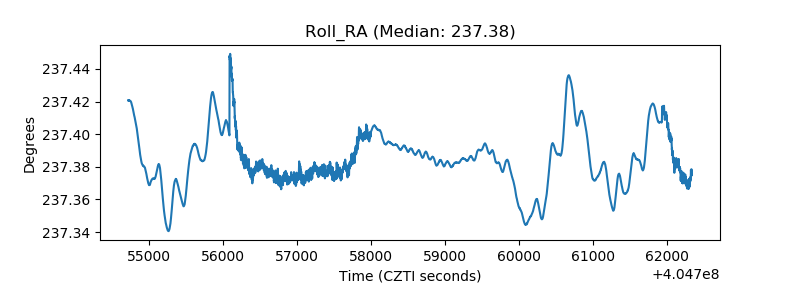 |
| Veto Counter | 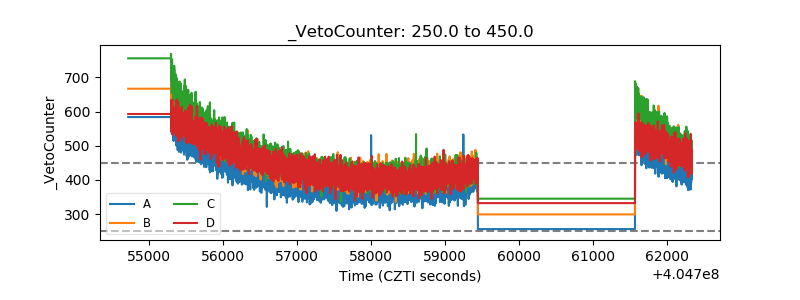 |