| Param | Original file | Final file |
|---|---|---|
| Filename | modeM0/AS1C07_001T12_9000005372_38318cztM0_level2.fits | modeM0/AS1C07_001T12_9000005372_38318cztM0_level2_quad_clean.evt |
| Size (bytes) | 477,521,280 | 79,945,920 |
| Size | 455.4 MB | 76.2 MB |
| Events in quadrant A | 2,573,065 | 594,852 |
| Events in quadrant B | 2,327,208 | 609,106 |
| Events in quadrant C | 2,702,885 | 590,776 |
| Events in quadrant D | 9,698,069 | 287,656 |
| Mode SS | |||
|---|---|---|---|
| Quadrant | BADHDUFLAG | Total packets | Discarded packets |
| A | 0 | 98 | 0 |
| B | 0 | 98 | 0 |
| C | 0 | 98 | 0 |
| D | 0 | 98 | 0 |
| Mode M9 | |||
|---|---|---|---|
| Quadrant | BADHDUFLAG | Total packets | Discarded packets |
| A | 0 | 24 | 0 |
| B | 0 | 24 | 0 |
| C | 0 | 24 | 0 |
| D | 0 | 25 | 0 |
| Mode M0 | |||
|---|---|---|---|
| Quadrant | BADHDUFLAG | Total packets | Discarded packets |
| A | 0 | 10642 | 3 |
| B | 0 | 10134 | 2 |
| C | 0 | 10879 | 2 |
| D | 0 | 32133 | 2 |
| Quadrant | Total seconds | Saturated seconds | Saturation percentage |
|---|---|---|---|
| A | 4821 | 11 | 0.228168% |
| B | 4821 | 16 | 0.331881% |
| C | 4821 | 69 | 1.431238% |
| D | 4821 | 2467 | 51.171956% |
Noise dominated data is calculated using 1-second bins in cleaned event files. If a bin has >2000 counts, and if more than 50% of those come from <1% of pixels, then it is considered to be noise-dominated and hence unusable.
| Quadrant | # 1 sec bins | Bins with >0 counts | Bins with >2000 counts | High rate bins dominated by noise | Noise dominated (total time) | Noise dominated (detector-on time) | Marked lightcurve |
|---|---|---|---|---|---|---|---|
| A | 6974 | 4822 | 6 | 6 | 0.09% | 0.12% | 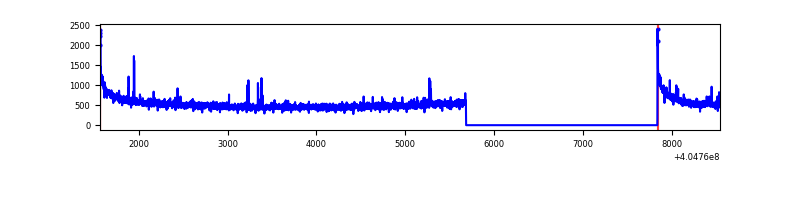 |
| B | 6974 | 4822 | 6 | 6 | 0.09% | 0.12% | 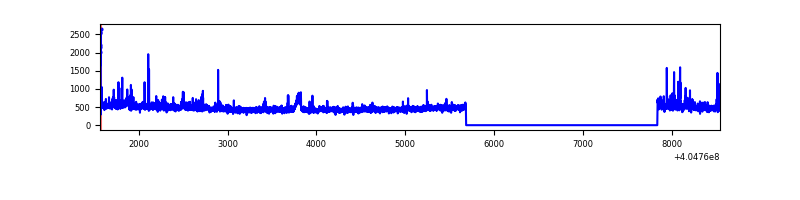 |
| C | 6974 | 4822 | 72 | 72 | 1.03% | 1.49% | 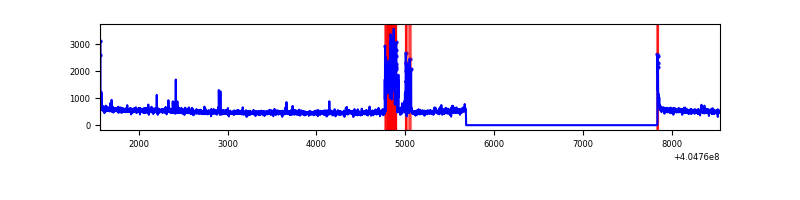 |
| D | 6974 | 4822 | 2630 | 2630 | 37.71% | 54.54% | 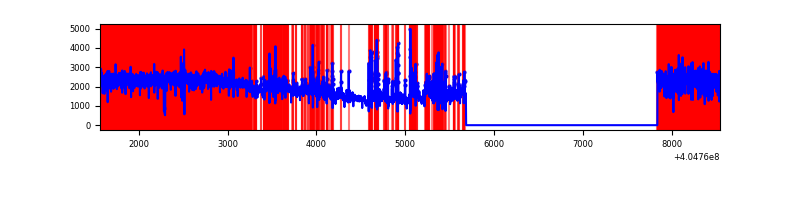 |
Top three noisy pixels from each quadrant. If the there are fewer than three noisy pixels in the level2.evt file, extra rows are filled as -1
| Pixel properties | Quadrant properties | ||||||
|---|---|---|---|---|---|---|---|
| Quadrant | DetID | PixID | Counts | Sigma | Mean | Median | Sigma |
| A | 10 | 83 | 376755 | 3440.01 | 544 | 532 | 109.4 |
| A | 12 | 189 | 37209 | 335.36 | 544 | 532 | 109.4 |
| A | 13 | 248 | 34795 | 313.28 | 544 | 532 | 109.4 |
| B | 0 | 229 | 44672 | 424.46 | 546 | 531 | 104.0 |
| B | 0 | 189 | 27380 | 258.18 | 546 | 531 | 104.0 |
| B | 0 | 183 | 26562 | 250.31 | 546 | 531 | 104.0 |
| C | 3 | 9 | 273686 | 2182.54 | 546 | 550 | 125.1 |
| C | 15 | 214 | 205564 | 1638.2 | 546 | 550 | 125.1 |
| C | 1 | 23 | 43047 | 339.58 | 546 | 550 | 125.1 |
| D | 10 | 203 | 5999560 | 52454.28 | 470 | 456 | 114.4 |
| D | 2 | 16 | 1244425 | 10876.87 | 470 | 456 | 114.4 |
| D | 13 | 138 | 347864 | 3037.63 | 470 | 456 | 114.4 |
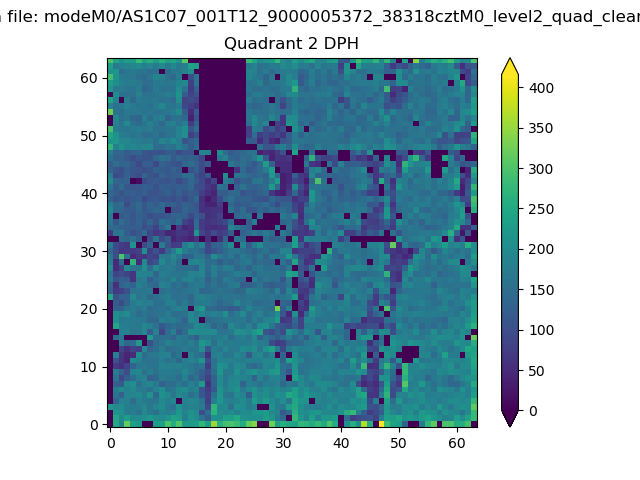
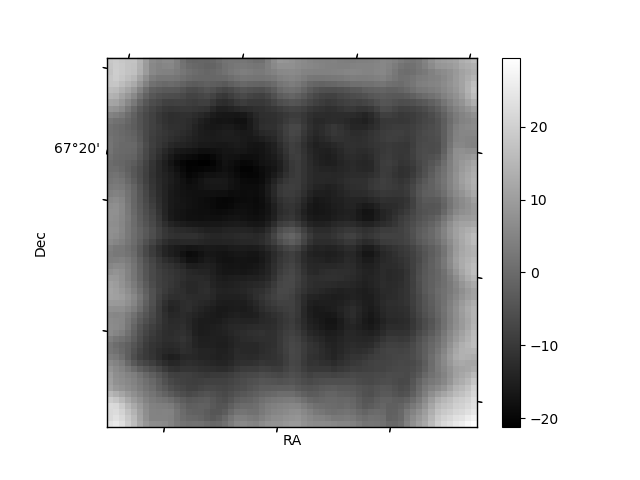
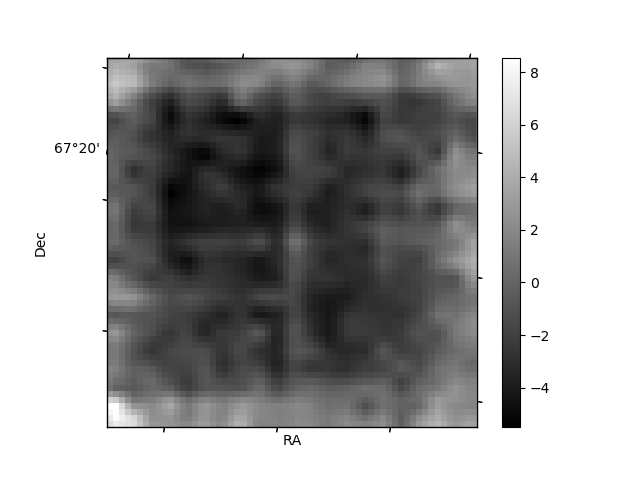
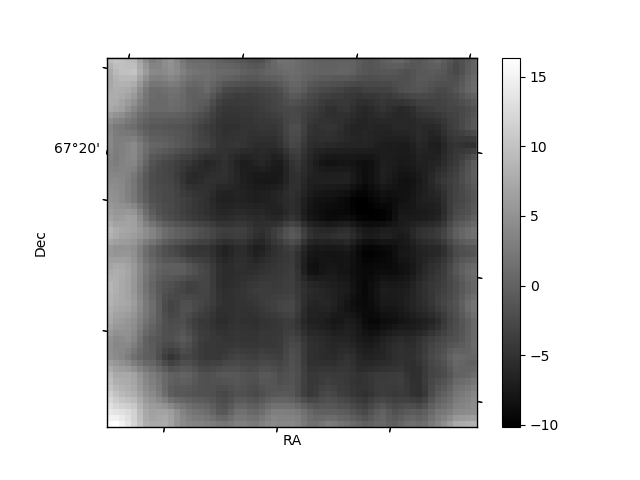
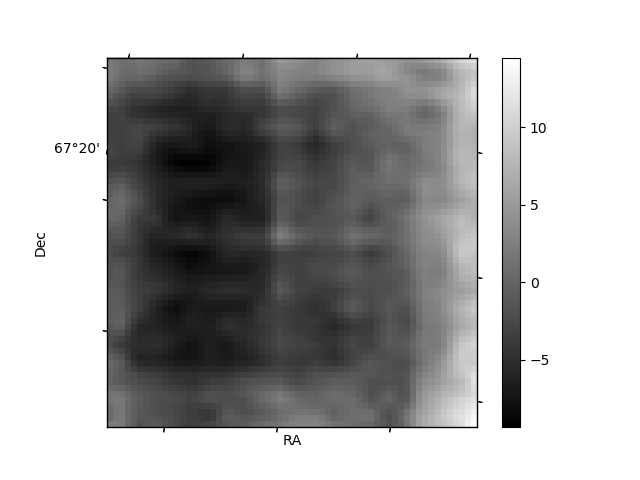
Histogram calculated using DETX and DETY for each event in the final _common_clean file
| Quadrant A | 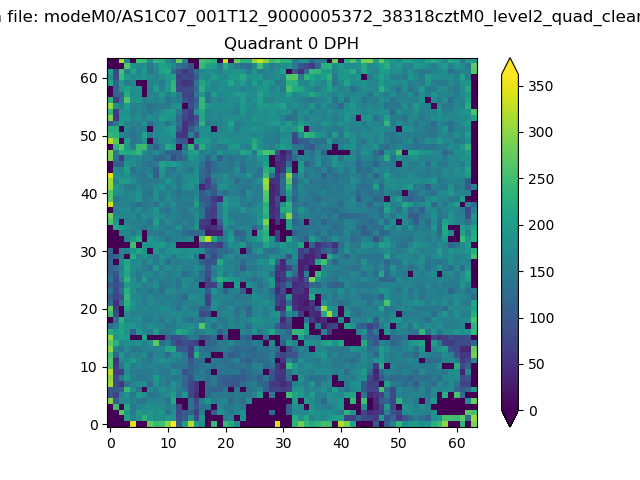 |
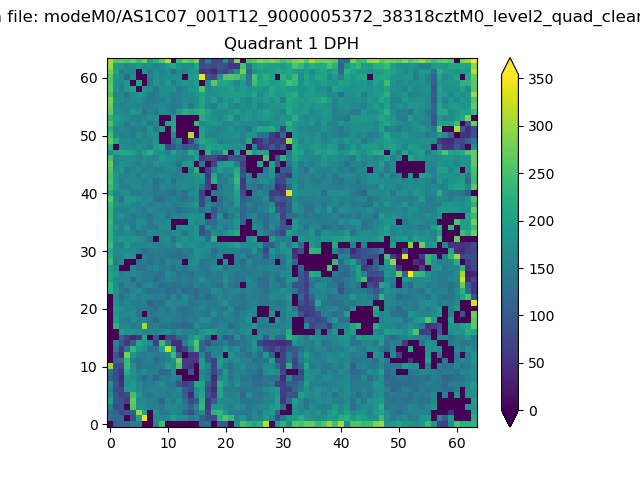 |
Quadrant B |
|---|---|---|---|
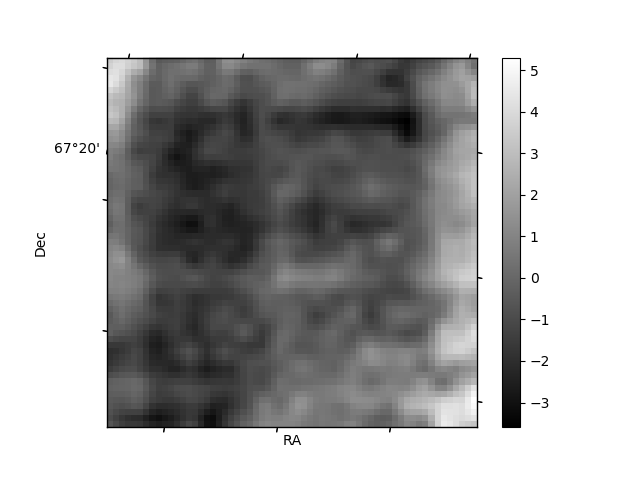
| Quadrant D | 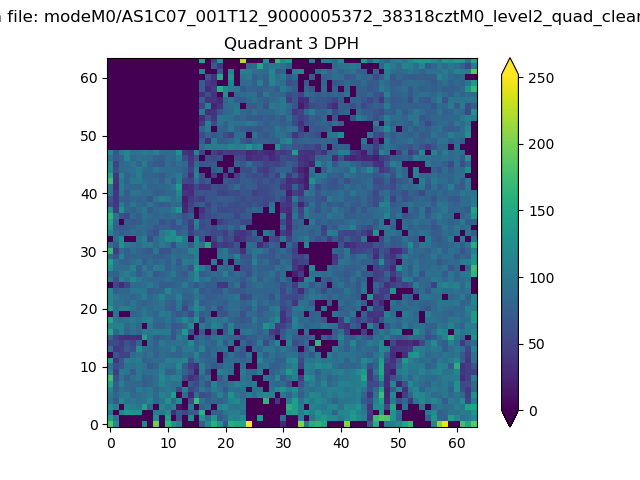 |
 |
Quadrant C |
| Plot type | Count rate plots | Images |
|---|---|---|
| Comparison with Poisson distribution Blue bars denote a histogram of data divided into 1 sec bins. Red curve is a Poisson curve with rate = median count rate of data. |
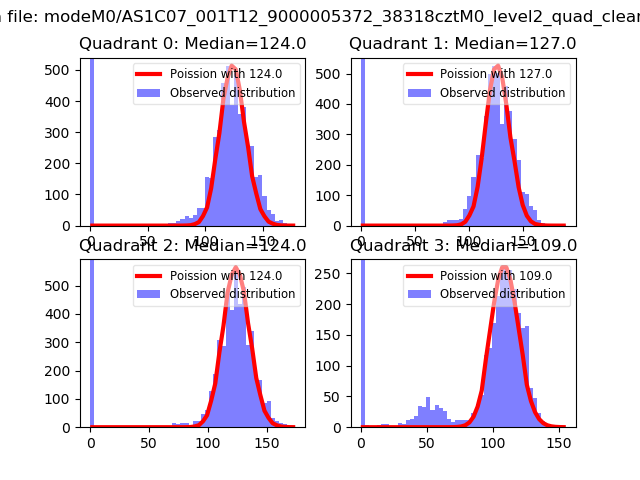 |
 |
| Quadrant-wise count rates Data is divided into 100 sec bins |
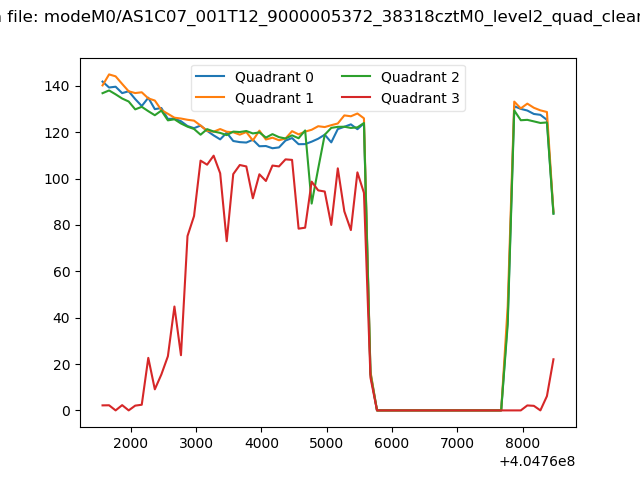 |
|
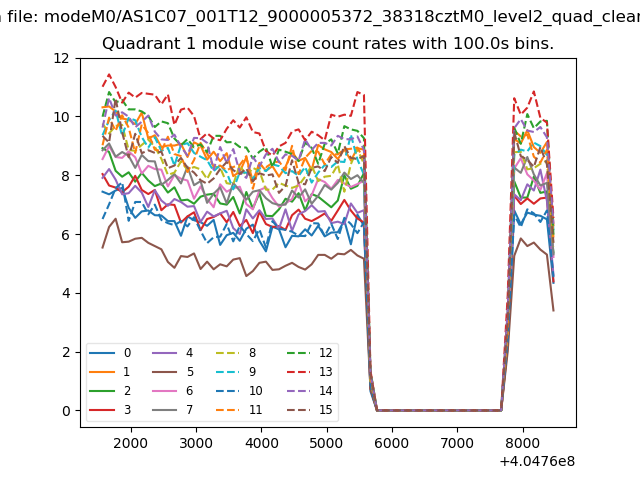
| Module-wise count rates for Quadrant A Data is divided into 100 sec bins |
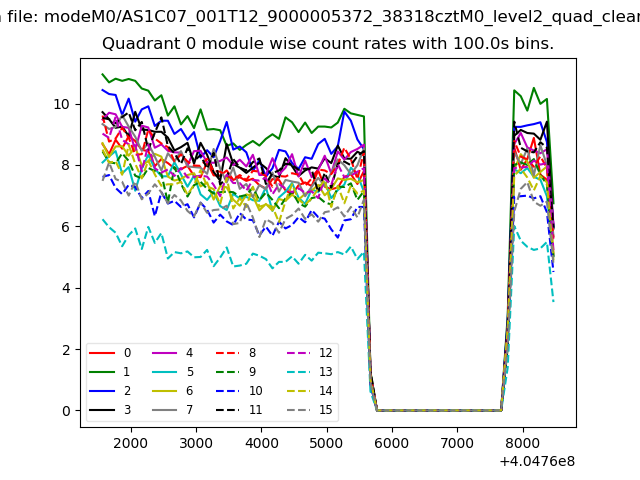 |
 |
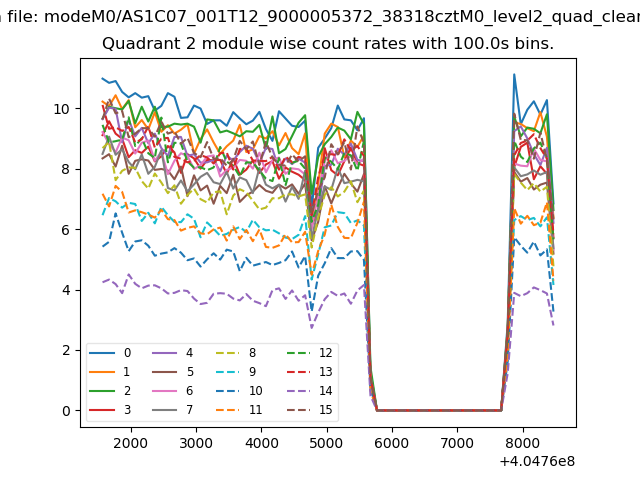
| Module-wise count rates for Quadrant B Data is divided into 100 sec bins |
 |
 |
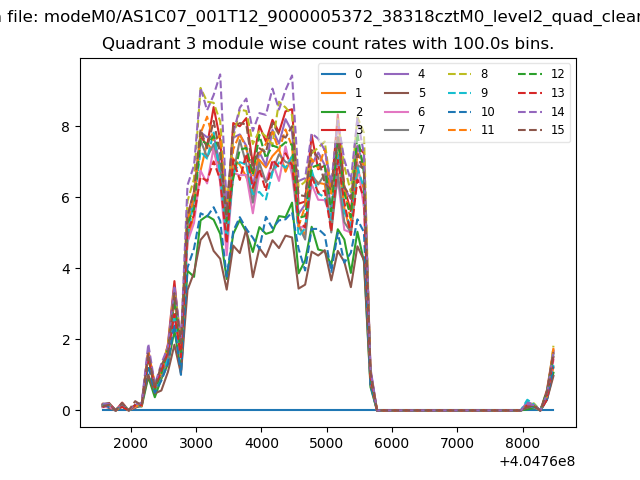
| Module-wise count rates for Quadrant C Data is divided into 100 sec bins |
 |
 |
| Module-wise count rates for Quadrant D Data is divided into 100 sec bins |
 |
 |
| Parameter | Plot |
|---|---|
| CZT HV Monitor | 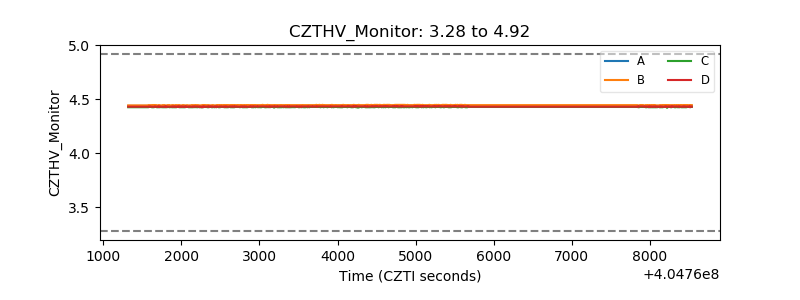 |
| D_VDD | 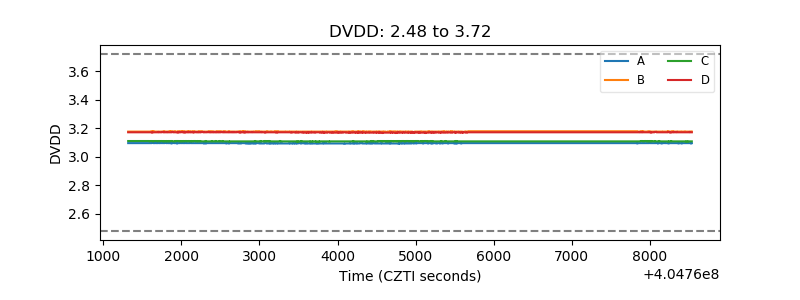 |
| Temperature 1 | 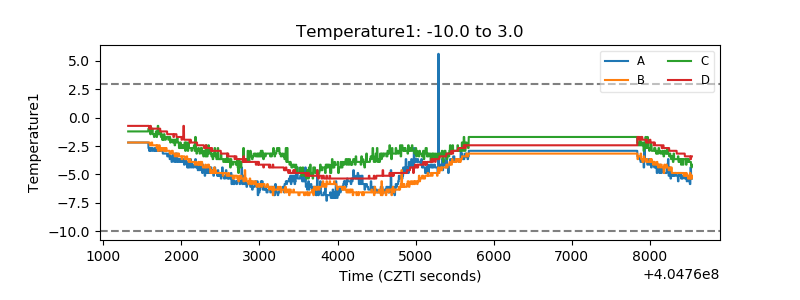 |
| Veto HV Monitor | 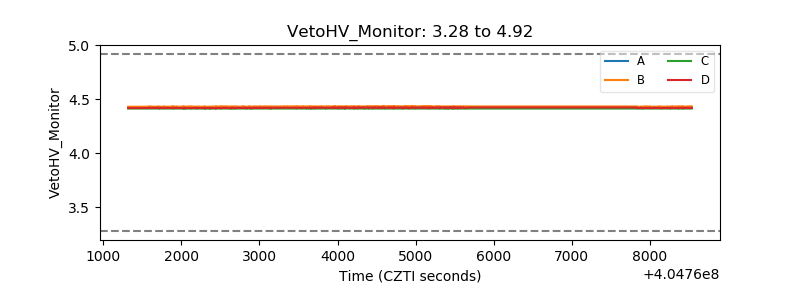 |
| Veto LLD | 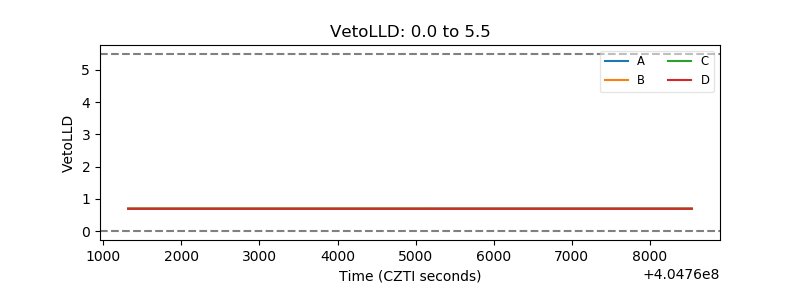 |
| Alpha Counter | 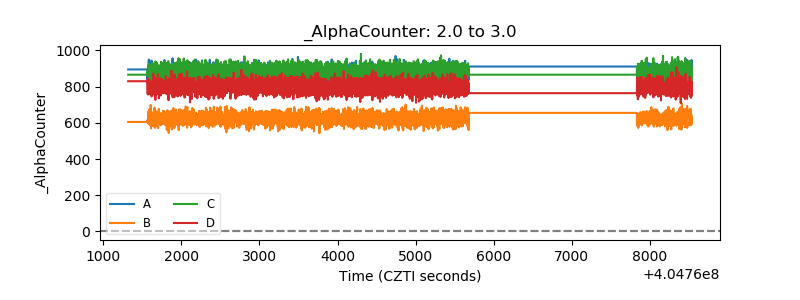 |
| _CPM_Rate | 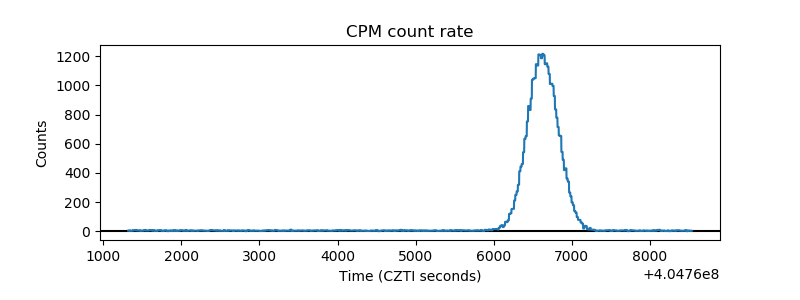 |
| CZT Counter | 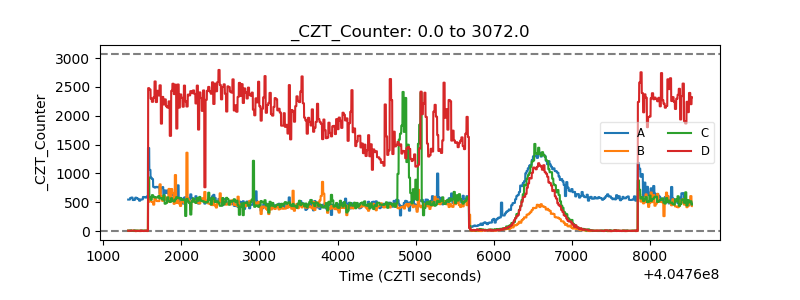 |
| +2.5 Volts monitor | 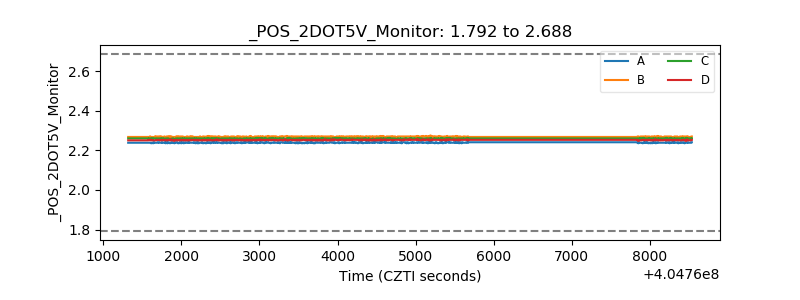 |
| +5 Volts monitor | 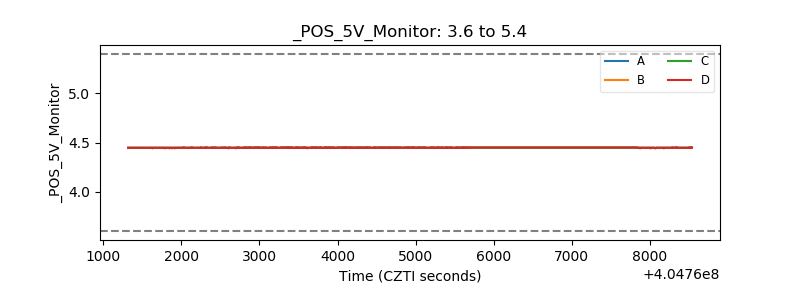 |
| _ROLL_ROT | 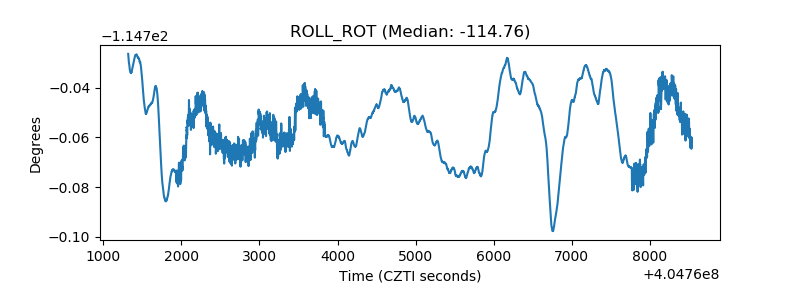 |
| _Roll_DEC | 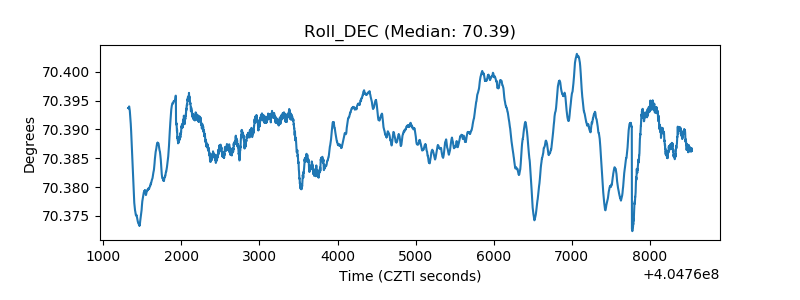 |
| _Roll_RA | 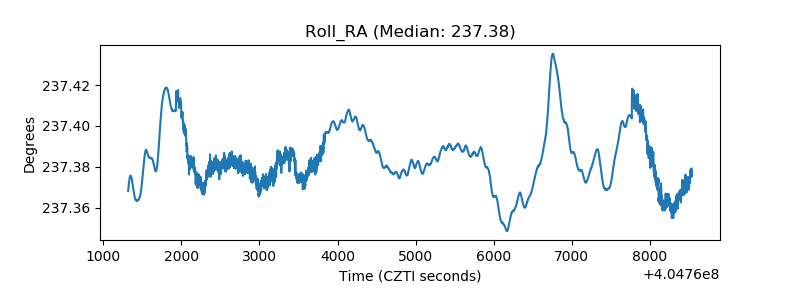 |
| Veto Counter | 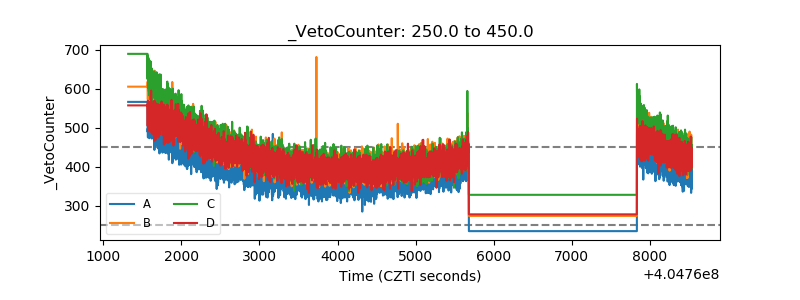 |