| Param | Original file | Final file |
|---|---|---|
| Filename | modeM0/AS1C07_001T12_9000005372_38319cztM0_level2.fits | modeM0/AS1C07_001T12_9000005372_38319cztM0_level2_quad_clean.evt |
| Size (bytes) | 485,449,920 | 78,223,680 |
| Size | 463.0 MB | 74.6 MB |
| Events in quadrant A | 2,583,097 | 577,818 |
| Events in quadrant B | 2,356,223 | 593,829 |
| Events in quadrant C | 2,404,444 | 578,738 |
| Events in quadrant D | 10,241,940 | 272,109 |
| Mode SS | |||
|---|---|---|---|
| Quadrant | BADHDUFLAG | Total packets | Discarded packets |
| A | 0 | 100 | 0 |
| B | 0 | 100 | 0 |
| C | 0 | 100 | 0 |
| D | 0 | 100 | 0 |
| Mode M9 | |||
|---|---|---|---|
| Quadrant | BADHDUFLAG | Total packets | Discarded packets |
| A | 0 | 29 | 0 |
| B | 0 | 29 | 0 |
| C | 0 | 29 | 0 |
| D | 0 | 30 | 0 |
| Mode M0 | |||
|---|---|---|---|
| Quadrant | BADHDUFLAG | Total packets | Discarded packets |
| A | 0 | 10762 | 3 |
| B | 0 | 10449 | 2 |
| C | 0 | 10160 | 2 |
| D | 0 | 33792 | 2 |
| Quadrant | Total seconds | Saturated seconds | Saturation percentage |
|---|---|---|---|
| A | 4937 | 12 | 0.243063% |
| B | 4937 | 19 | 0.384849% |
| C | 4937 | 13 | 0.263318% |
| D | 4937 | 2653 | 53.737087% |
Noise dominated data is calculated using 1-second bins in cleaned event files. If a bin has >2000 counts, and if more than 50% of those come from <1% of pixels, then it is considered to be noise-dominated and hence unusable.
| Quadrant | # 1 sec bins | Bins with >0 counts | Bins with >2000 counts | High rate bins dominated by noise | Noise dominated (total time) | Noise dominated (detector-on time) | Marked lightcurve |
|---|---|---|---|---|---|---|---|
| A | 7030 | 4938 | 6 | 6 | 0.09% | 0.12% | 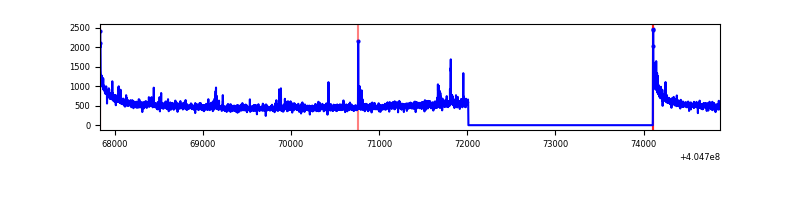 |
| B | 7030 | 4938 | 9 | 9 | 0.13% | 0.18% | 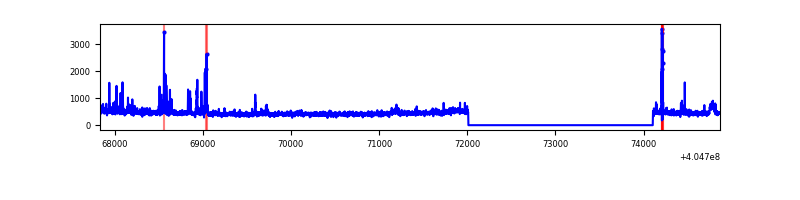 |
| C | 7030 | 4938 | 8 | 8 | 0.11% | 0.16% | 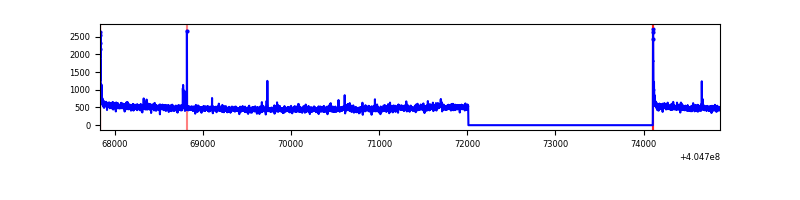 |
| D | 7030 | 4937 | 2631 | 2631 | 37.43% | 53.29% | 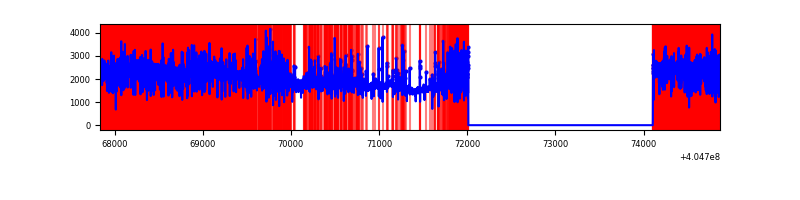 |
Top three noisy pixels from each quadrant. If the there are fewer than three noisy pixels in the level2.evt file, extra rows are filled as -1
| Pixel properties | Quadrant properties | ||||||
|---|---|---|---|---|---|---|---|
| Quadrant | DetID | PixID | Counts | Sigma | Mean | Median | Sigma |
| A | 10 | 83 | 377109 | 3443.41 | 540 | 530 | 109.4 |
| A | 12 | 189 | 43856 | 396.17 | 540 | 530 | 109.4 |
| A | 13 | 248 | 36340 | 327.44 | 540 | 530 | 109.4 |
| B | 5 | 184 | 68759 | 660.56 | 541 | 527 | 103.3 |
| B | 4 | 81 | 45633 | 436.67 | 541 | 527 | 103.3 |
| B | 0 | 183 | 33931 | 323.39 | 541 | 527 | 103.3 |
| C | 15 | 214 | 210270 | 1665.55 | 539 | 542 | 125.9 |
| C | 0 | 10 | 38507 | 301.5 | 539 | 542 | 125.9 |
| C | 1 | 23 | 24744 | 192.2 | 539 | 542 | 125.9 |
| D | 10 | 203 | 6011613 | 55430.25 | 444 | 432 | 108.4 |
| D | 2 | 16 | 2097435 | 19336.87 | 444 | 432 | 108.4 |
| D | 13 | 138 | 204330 | 1880.18 | 444 | 432 | 108.4 |
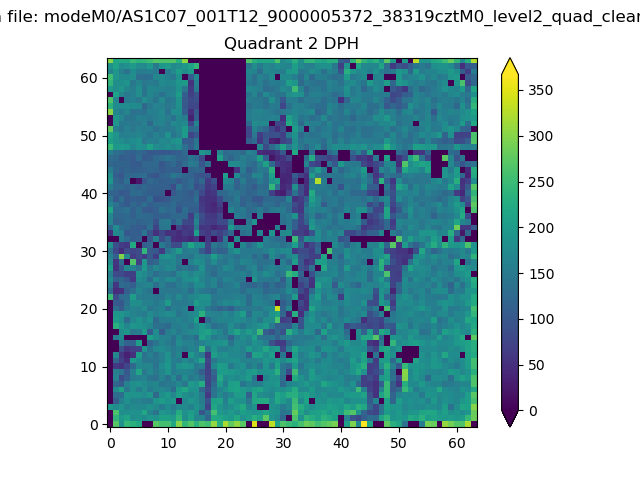
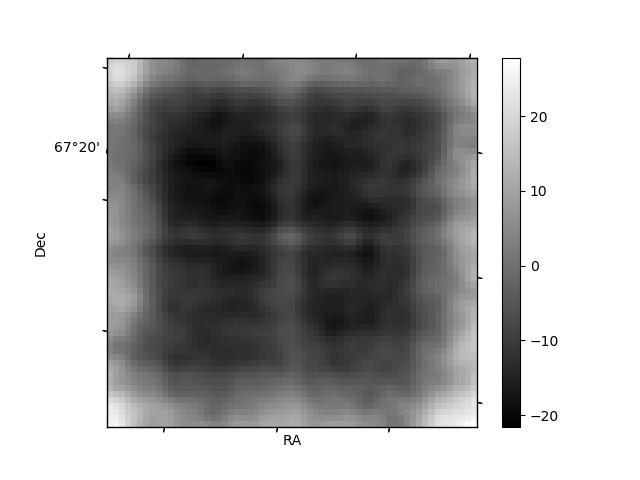
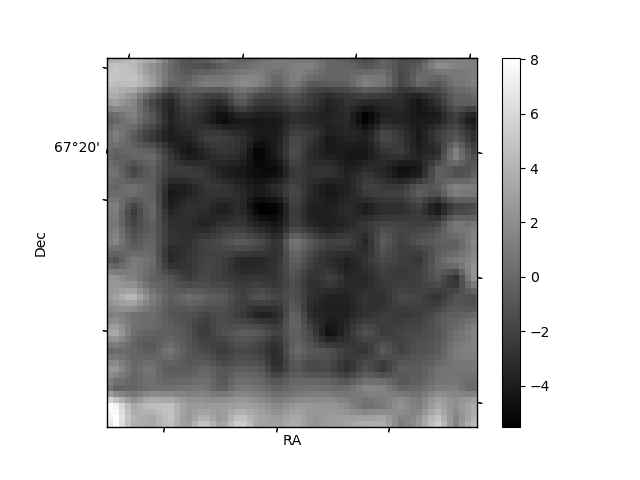
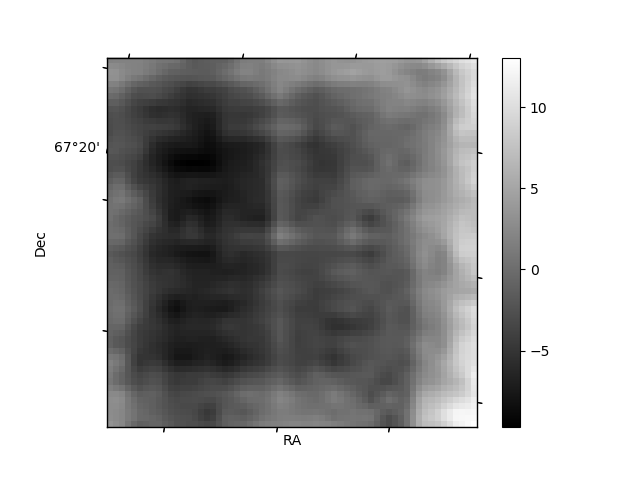
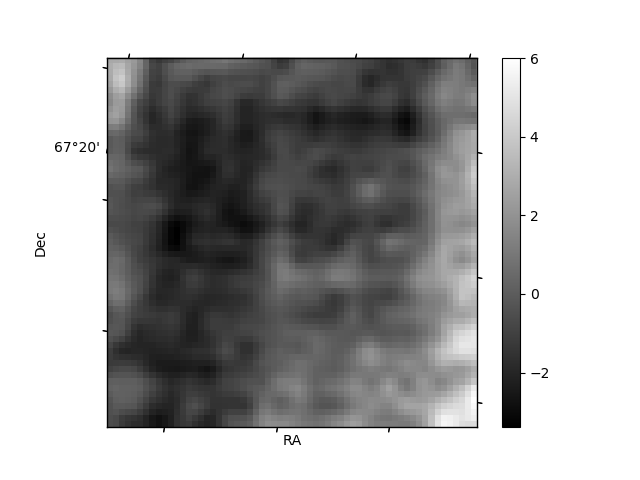
Histogram calculated using DETX and DETY for each event in the final _common_clean file
| Quadrant A | 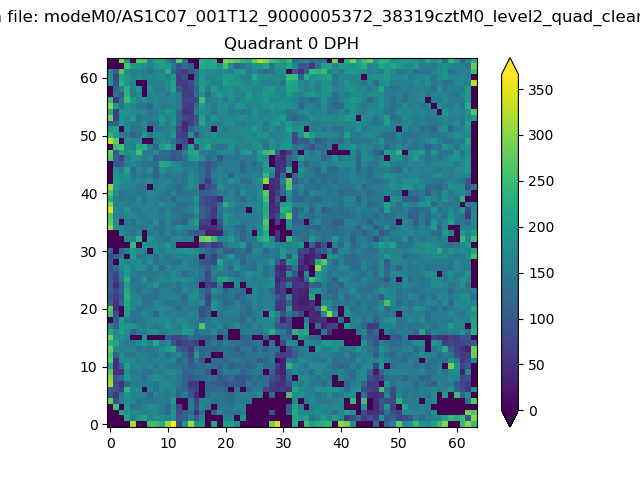 |
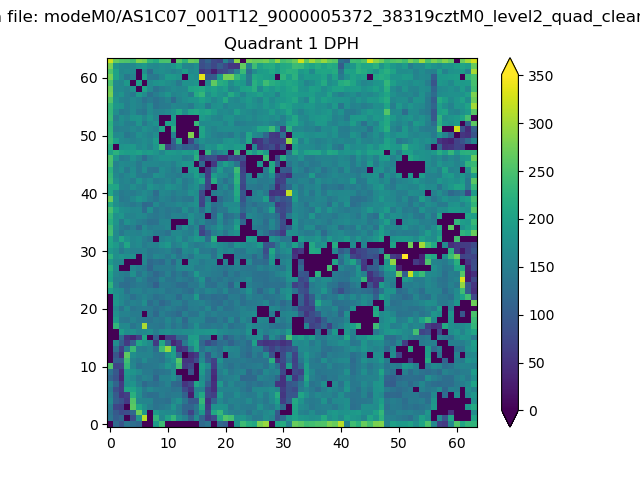 |
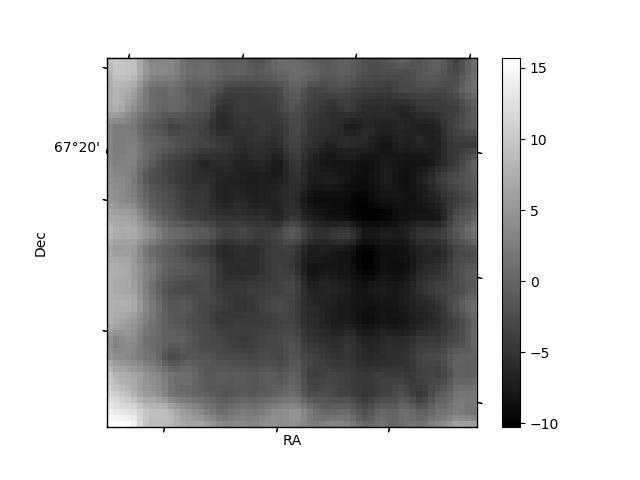
Quadrant B |
|---|---|---|---|
| Quadrant D | 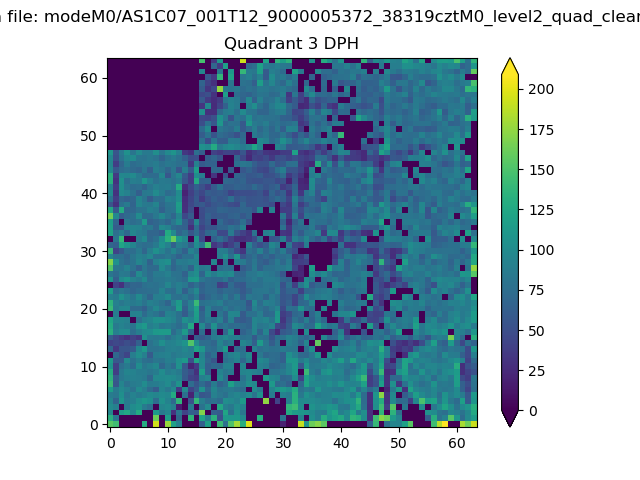 |
 |
Quadrant C |
| Plot type | Count rate plots | Images |
|---|---|---|
| Comparison with Poisson distribution Blue bars denote a histogram of data divided into 1 sec bins. Red curve is a Poisson curve with rate = median count rate of data. |
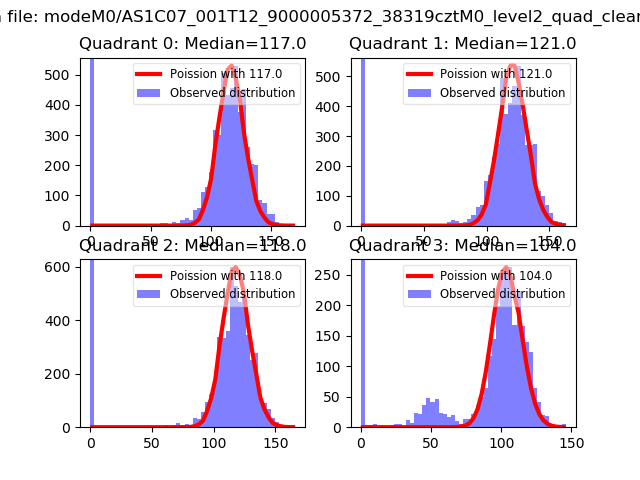 |
 |
| Quadrant-wise count rates Data is divided into 100 sec bins |
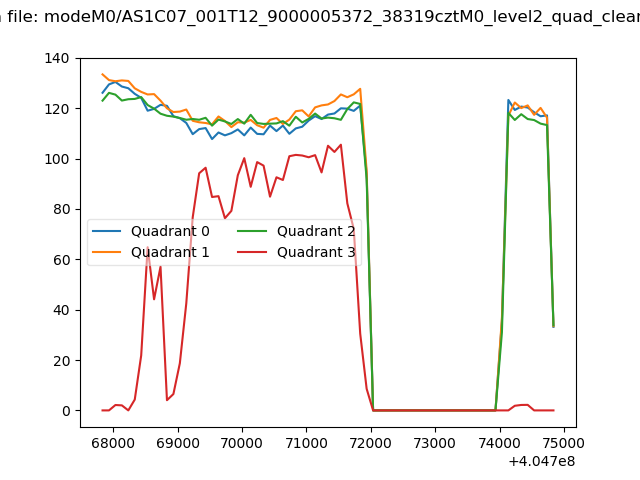 |
|
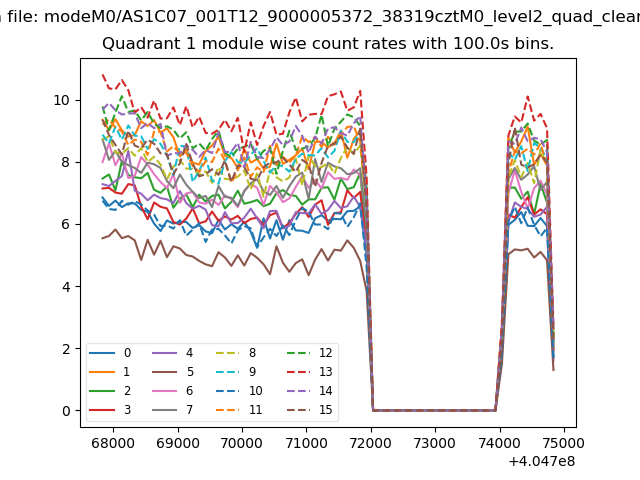
| Module-wise count rates for Quadrant A Data is divided into 100 sec bins |
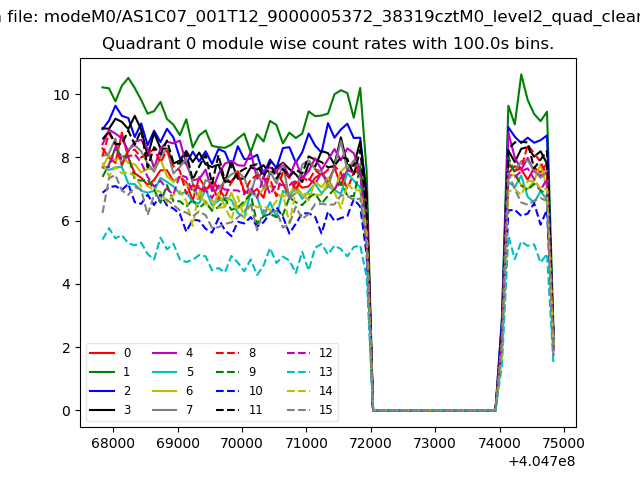 |
 |
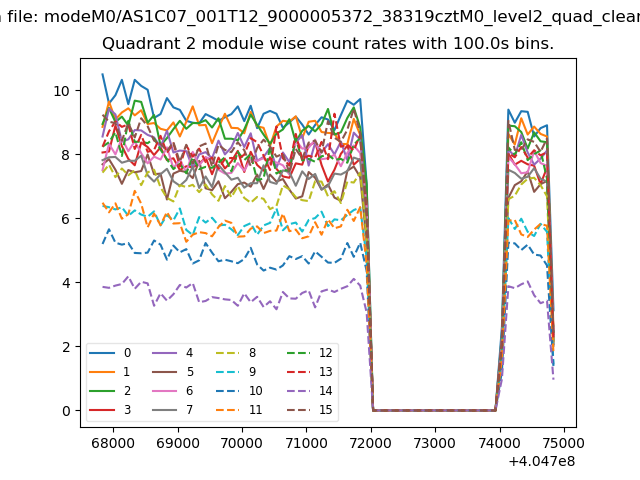
| Module-wise count rates for Quadrant B Data is divided into 100 sec bins |
 |
 |
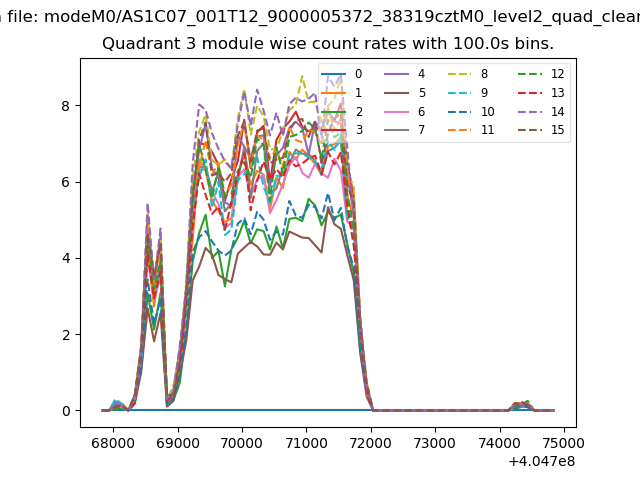
| Module-wise count rates for Quadrant C Data is divided into 100 sec bins |
 |
 |
| Module-wise count rates for Quadrant D Data is divided into 100 sec bins |
 |
 |
| Parameter | Plot |
|---|---|
| CZT HV Monitor | 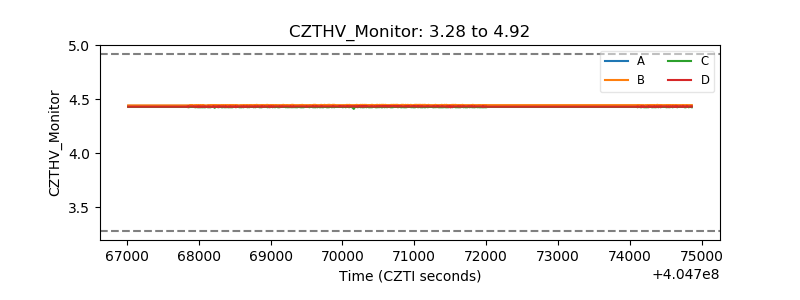 |
| D_VDD | 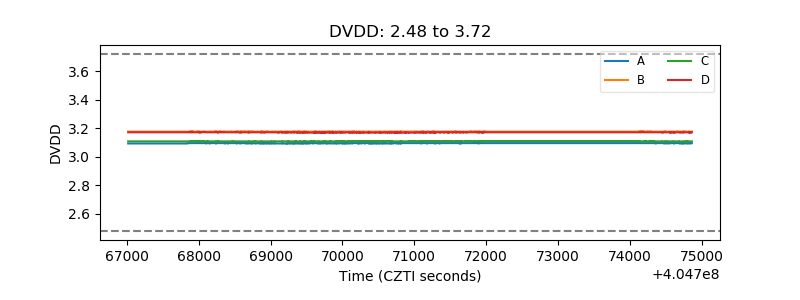 |
| Temperature 1 | 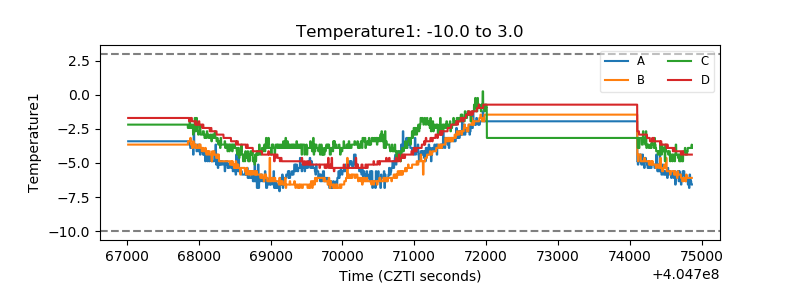 |
| Veto HV Monitor | 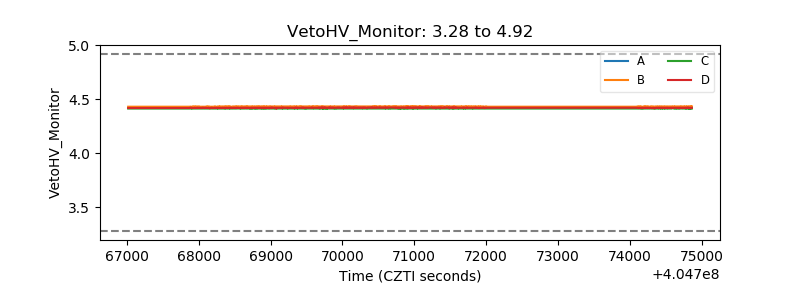 |
| Veto LLD | 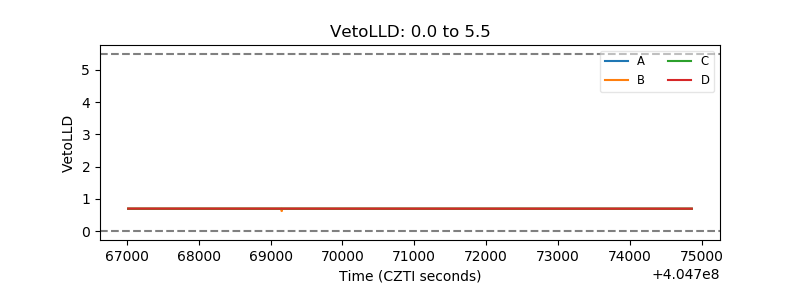 |
| Alpha Counter | 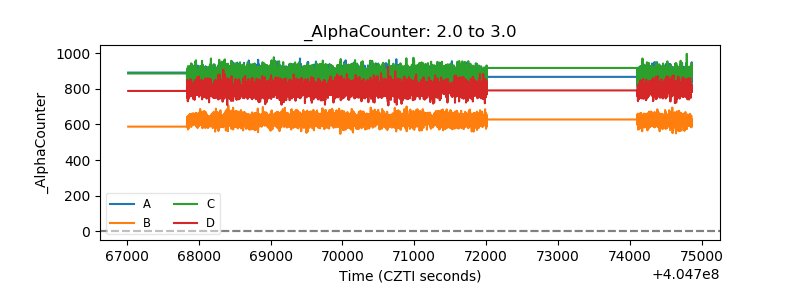 |
| _CPM_Rate | 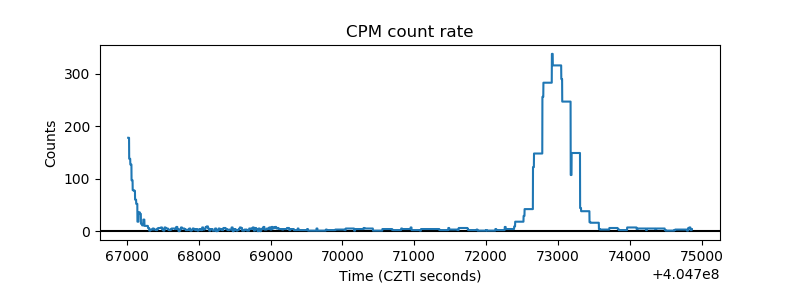 |
| CZT Counter | 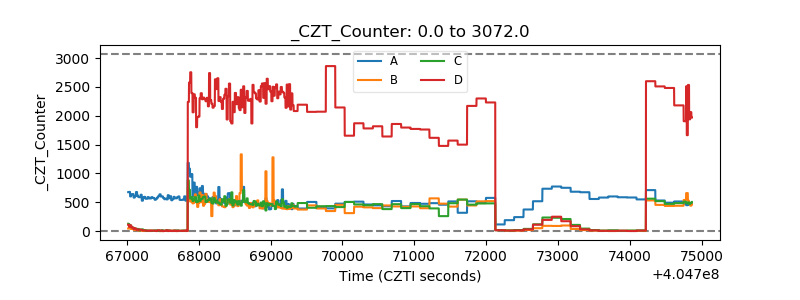 |
| +2.5 Volts monitor | 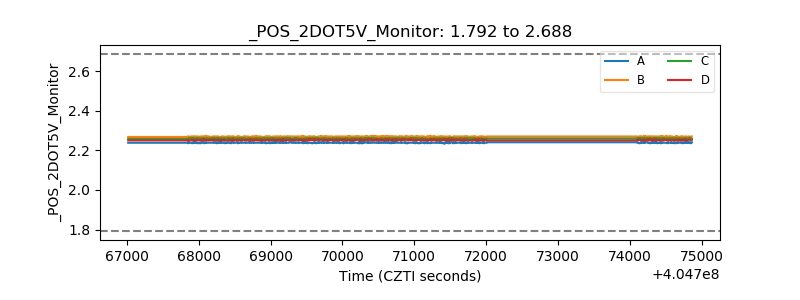 |
| +5 Volts monitor | 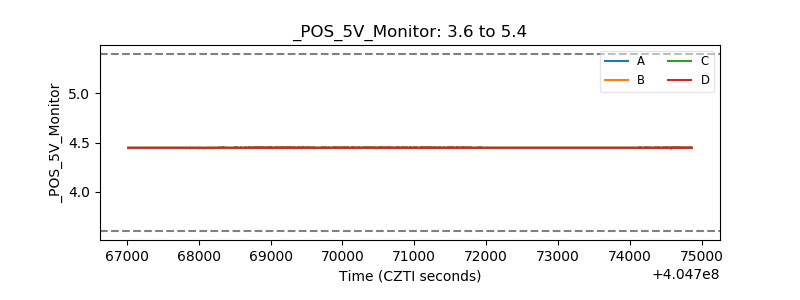 |
| _ROLL_ROT | 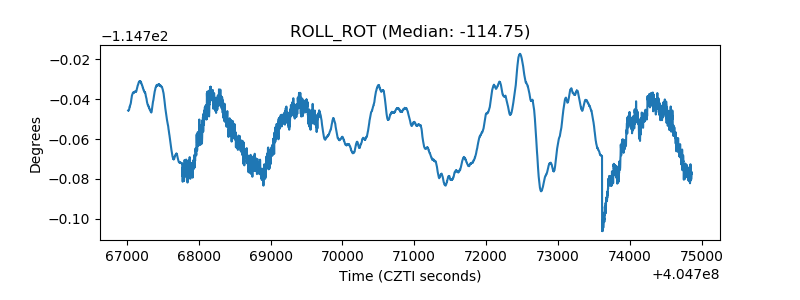 |
| _Roll_DEC | 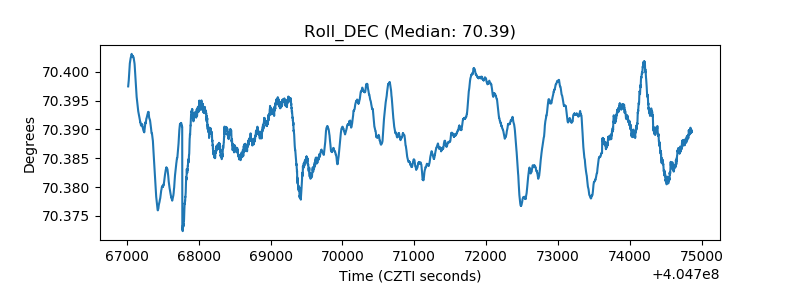 |
| _Roll_RA | 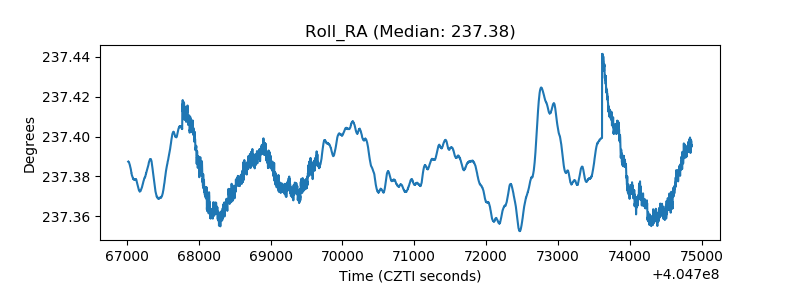 |
| Veto Counter | 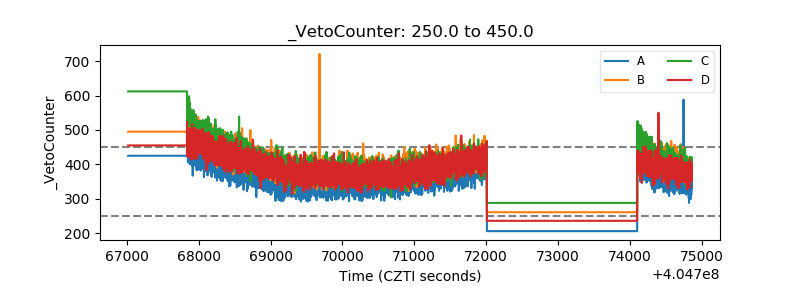 |