| Param | Original file | Final file |
|---|---|---|
| Filename | modeM0/AS1C07_001T12_9000005372_38320cztM0_level2.fits | modeM0/AS1C07_001T12_9000005372_38320cztM0_level2_quad_clean.evt |
| Size (bytes) | 519,713,280 | 83,560,320 |
| Size | 495.6 MB | 79.7 MB |
| Events in quadrant A | 2,771,656 | 614,870 |
| Events in quadrant B | 2,479,746 | 625,859 |
| Events in quadrant C | 2,591,371 | 612,439 |
| Events in quadrant D | 10,970,572 | 295,065 |
| Mode SS | |||
|---|---|---|---|
| Quadrant | BADHDUFLAG | Total packets | Discarded packets |
| A | 0 | 110 | 0 |
| B | 0 | 110 | 0 |
| C | 0 | 110 | 0 |
| D | 0 | 110 | 0 |
| Mode M9 | |||
|---|---|---|---|
| Quadrant | BADHDUFLAG | Total packets | Discarded packets |
| A | 0 | 33 | 0 |
| B | 0 | 33 | 0 |
| C | 0 | 33 | 0 |
| D | 0 | 34 | 0 |
| Mode M0 | |||
|---|---|---|---|
| Quadrant | BADHDUFLAG | Total packets | Discarded packets |
| A | 0 | 11733 | 3 |
| B | 0 | 11283 | 2 |
| C | 0 | 11161 | 2 |
| D | 0 | 36329 | 2 |
| Quadrant | Total seconds | Saturated seconds | Saturation percentage |
|---|---|---|---|
| A | 5458 | 11 | 0.201539% |
| B | 5458 | 19 | 0.348113% |
| C | 5458 | 15 | 0.274826% |
| D | 5458 | 2924 | 53.572737% |
Noise dominated data is calculated using 1-second bins in cleaned event files. If a bin has >2000 counts, and if more than 50% of those come from <1% of pixels, then it is considered to be noise-dominated and hence unusable.
| Quadrant | # 1 sec bins | Bins with >0 counts | Bins with >2000 counts | High rate bins dominated by noise | Noise dominated (total time) | Noise dominated (detector-on time) | Marked lightcurve |
|---|---|---|---|---|---|---|---|
| A | 7311 | 5459 | 7 | 7 | 0.10% | 0.13% | 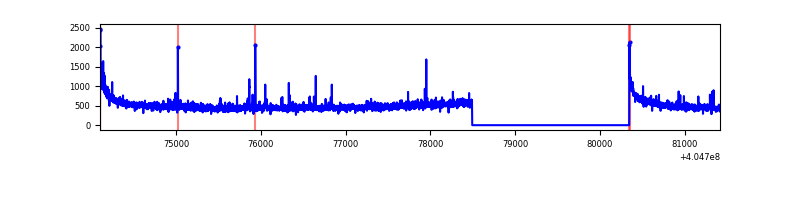 |
| B | 7311 | 5459 | 10 | 10 | 0.14% | 0.18% | 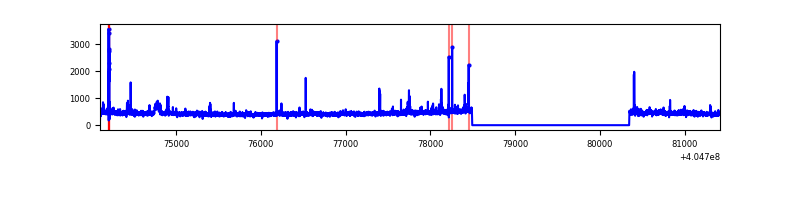 |
| C | 7311 | 5459 | 6 | 6 | 0.08% | 0.11% | 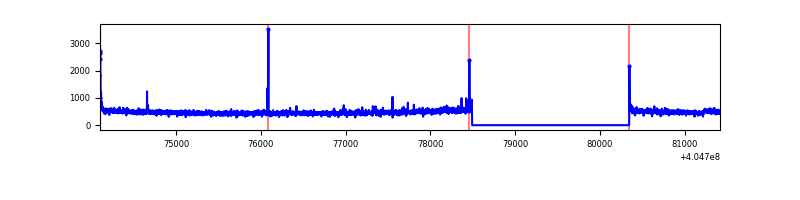 |
| D | 7311 | 5459 | 2644 | 2644 | 36.16% | 48.43% | 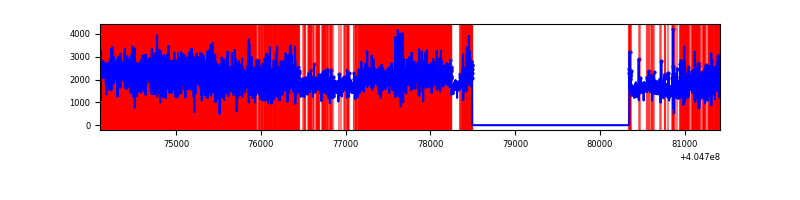 |
Top three noisy pixels from each quadrant. If the there are fewer than three noisy pixels in the level2.evt file, extra rows are filled as -1
| Pixel properties | Quadrant properties | ||||||
|---|---|---|---|---|---|---|---|
| Quadrant | DetID | PixID | Counts | Sigma | Mean | Median | Sigma |
| A | 10 | 83 | 387767 | 3236.4 | 587 | 575 | 119.6 |
| A | 9 | 143 | 39298 | 323.67 | 587 | 575 | 119.6 |
| A | 12 | 189 | 29820 | 244.45 | 587 | 575 | 119.6 |
| B | 0 | 183 | 61460 | 544.74 | 586 | 572 | 111.8 |
| B | 15 | 35 | 28236 | 247.5 | 586 | 572 | 111.8 |
| B | 15 | 32 | 22758 | 198.49 | 586 | 572 | 111.8 |
| C | 15 | 214 | 233707 | 1734.41 | 580 | 583 | 134.4 |
| C | 0 | 10 | 25552 | 185.77 | 580 | 583 | 134.4 |
| C | 14 | 67 | 21703 | 157.13 | 580 | 583 | 134.4 |
| D | 10 | 203 | 5391492 | 46583.39 | 476 | 463 | 115.7 |
| D | 2 | 16 | 3152848 | 27239.47 | 476 | 463 | 115.7 |
| D | 12 | 235 | 138223 | 1190.37 | 476 | 463 | 115.7 |
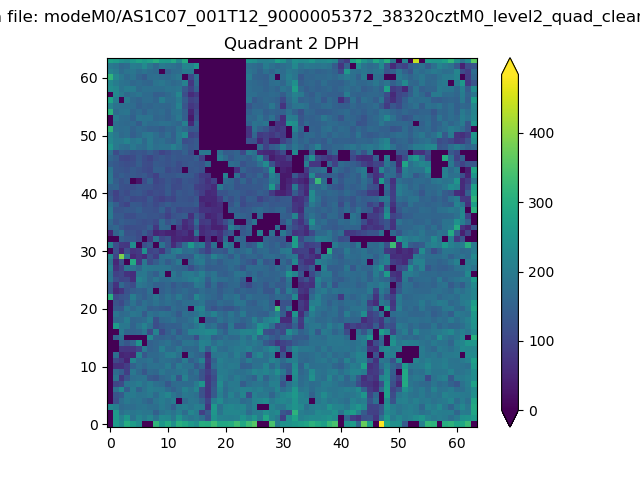
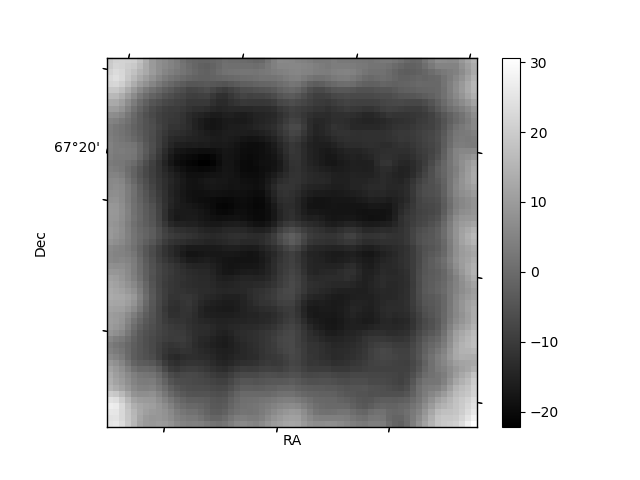
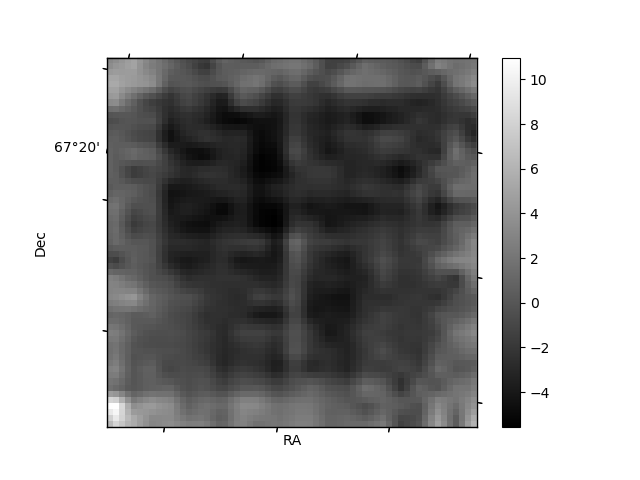
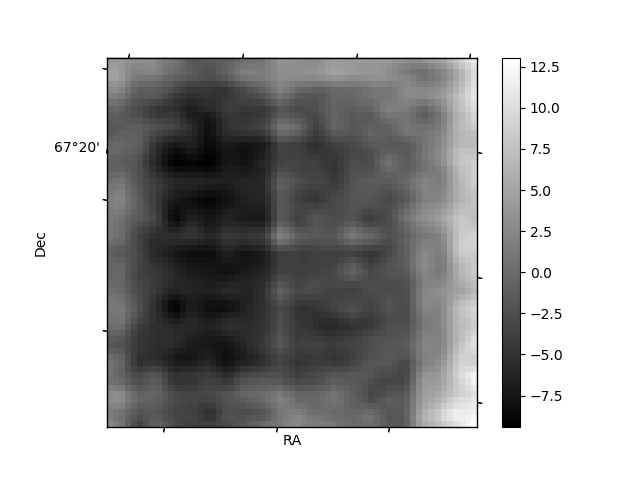
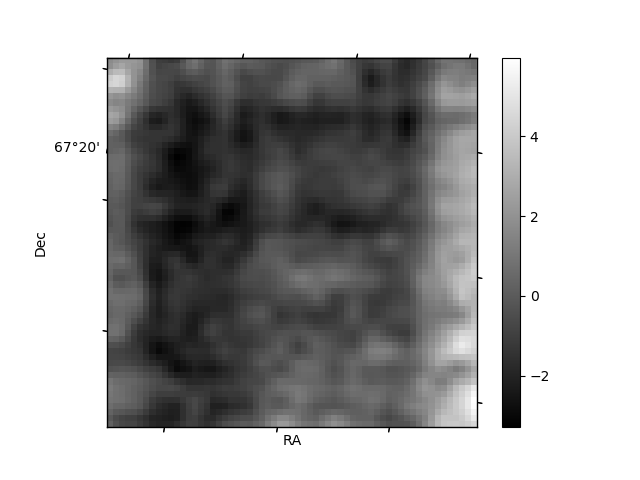
Histogram calculated using DETX and DETY for each event in the final _common_clean file
| Quadrant A | 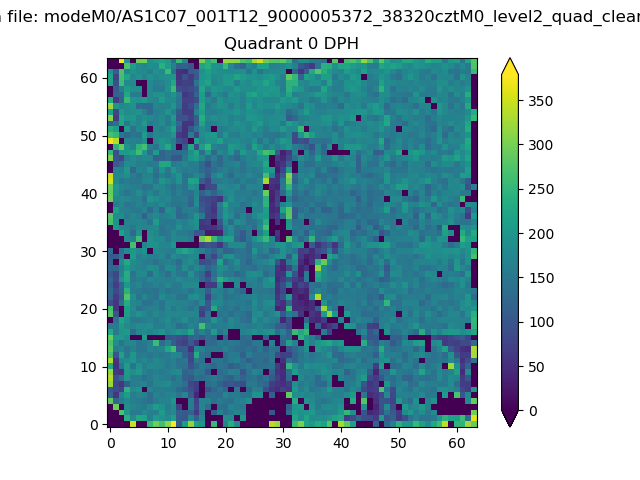 |
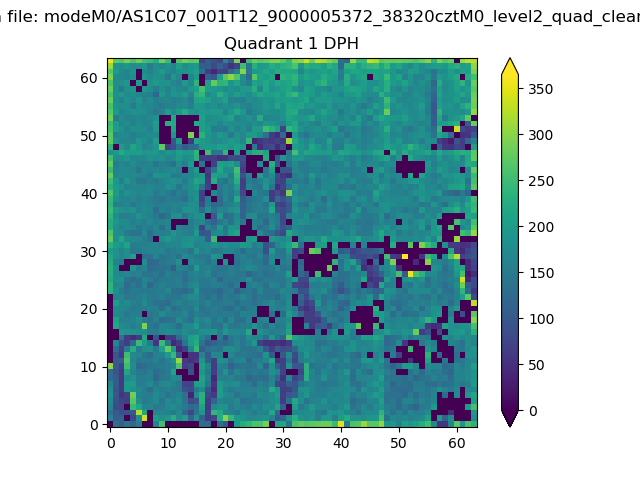 |
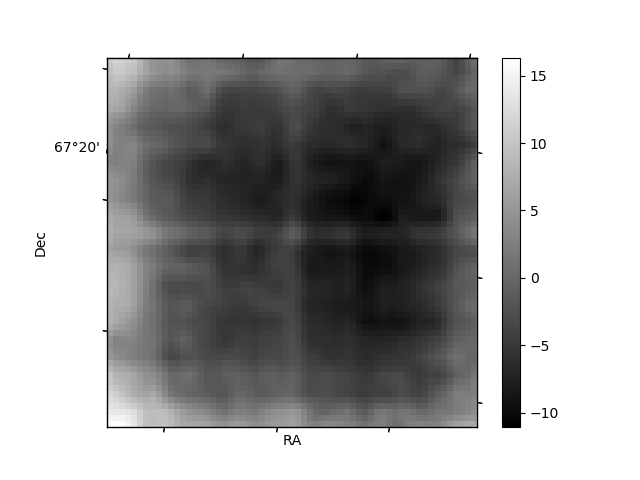
Quadrant B |
|---|---|---|---|
| Quadrant D | 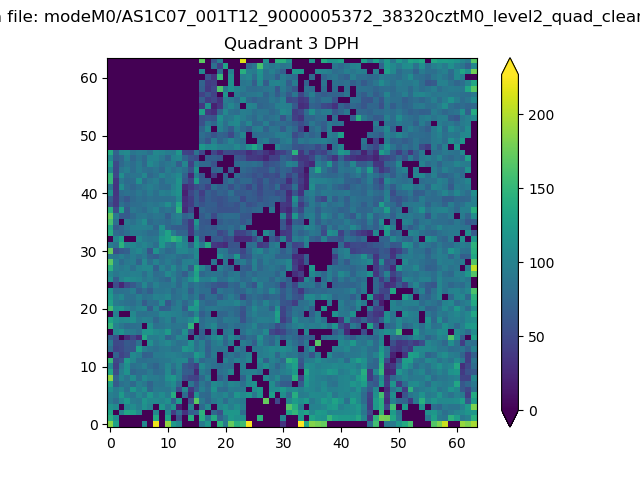 |
 |
Quadrant C |
| Plot type | Count rate plots | Images |
|---|---|---|
| Comparison with Poisson distribution Blue bars denote a histogram of data divided into 1 sec bins. Red curve is a Poisson curve with rate = median count rate of data. |
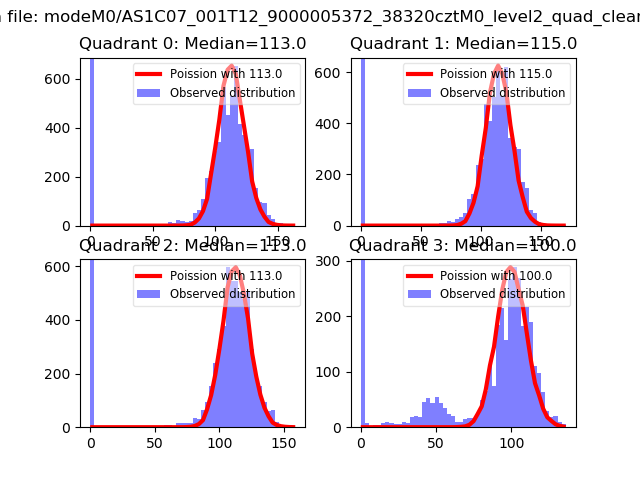 |
 |
| Quadrant-wise count rates Data is divided into 100 sec bins |
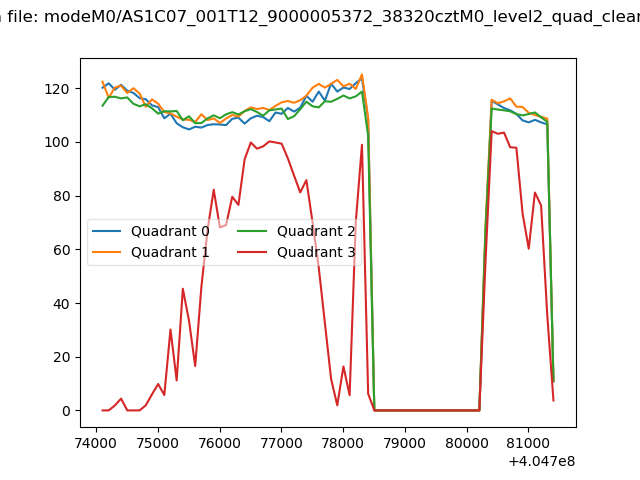 |
|
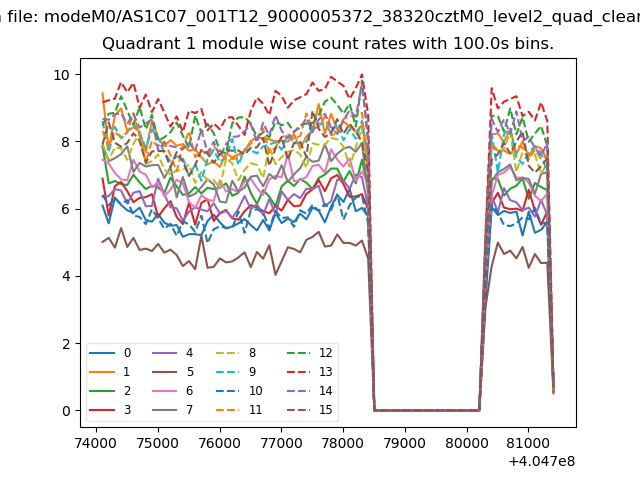
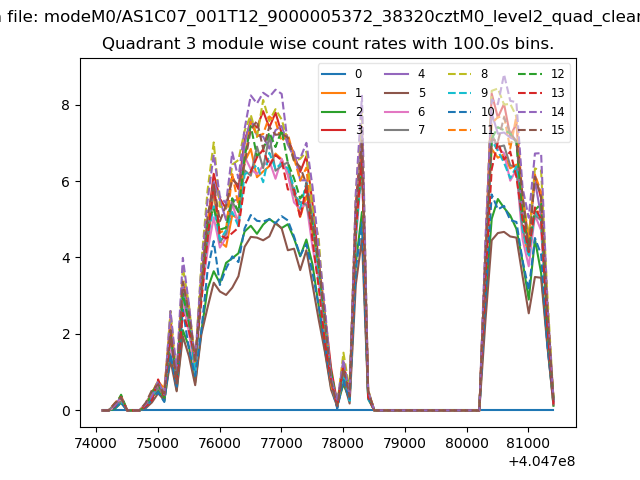
| Module-wise count rates for Quadrant A Data is divided into 100 sec bins |
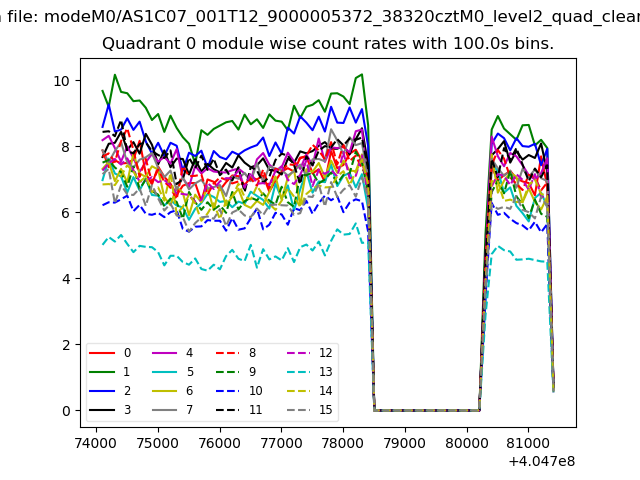 |
 |
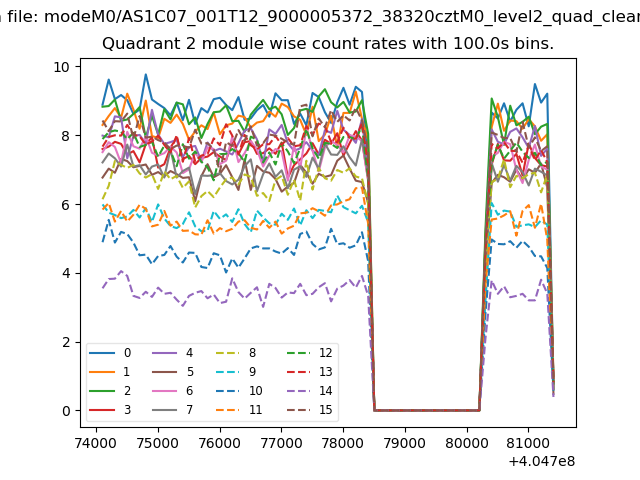
| Module-wise count rates for Quadrant B Data is divided into 100 sec bins |
 |
 |
| Module-wise count rates for Quadrant C Data is divided into 100 sec bins |
 |
 |
| Module-wise count rates for Quadrant D Data is divided into 100 sec bins |
 |
 |
| Parameter | Plot |
|---|---|
| CZT HV Monitor |  |
| D_VDD | 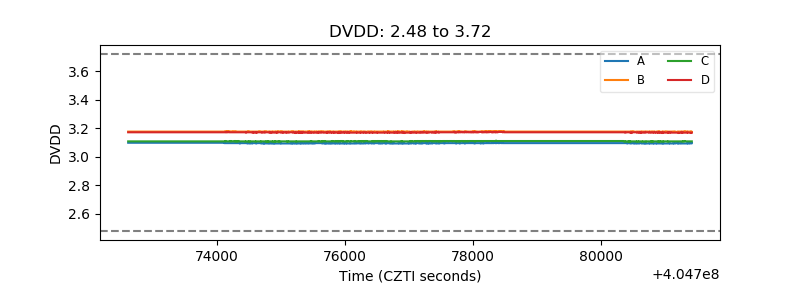 |
| Temperature 1 | 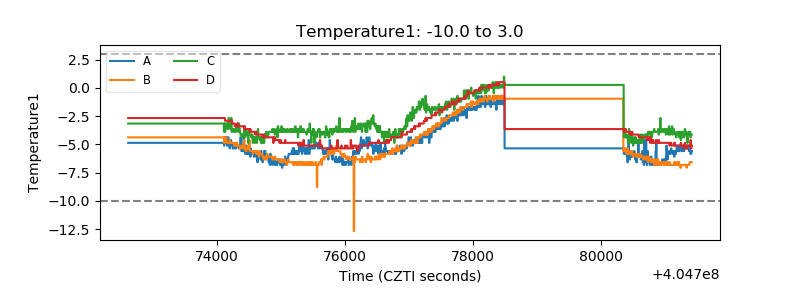 |
| Veto HV Monitor | 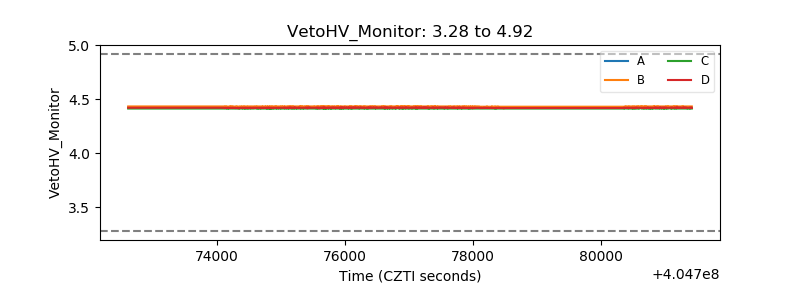 |
| Veto LLD | 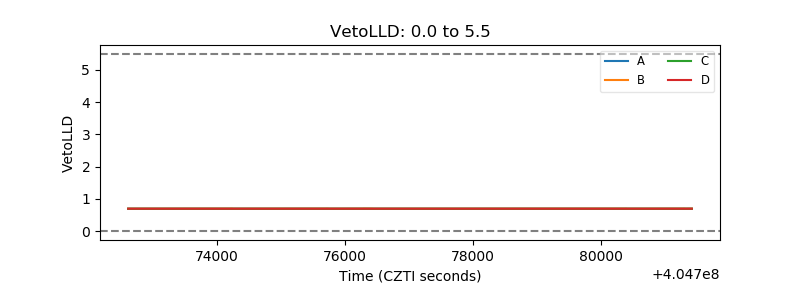 |
| Alpha Counter | 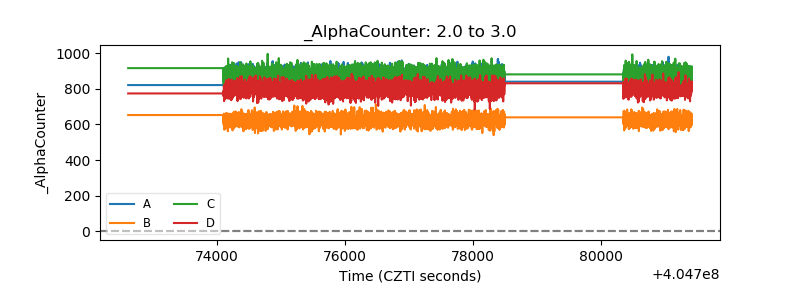 |
| _CPM_Rate | 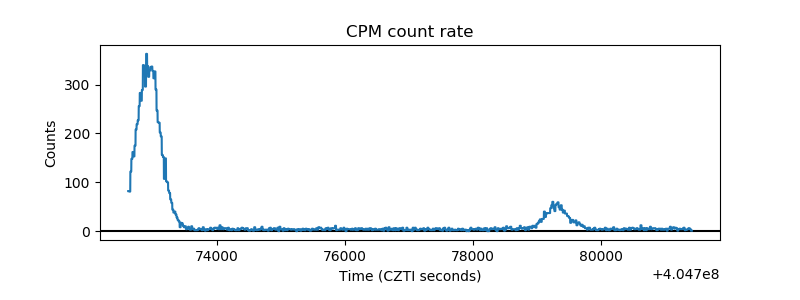 |
| CZT Counter | 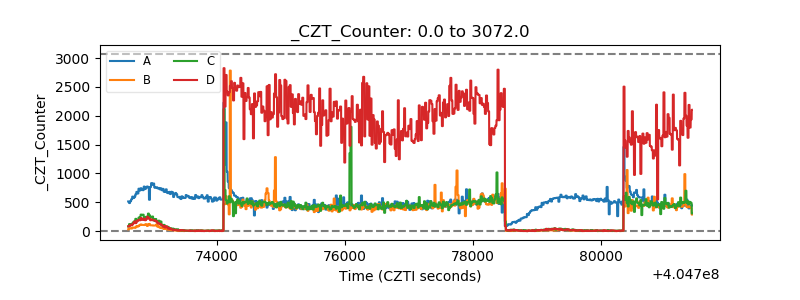 |
| +2.5 Volts monitor | 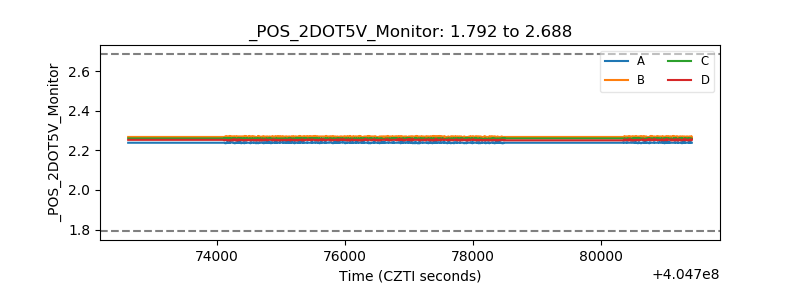 |
| +5 Volts monitor | 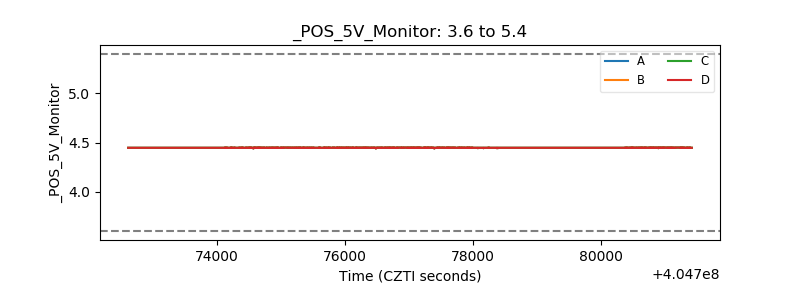 |
| _ROLL_ROT | 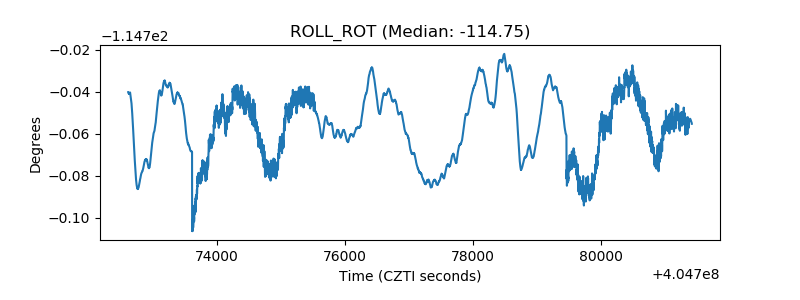 |
| _Roll_DEC | 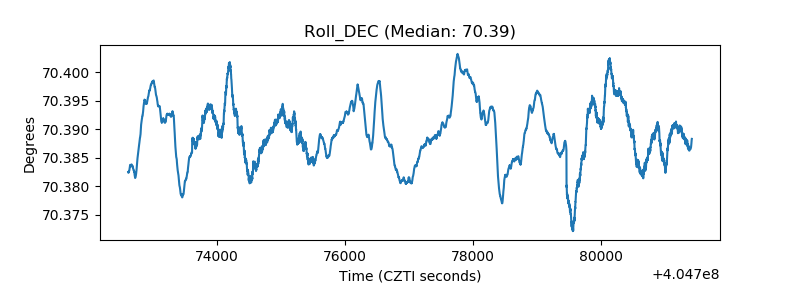 |
| _Roll_RA | 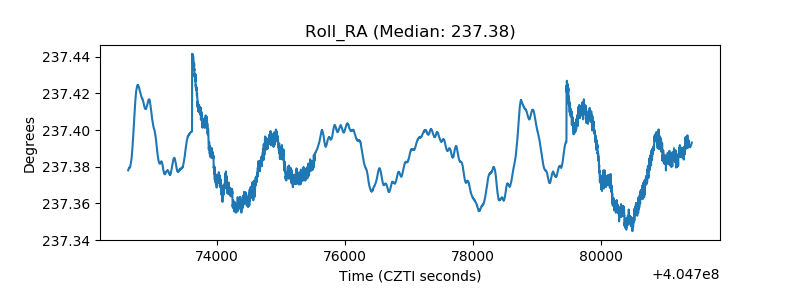 |
| Veto Counter | 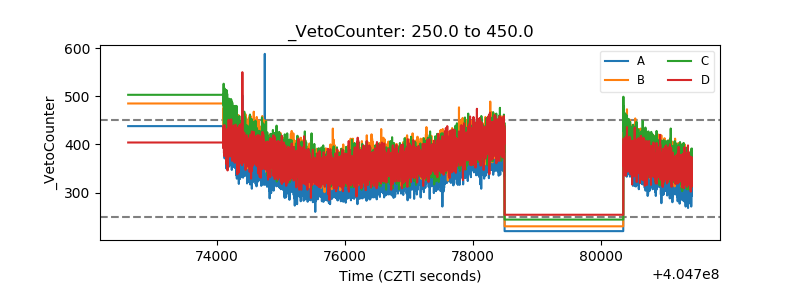 |