| Param | Original file | Final file |
|---|---|---|
| Filename | modeM0/AS1C07_001T12_9000005372_38321cztM0_level2.fits | modeM0/AS1C07_001T12_9000005372_38321cztM0_level2_quad_clean.evt |
| Size (bytes) | 511,606,080 | 91,255,680 |
| Size | 487.9 MB | 87.0 MB |
| Events in quadrant A | 2,940,600 | 644,676 |
| Events in quadrant B | 2,901,716 | 655,095 |
| Events in quadrant C | 2,747,506 | 640,998 |
| Events in quadrant D | 9,895,753 | 414,770 |
| Mode SS | |||
|---|---|---|---|
| Quadrant | BADHDUFLAG | Total packets | Discarded packets |
| A | 0 | 120 | 0 |
| B | 0 | 120 | 0 |
| C | 0 | 120 | 0 |
| D | 0 | 120 | 0 |
| Mode M9 | |||
|---|---|---|---|
| Quadrant | BADHDUFLAG | Total packets | Discarded packets |
| A | 0 | 25 | 0 |
| B | 0 | 25 | 0 |
| C | 0 | 25 | 0 |
| D | 0 | 26 | 0 |
| Mode M0 | |||
|---|---|---|---|
| Quadrant | BADHDUFLAG | Total packets | Discarded packets |
| A | 0 | 12538 | 3 |
| B | 0 | 12780 | 2 |
| C | 0 | 11904 | 2 |
| D | 0 | 33437 | 2 |
| Quadrant | Total seconds | Saturated seconds | Saturation percentage |
|---|---|---|---|
| A | 5828 | 12 | 0.205903% |
| B | 5828 | 23 | 0.394647% |
| C | 5828 | 12 | 0.205903% |
| D | 5828 | 1887 | 32.378174% |
Noise dominated data is calculated using 1-second bins in cleaned event files. If a bin has >2000 counts, and if more than 50% of those come from <1% of pixels, then it is considered to be noise-dominated and hence unusable.
| Quadrant | # 1 sec bins | Bins with >0 counts | Bins with >2000 counts | High rate bins dominated by noise | Noise dominated (total time) | Noise dominated (detector-on time) | Marked lightcurve |
|---|---|---|---|---|---|---|---|
| A | 7321 | 5829 | 7 | 7 | 0.10% | 0.12% | 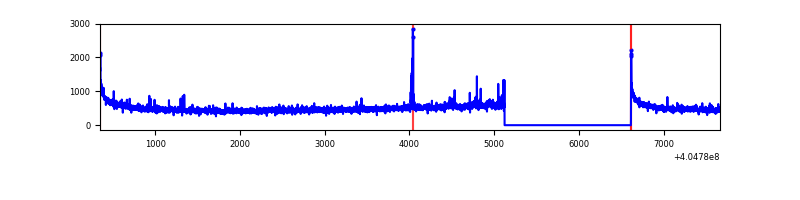 |
| B | 7321 | 5829 | 7 | 7 | 0.10% | 0.12% | 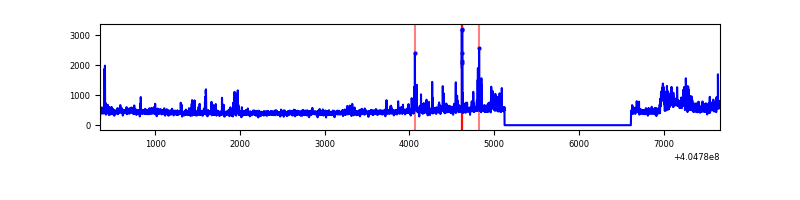 |
| C | 7321 | 5829 | 7 | 7 | 0.10% | 0.12% | 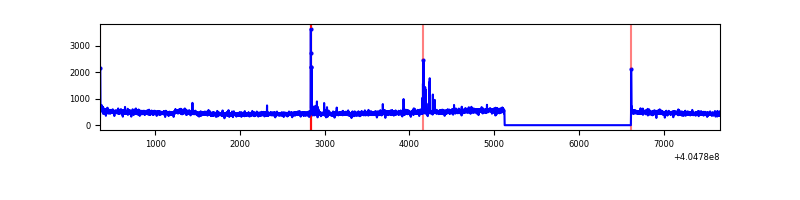 |
| D | 7321 | 5828 | 1495 | 1495 | 20.42% | 25.65% | 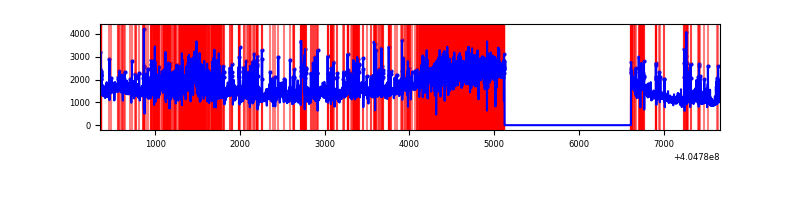 |
Top three noisy pixels from each quadrant. If the there are fewer than three noisy pixels in the level2.evt file, extra rows are filled as -1
| Pixel properties | Quadrant properties | ||||||
|---|---|---|---|---|---|---|---|
| Quadrant | DetID | PixID | Counts | Sigma | Mean | Median | Sigma |
| A | 10 | 83 | 401382 | 3127.07 | 630 | 616 | 128.2 |
| A | 12 | 189 | 31661 | 242.24 | 630 | 616 | 128.2 |
| A | 13 | 6 | 21468 | 162.7 | 630 | 616 | 128.2 |
| B | 5 | 184 | 210185 | 1735.58 | 627 | 609 | 120.8 |
| B | 0 | 183 | 125930 | 1037.83 | 627 | 609 | 120.8 |
| B | 0 | 229 | 30214 | 245.17 | 627 | 609 | 120.8 |
| C | 15 | 214 | 247689 | 1721.42 | 617 | 620 | 143.5 |
| C | 1 | 23 | 50104 | 344.77 | 617 | 620 | 143.5 |
| C | 14 | 67 | 21918 | 148.39 | 617 | 620 | 143.5 |
| D | 10 | 203 | 4137834 | 32058.58 | 529 | 514 | 129.1 |
| D | 2 | 16 | 2480550 | 19216.89 | 529 | 514 | 129.1 |
| D | 12 | 235 | 708374 | 5484.95 | 529 | 514 | 129.1 |
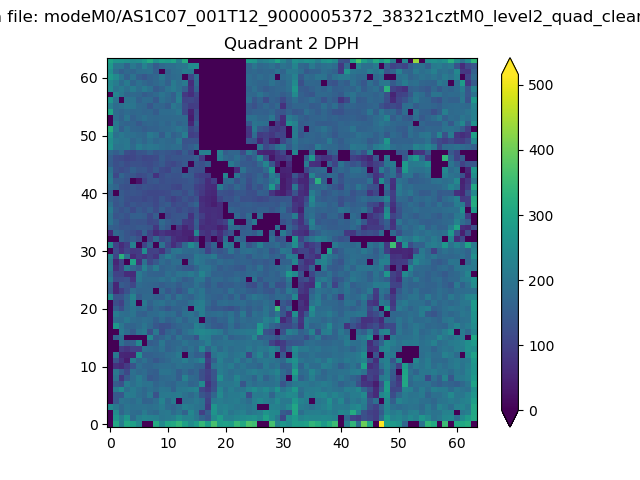
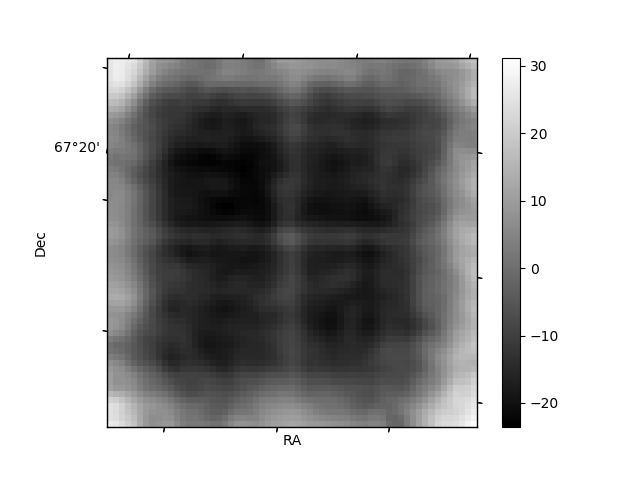
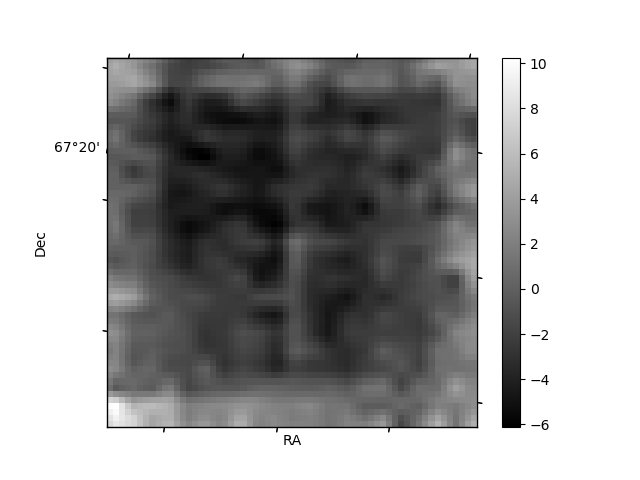
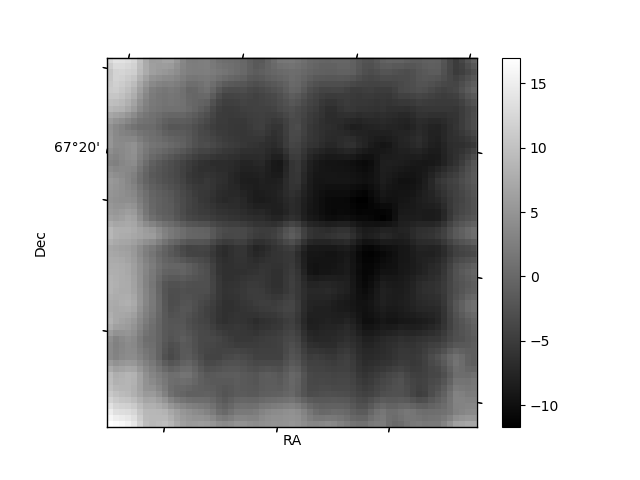
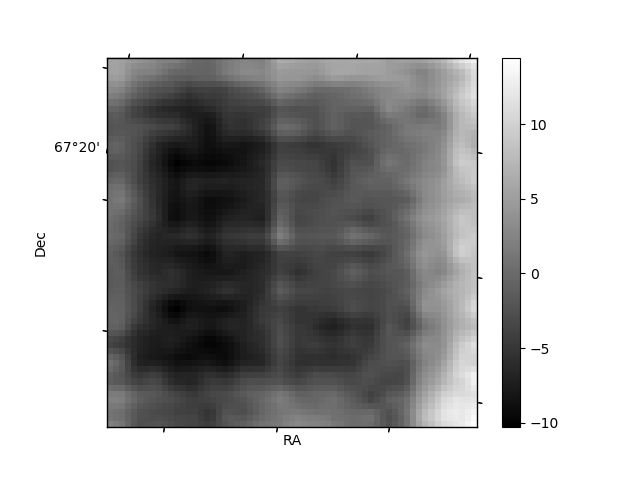
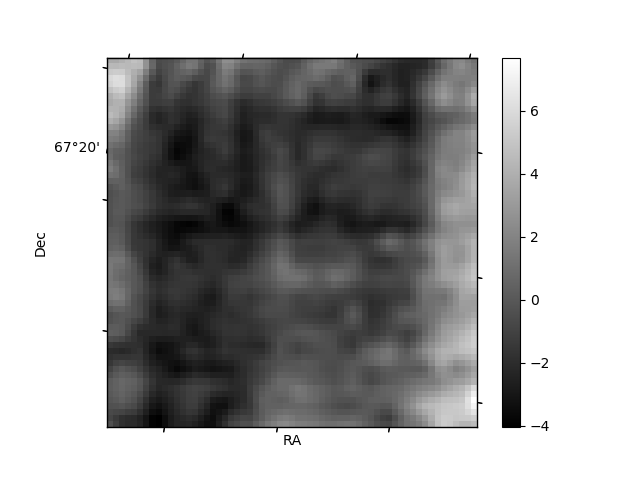
Histogram calculated using DETX and DETY for each event in the final _common_clean file
| Quadrant A | 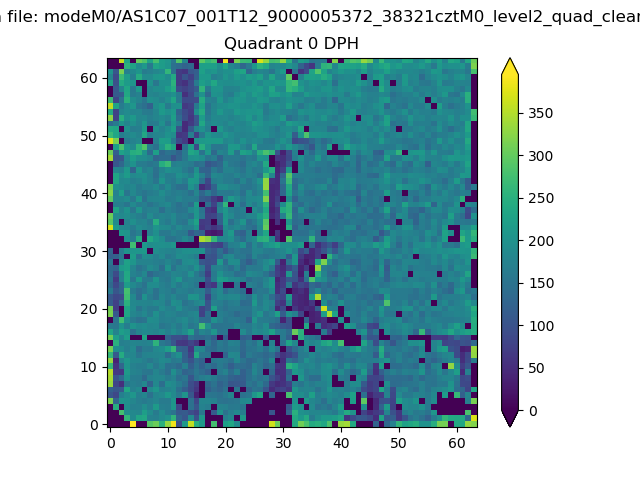 |
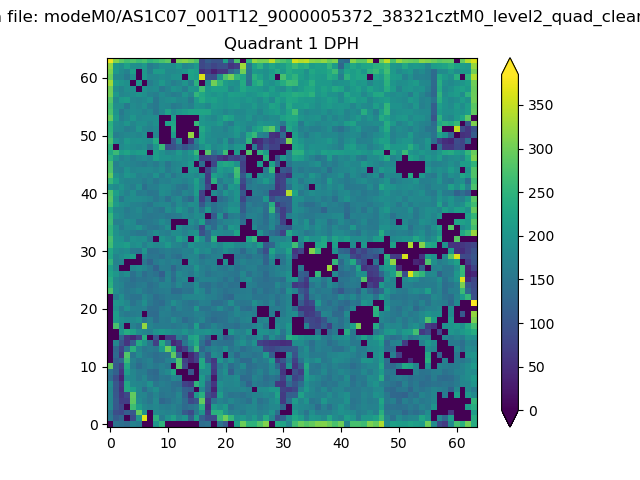 |
Quadrant B |
|---|---|---|---|
| Quadrant D | 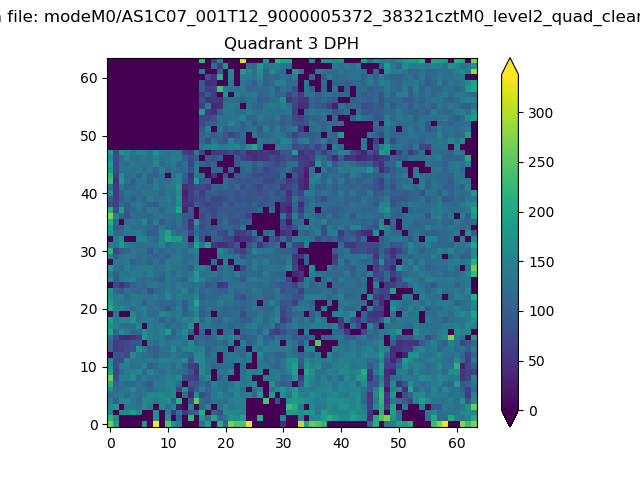 |
 |
Quadrant C |
| Plot type | Count rate plots | Images |
|---|---|---|
| Comparison with Poisson distribution Blue bars denote a histogram of data divided into 1 sec bins. Red curve is a Poisson curve with rate = median count rate of data. |
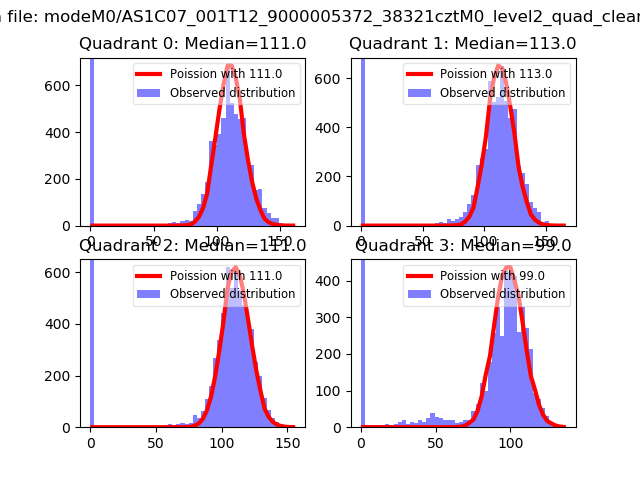 |
 |
| Quadrant-wise count rates Data is divided into 100 sec bins |
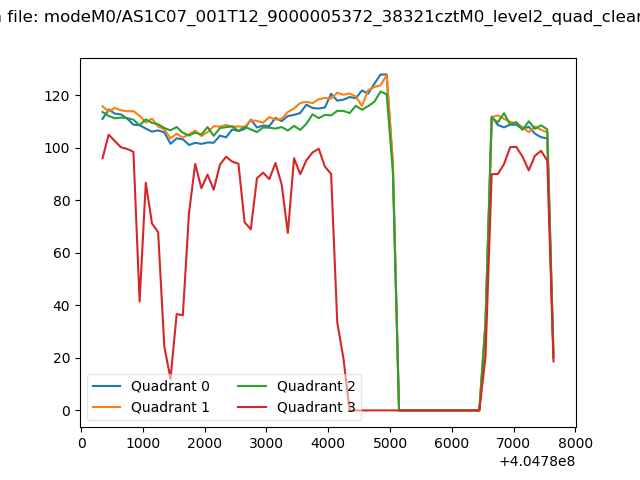 |
|
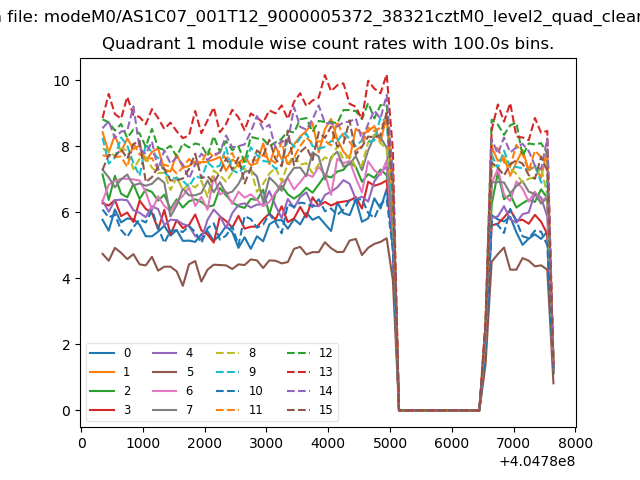
| Module-wise count rates for Quadrant A Data is divided into 100 sec bins |
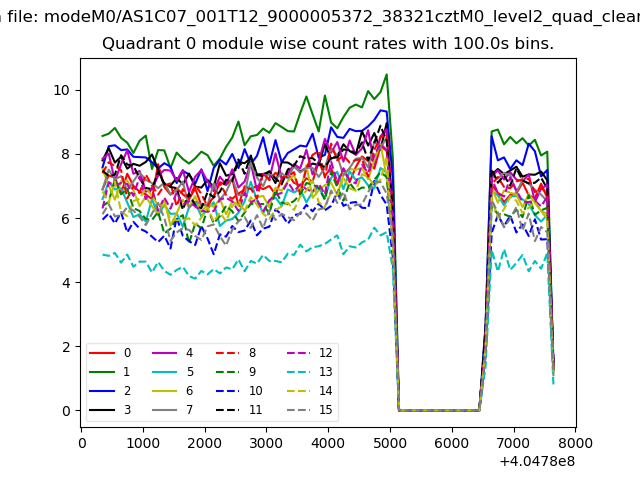 |
 |
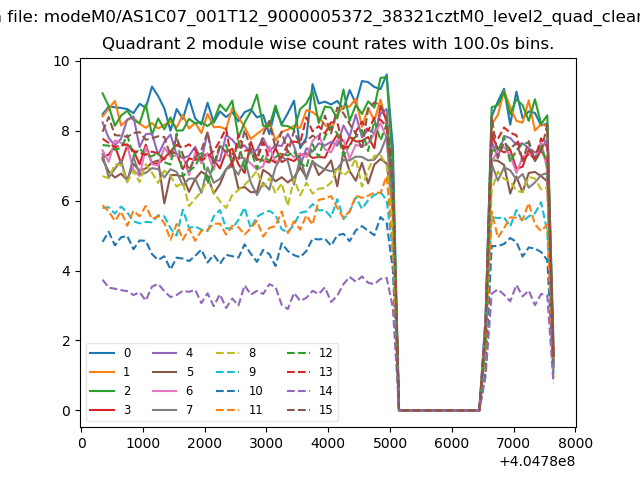
| Module-wise count rates for Quadrant B Data is divided into 100 sec bins |
 |
 |
| Module-wise count rates for Quadrant C Data is divided into 100 sec bins |
 |
 |
| Module-wise count rates for Quadrant D Data is divided into 100 sec bins |
 |
 |
| Parameter | Plot |
|---|---|
| CZT HV Monitor | 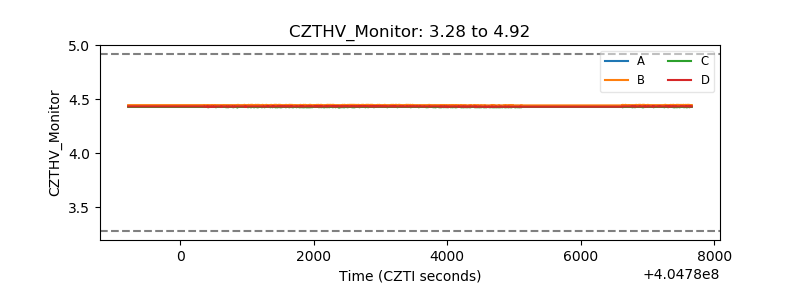 |
| D_VDD | 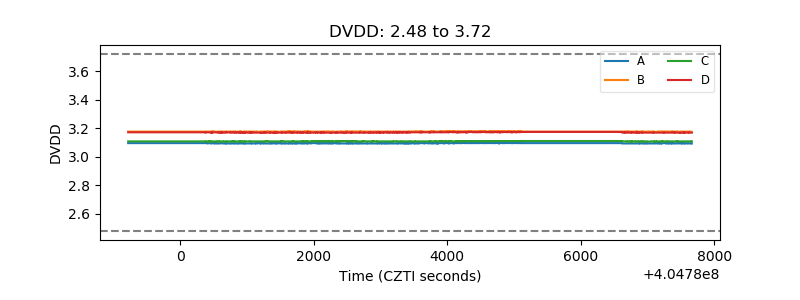 |
| Temperature 1 | 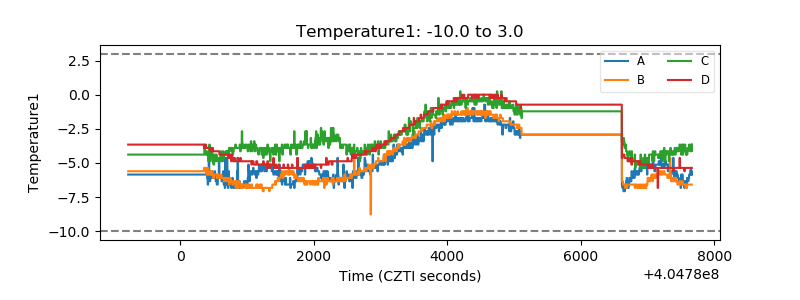 |
| Veto HV Monitor | 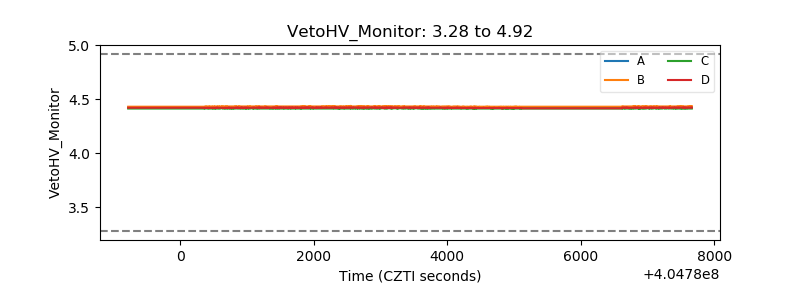 |
| Veto LLD | 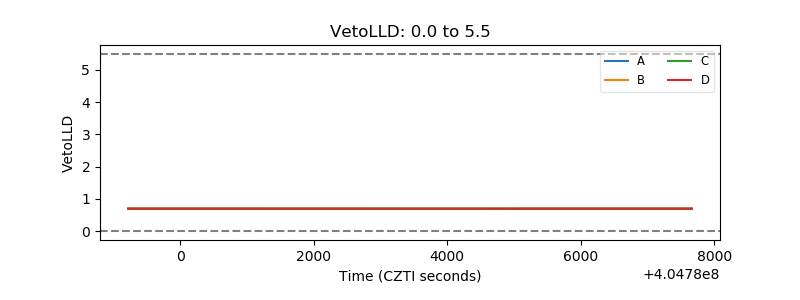 |
| Alpha Counter | 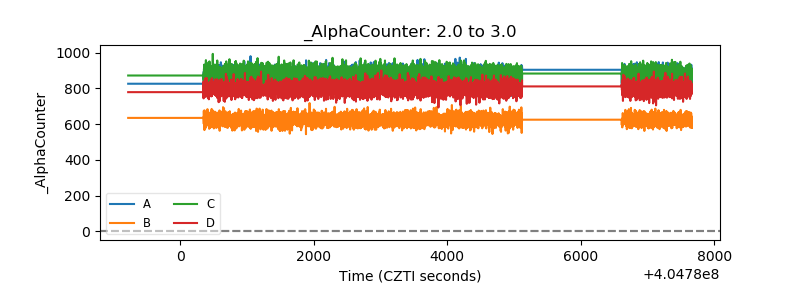 |
| _CPM_Rate | 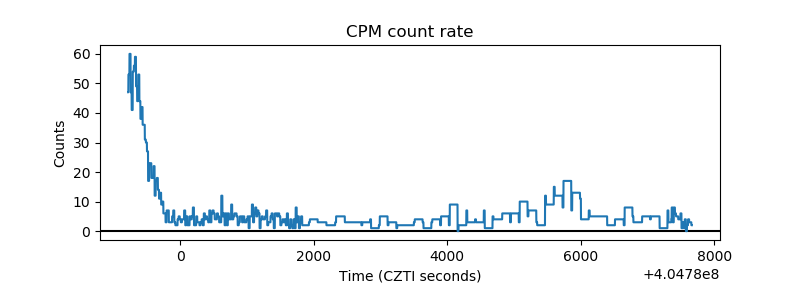 |
| CZT Counter | 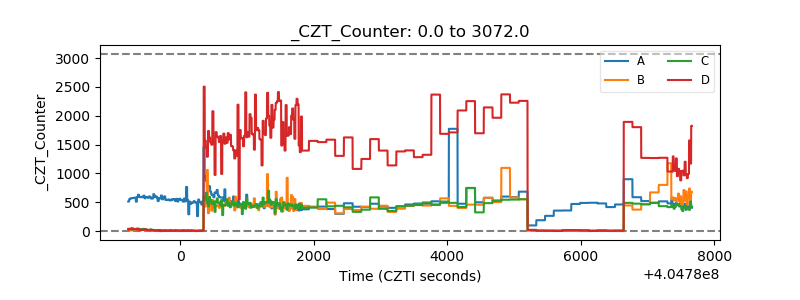 |
| +2.5 Volts monitor | 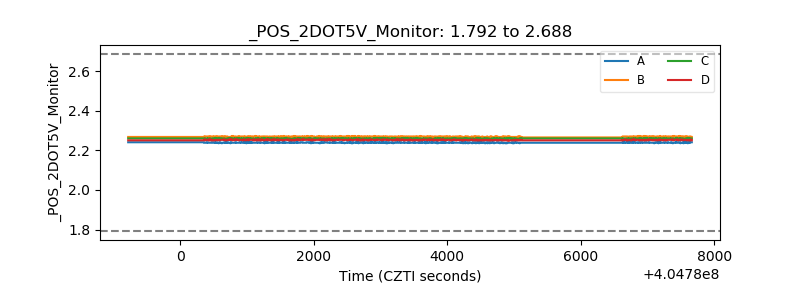 |
| +5 Volts monitor | 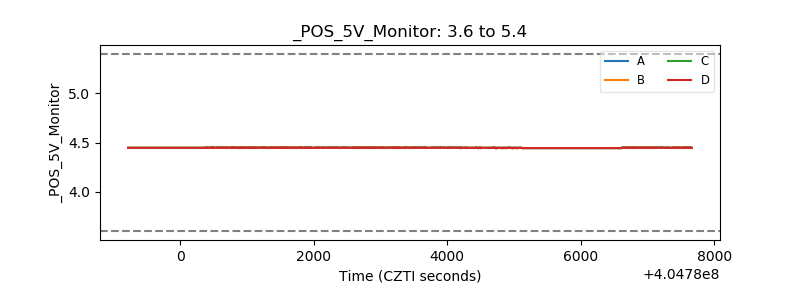 |
| _ROLL_ROT | 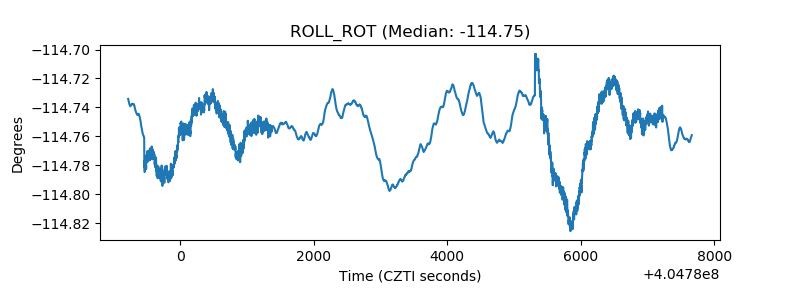 |
| _Roll_DEC | 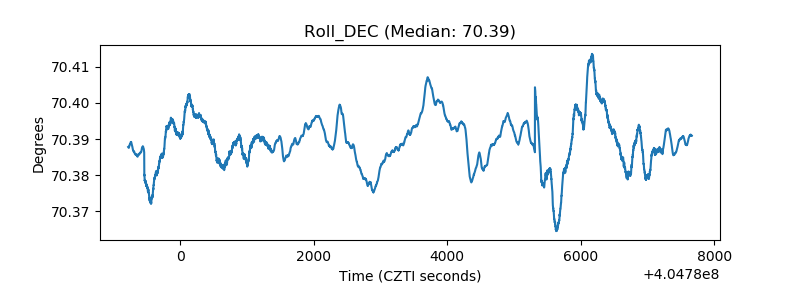 |
| _Roll_RA | 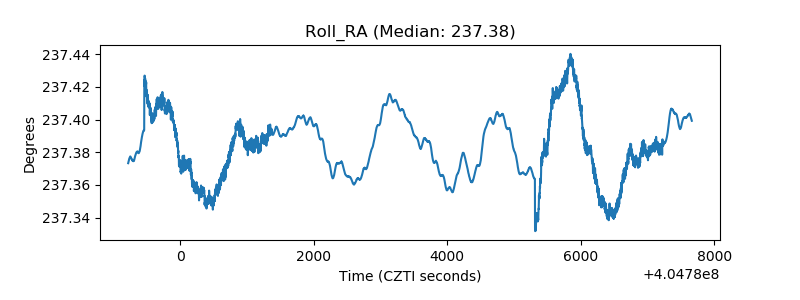 |
| Veto Counter | 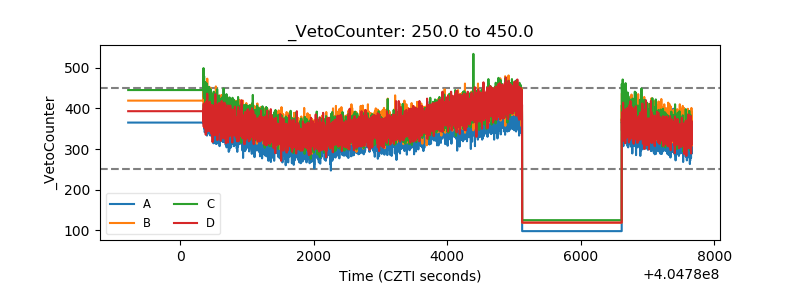 |