| Param | Original file | Final file |
|---|---|---|
| Filename | modeM0/AS1C07_001T12_9000005372_38322cztM0_level2.fits | modeM0/AS1C07_001T12_9000005372_38322cztM0_level2_quad_clean.evt |
| Size (bytes) | 504,604,800 | 89,556,480 |
| Size | 481.2 MB | 85.4 MB |
| Events in quadrant A | 2,868,322 | 637,028 |
| Events in quadrant B | 2,936,618 | 646,453 |
| Events in quadrant C | 2,679,065 | 630,240 |
| Events in quadrant D | 9,746,560 | 394,213 |
| Mode SS | |||
|---|---|---|---|
| Quadrant | BADHDUFLAG | Total packets | Discarded packets |
| A | 0 | 118 | 0 |
| B | 0 | 118 | 0 |
| C | 0 | 118 | 0 |
| D | 0 | 118 | 0 |
| Mode M9 | |||
|---|---|---|---|
| Quadrant | BADHDUFLAG | Total packets | Discarded packets |
| A | 0 | 13 | 0 |
| B | 0 | 13 | 0 |
| C | 0 | 13 | 0 |
| D | 0 | 13 | 0 |
| Mode M0 | |||
|---|---|---|---|
| Quadrant | BADHDUFLAG | Total packets | Discarded packets |
| A | 0 | 12089 | 2 |
| B | 0 | 12712 | 1 |
| C | 0 | 11699 | 1 |
| D | 0 | 32961 | 1 |
| Quadrant | Total seconds | Saturated seconds | Saturation percentage |
|---|---|---|---|
| A | 5770 | 7 | 0.121317% |
| B | 5770 | 23 | 0.398614% |
| C | 5770 | 3 | 0.051993% |
| D | 5770 | 1964 | 34.038128% |
Noise dominated data is calculated using 1-second bins in cleaned event files. If a bin has >2000 counts, and if more than 50% of those come from <1% of pixels, then it is considered to be noise-dominated and hence unusable.
| Quadrant | # 1 sec bins | Bins with >0 counts | Bins with >2000 counts | High rate bins dominated by noise | Noise dominated (total time) | Noise dominated (detector-on time) | Marked lightcurve |
|---|---|---|---|---|---|---|---|
| A | 7084 | 5771 | 2 | 2 | 0.03% | 0.03% | 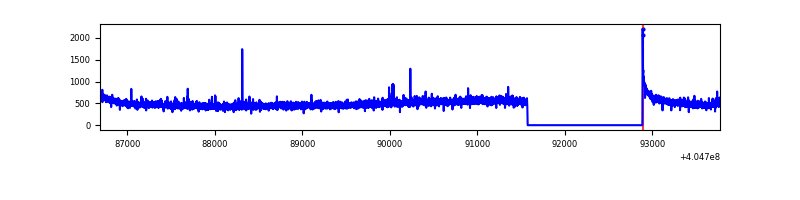 |
| B | 7084 | 5771 | 10 | 10 | 0.14% | 0.17% | 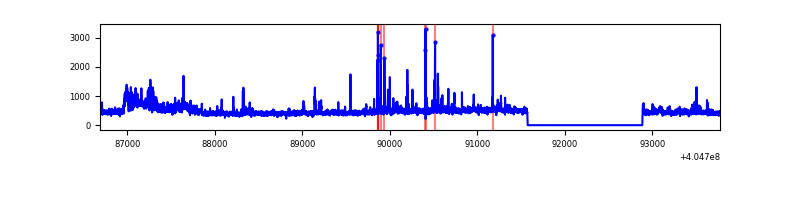 |
| C | 7084 | 5771 | 2 | 2 | 0.03% | 0.03% | 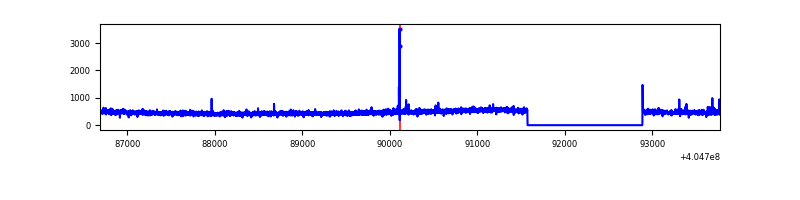 |
| D | 7084 | 5771 | 1834 | 1834 | 25.89% | 31.78% | 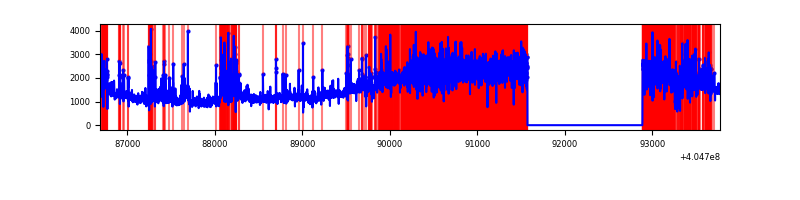 |
Top three noisy pixels from each quadrant. If the there are fewer than three noisy pixels in the level2.evt file, extra rows are filled as -1
| Pixel properties | Quadrant properties | ||||||
|---|---|---|---|---|---|---|---|
| Quadrant | DetID | PixID | Counts | Sigma | Mean | Median | Sigma |
| A | 10 | 83 | 379343 | 2995.61 | 627 | 613 | 126.4 |
| A | 12 | 189 | 23734 | 182.88 | 627 | 613 | 126.4 |
| A | 13 | 6 | 20674 | 158.67 | 627 | 613 | 126.4 |
| B | 5 | 184 | 241917 | 2003.96 | 625 | 607 | 120.4 |
| B | 0 | 229 | 78816 | 649.49 | 625 | 607 | 120.4 |
| B | 0 | 183 | 69804 | 574.65 | 625 | 607 | 120.4 |
| C | 15 | 214 | 244632 | 1709.63 | 615 | 620 | 142.7 |
| C | 12 | 249 | 16723 | 112.82 | 615 | 620 | 142.7 |
| C | 12 | 254 | 6835 | 43.54 | 615 | 620 | 142.7 |
| D | 10 | 203 | 4927836 | 37672.98 | 529 | 513 | 130.8 |
| D | 2 | 16 | 1744482 | 13333.91 | 529 | 513 | 130.8 |
| D | 13 | 138 | 232341 | 1772.49 | 529 | 513 | 130.8 |
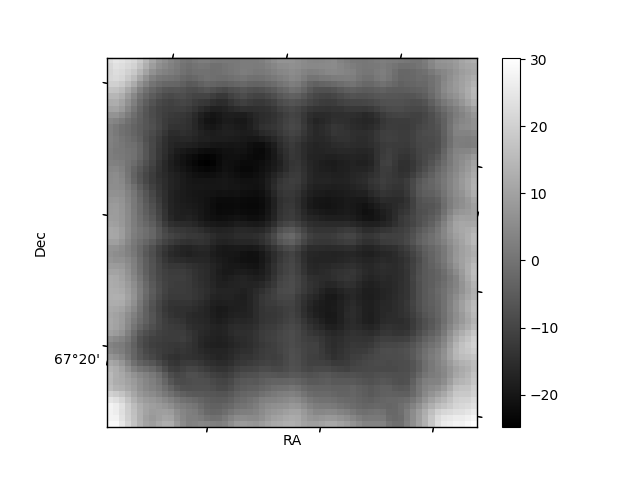
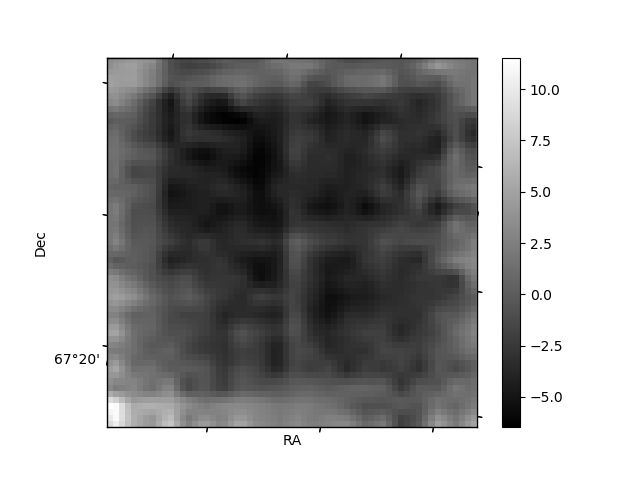
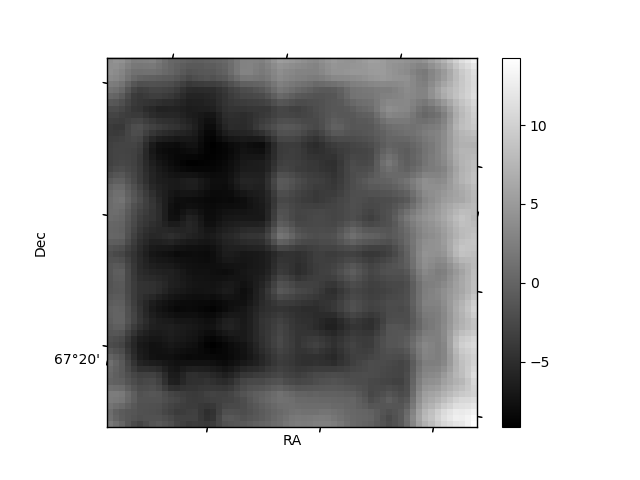
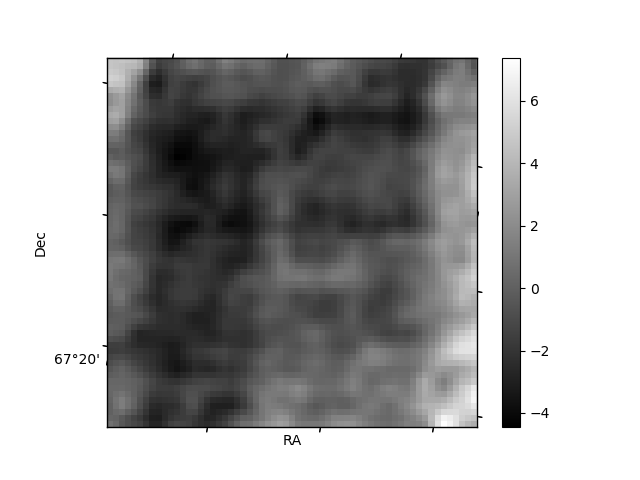
Histogram calculated using DETX and DETY for each event in the final _common_clean file
| Quadrant A | 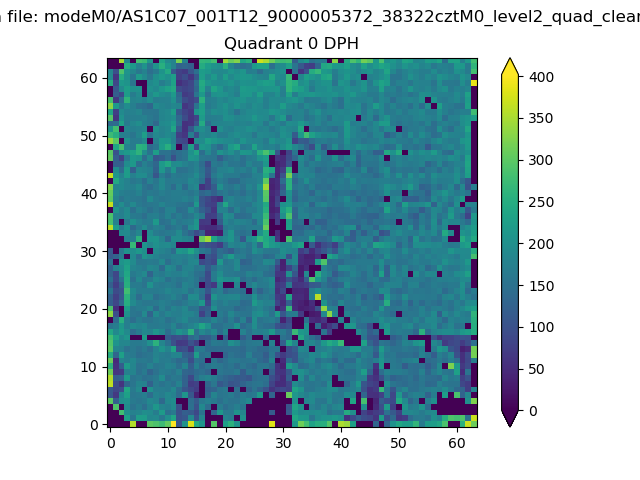 |
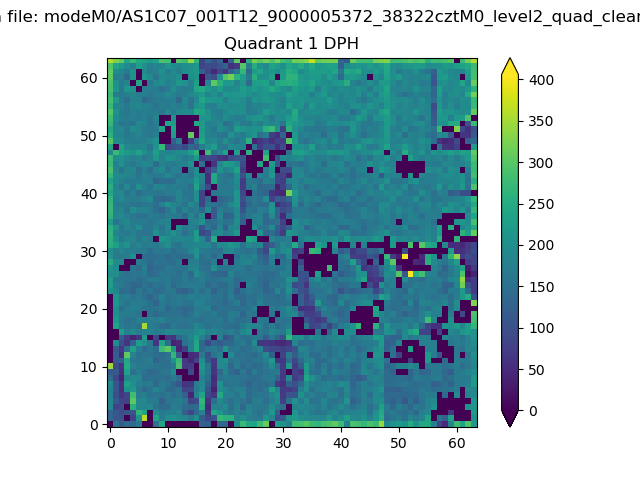 |
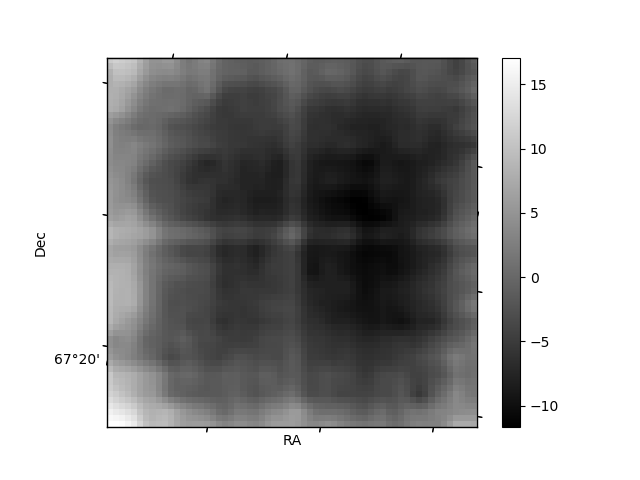
Quadrant B |
|---|---|---|---|
| Quadrant D | 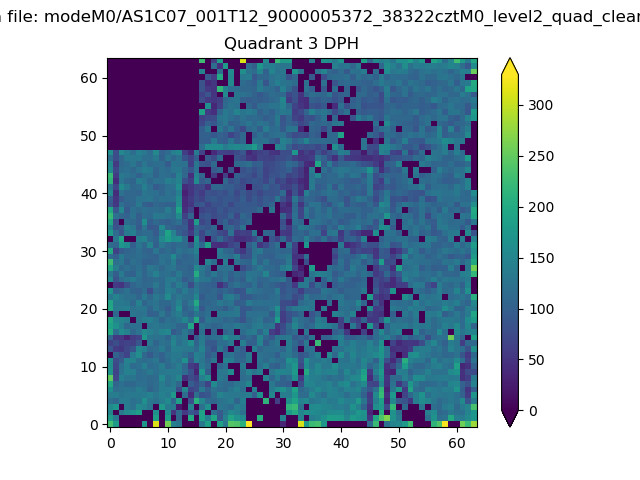 |
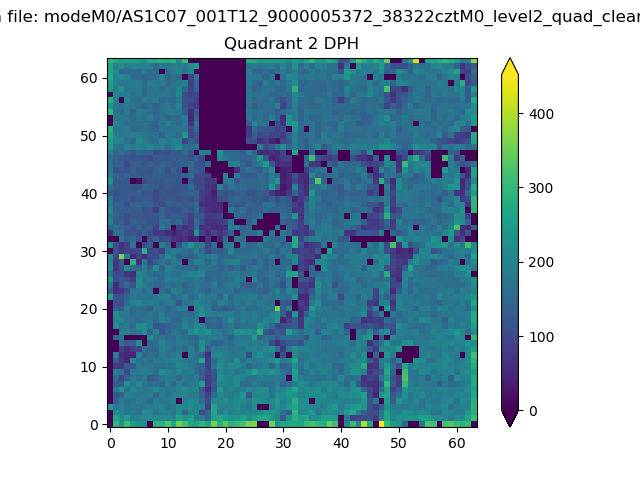 |
Quadrant C |
| Plot type | Count rate plots | Images |
|---|---|---|
| Comparison with Poisson distribution Blue bars denote a histogram of data divided into 1 sec bins. Red curve is a Poisson curve with rate = median count rate of data. |
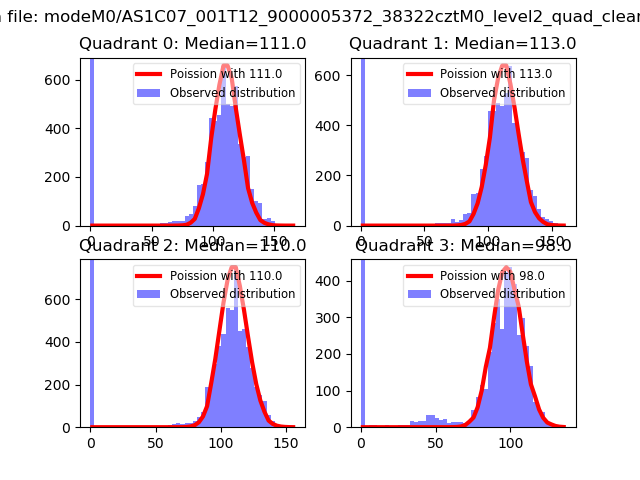 |
 |
| Quadrant-wise count rates Data is divided into 100 sec bins |
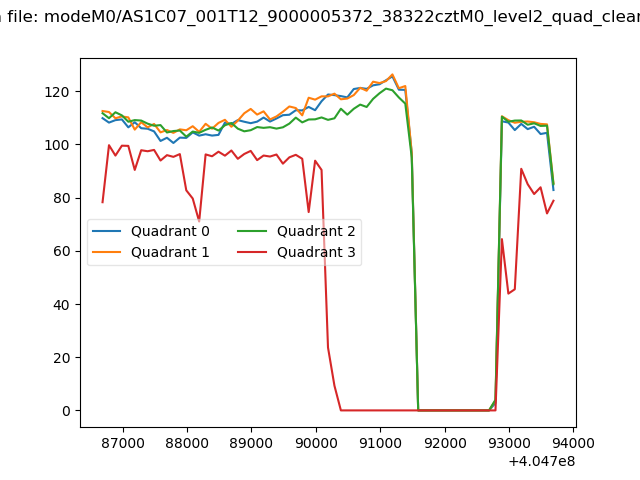 |
|
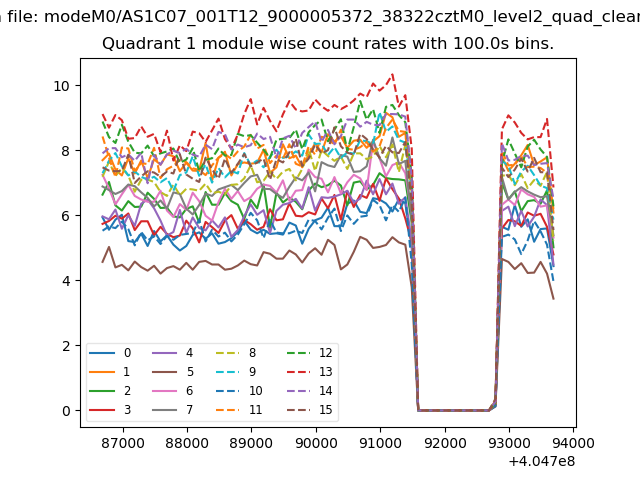
| Module-wise count rates for Quadrant A Data is divided into 100 sec bins |
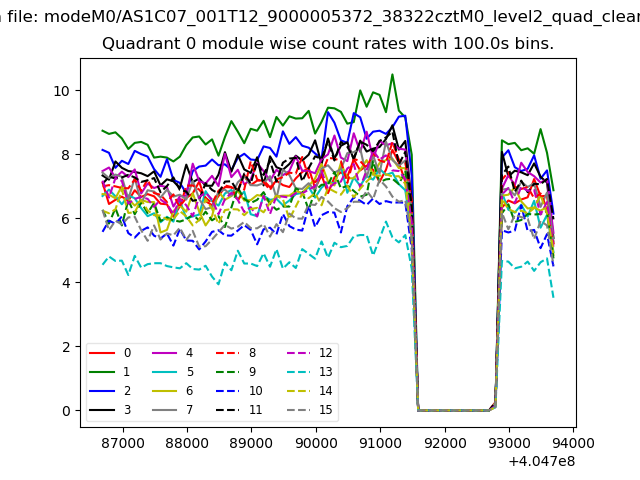 |
 |
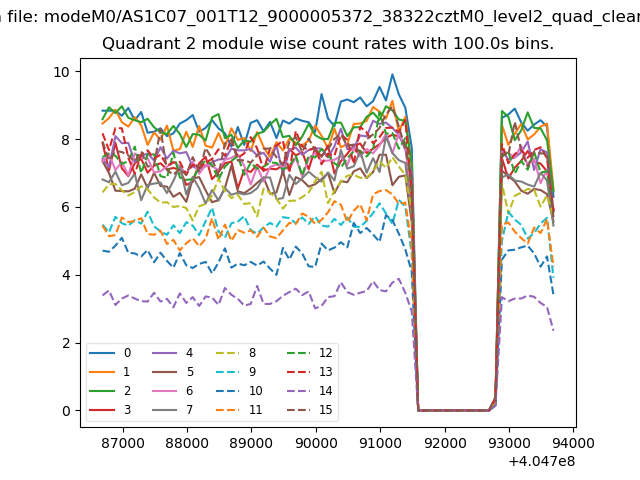
| Module-wise count rates for Quadrant B Data is divided into 100 sec bins |
 |
 |
| Module-wise count rates for Quadrant C Data is divided into 100 sec bins |
 |
 |
| Module-wise count rates for Quadrant D Data is divided into 100 sec bins |
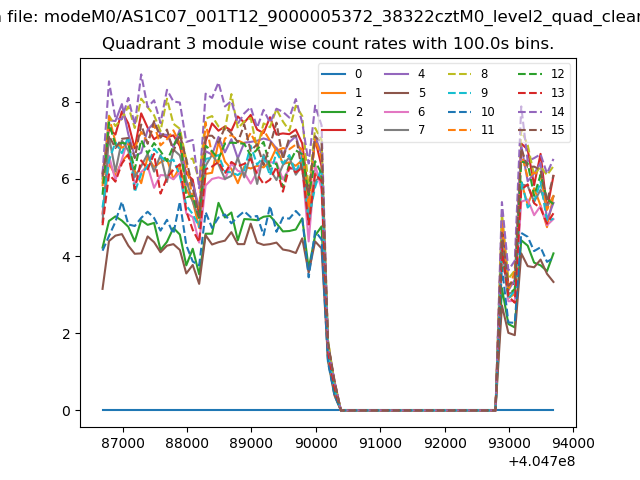 |
 |
| Parameter | Plot |
|---|---|
| CZT HV Monitor | 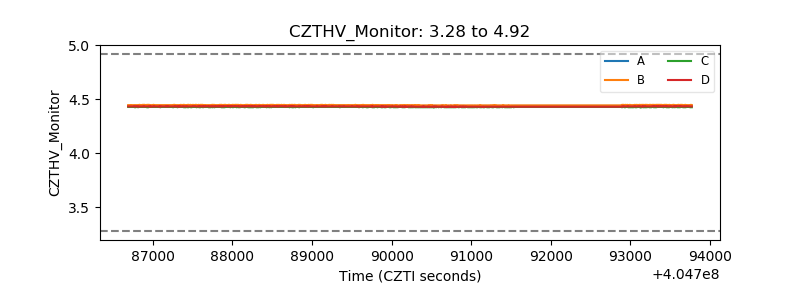 |
| D_VDD | 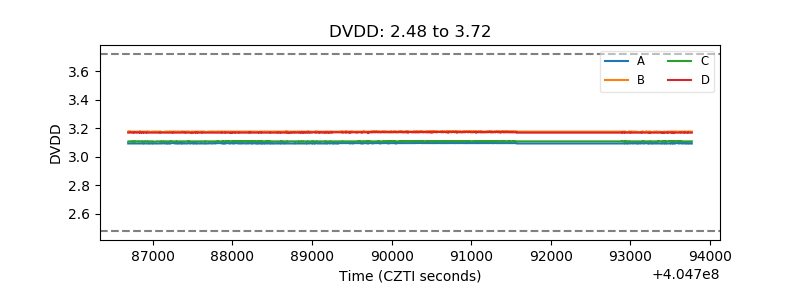 |
| Temperature 1 | 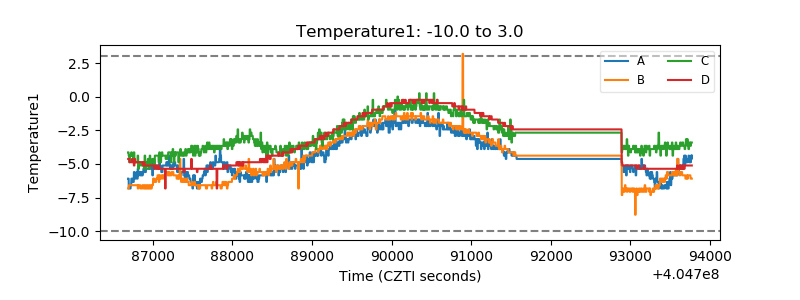 |
| Veto HV Monitor | 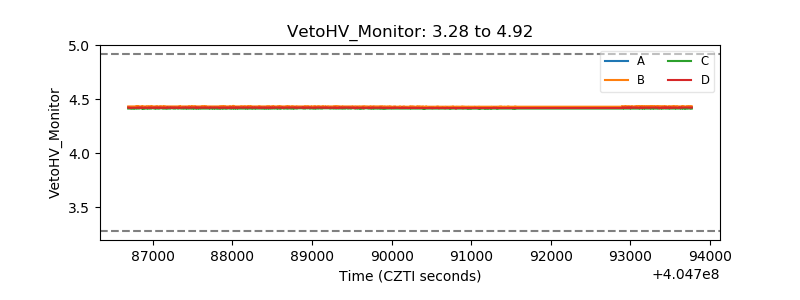 |
| Veto LLD | 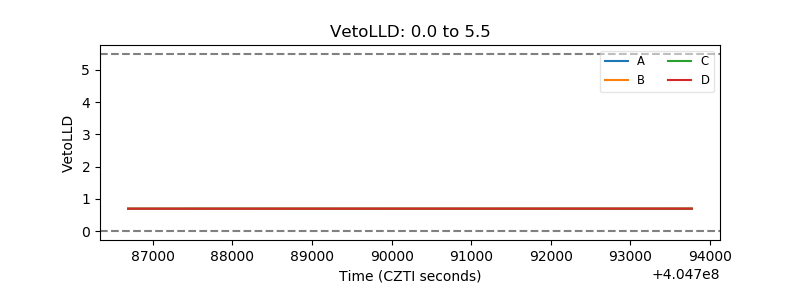 |
| Alpha Counter | 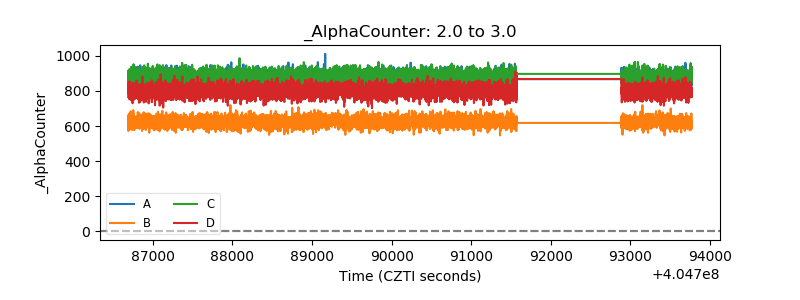 |
| _CPM_Rate | 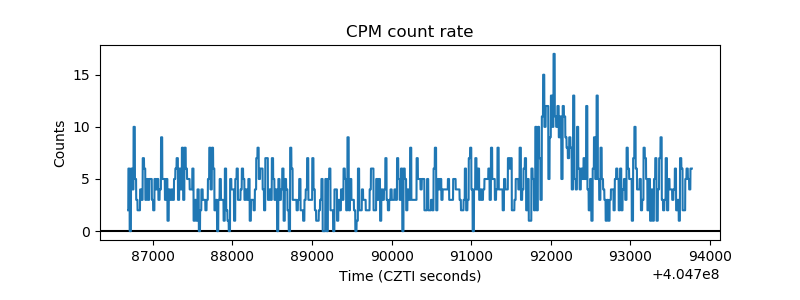 |
| CZT Counter | 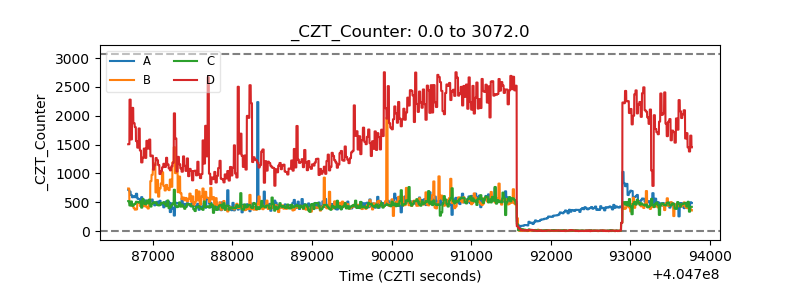 |
| +2.5 Volts monitor | 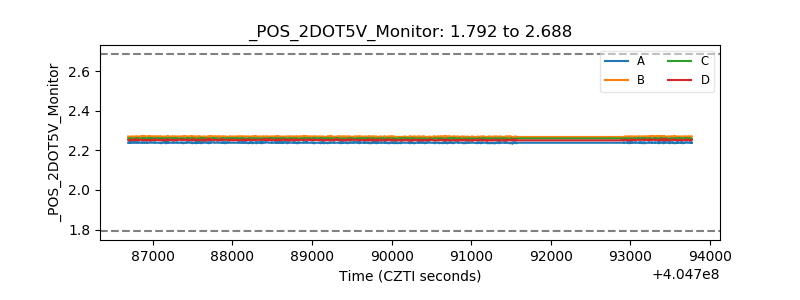 |
| +5 Volts monitor | 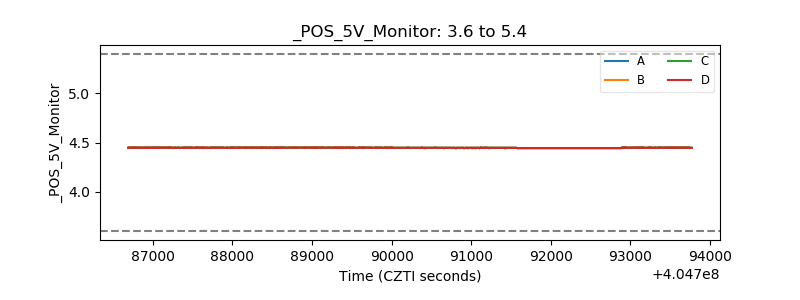 |
| _ROLL_ROT | 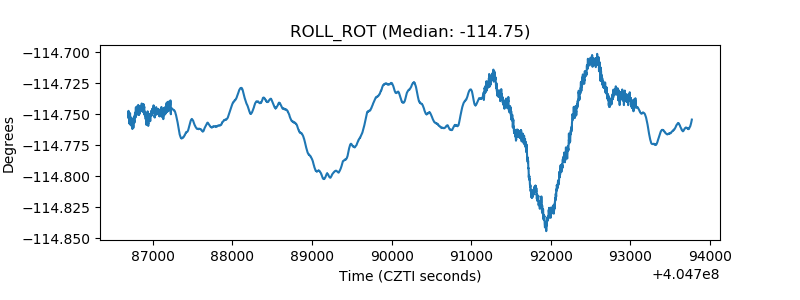 |
| _Roll_DEC | 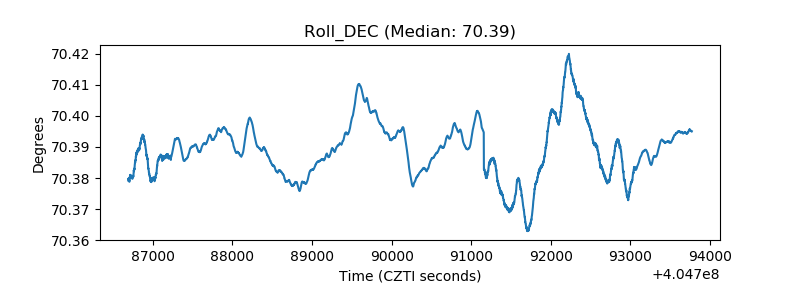 |
| _Roll_RA | 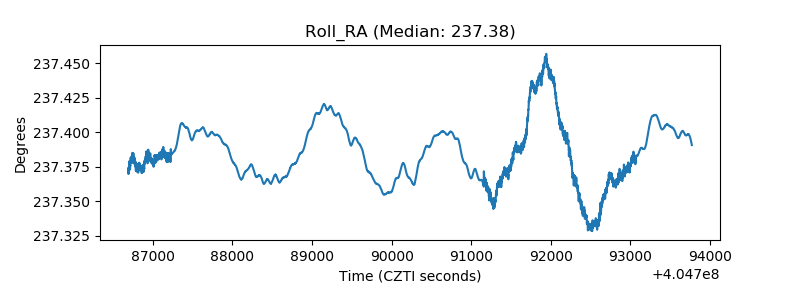 |
| Veto Counter | 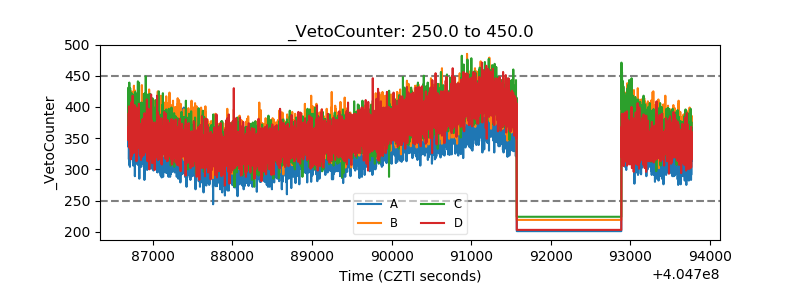 |