| Param | Original file | Final file |
|---|---|---|
| Filename | modeM0/AS1C07_001T12_9000005372_38327cztM0_level2.fits | modeM0/AS1C07_001T12_9000005372_38327cztM0_level2_quad_clean.evt |
| Size (bytes) | 204,036,480 | 35,406,720 |
| Size | 194.6 MB | 33.8 MB |
| Events in quadrant A | 1,126,241 | 247,258 |
| Events in quadrant B | 986,978 | 254,329 |
| Events in quadrant C | 1,037,178 | 249,530 |
| Events in quadrant D | 4,217,830 | 151,987 |
| Mode SS | |||
|---|---|---|---|
| Quadrant | BADHDUFLAG | Total packets | Discarded packets |
| A | 0 | 50 | 0 |
| B | 0 | 50 | 0 |
| C | 0 | 50 | 0 |
| D | 0 | 50 | 0 |
| Mode M9 | |||
|---|---|---|---|
| Quadrant | BADHDUFLAG | Total packets | Discarded packets |
| A | 0 | 13 | 0 |
| B | 0 | 13 | 0 |
| C | 0 | 13 | 0 |
| D | 0 | 13 | 0 |
| Mode M0 | |||
|---|---|---|---|
| Quadrant | BADHDUFLAG | Total packets | Discarded packets |
| A | 0 | 4913 | 1 |
| B | 0 | 4718 | 1 |
| C | 0 | 4717 | 1 |
| D | 0 | 14156 | 1 |
| Quadrant | Total seconds | Saturated seconds | Saturation percentage |
|---|---|---|---|
| A | 2343 | 4 | 0.170721% |
| B | 2343 | 3 | 0.128041% |
| C | 2343 | 1 | 0.042680% |
| D | 2343 | 925 | 39.479300% |
Noise dominated data is calculated using 1-second bins in cleaned event files. If a bin has >2000 counts, and if more than 50% of those come from <1% of pixels, then it is considered to be noise-dominated and hence unusable.
| Quadrant | # 1 sec bins | Bins with >0 counts | Bins with >2000 counts | High rate bins dominated by noise | Noise dominated (total time) | Noise dominated (detector-on time) | Marked lightcurve |
|---|---|---|---|---|---|---|---|
| A | 3657 | 2344 | 2 | 2 | 0.05% | 0.09% | 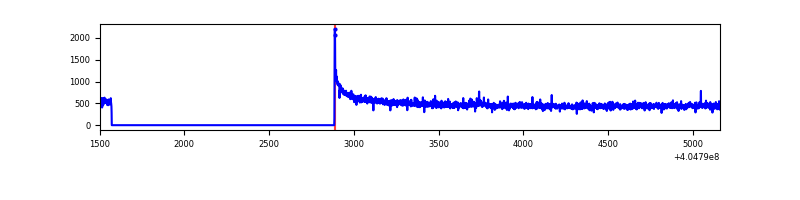 |
| B | 3657 | 2344 | 0 | 0 | 0.00% | 0.00% | 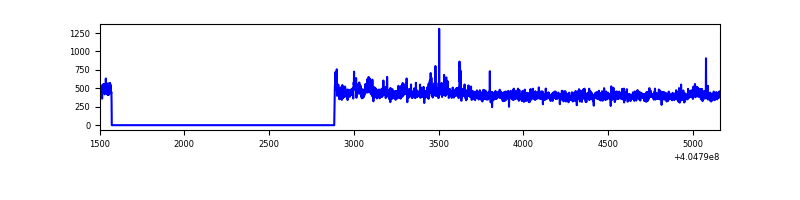 |
| C | 3657 | 2344 | 0 | 0 | 0.00% | 0.00% | 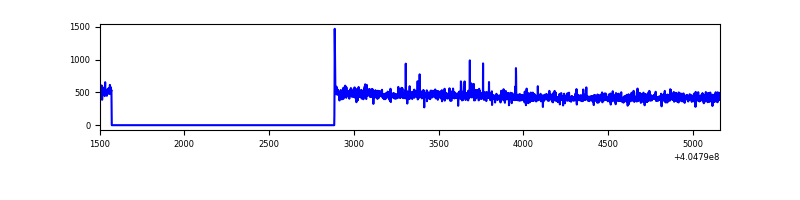 |
| D | 3657 | 2344 | 638 | 638 | 17.45% | 27.22% | 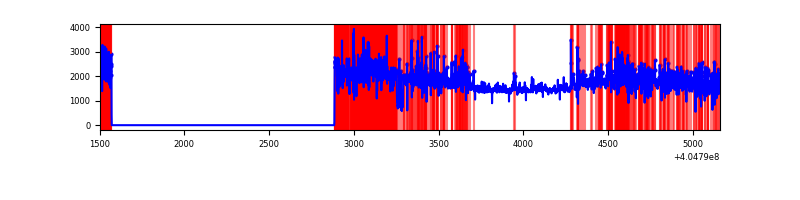 |
Top three noisy pixels from each quadrant. If the there are fewer than three noisy pixels in the level2.evt file, extra rows are filled as -1
| Pixel properties | Quadrant properties | ||||||
|---|---|---|---|---|---|---|---|
| Quadrant | DetID | PixID | Counts | Sigma | Mean | Median | Sigma |
| A | 10 | 83 | 172969 | 3402.55 | 242 | 238 | 50.8 |
| A | 12 | 189 | 9072 | 174.02 | 242 | 238 | 50.8 |
| A | 13 | 6 | 6781 | 128.89 | 242 | 238 | 50.8 |
| B | 0 | 229 | 11270 | 225.83 | 242 | 236 | 48.9 |
| B | 12 | 18 | 6956 | 137.54 | 242 | 236 | 48.9 |
| B | 0 | 156 | 6848 | 135.33 | 242 | 236 | 48.9 |
| C | 15 | 214 | 101027 | 1779.58 | 236 | 237 | 56.6 |
| C | 12 | 249 | 10630 | 183.5 | 236 | 237 | 56.6 |
| C | 0 | 10 | 3299 | 54.06 | 236 | 237 | 56.6 |
| D | 10 | 203 | 2119641 | 42188.2 | 199 | 193 | 50.2 |
| D | 2 | 16 | 1163422 | 23154.4 | 199 | 193 | 50.2 |
| D | 1 | 47 | 60963 | 1209.64 | 199 | 193 | 50.2 |
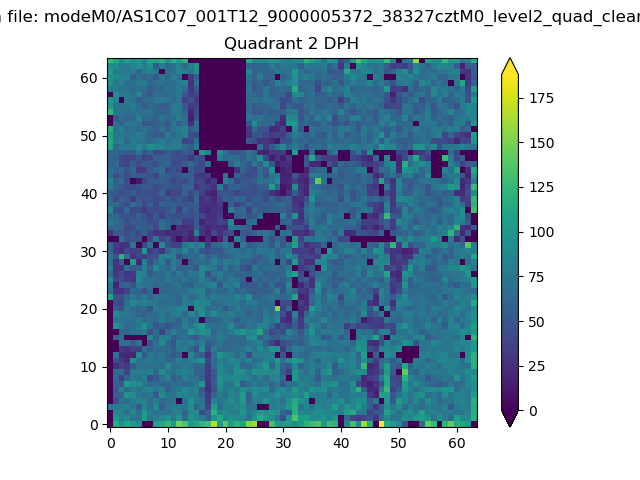
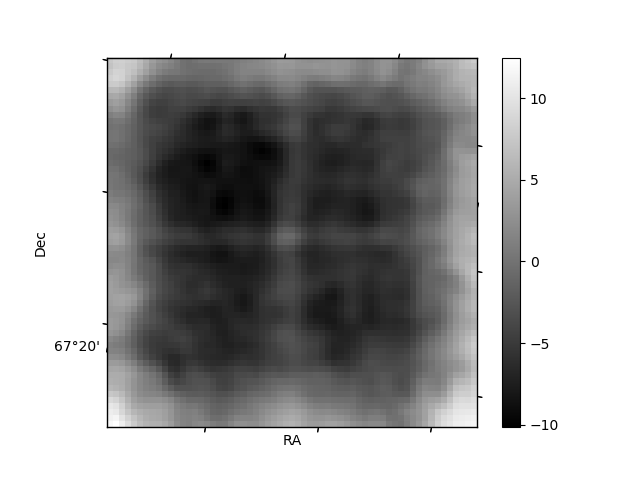
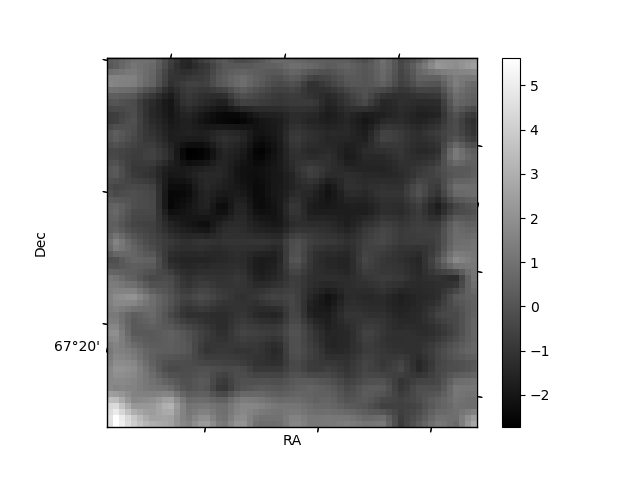
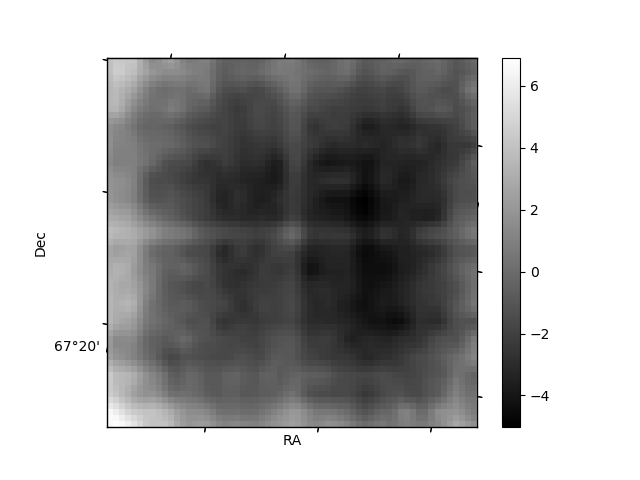
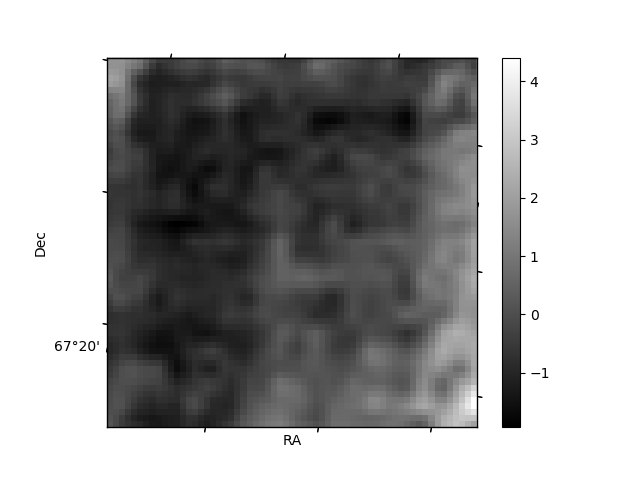
Histogram calculated using DETX and DETY for each event in the final _common_clean file
| Quadrant A | 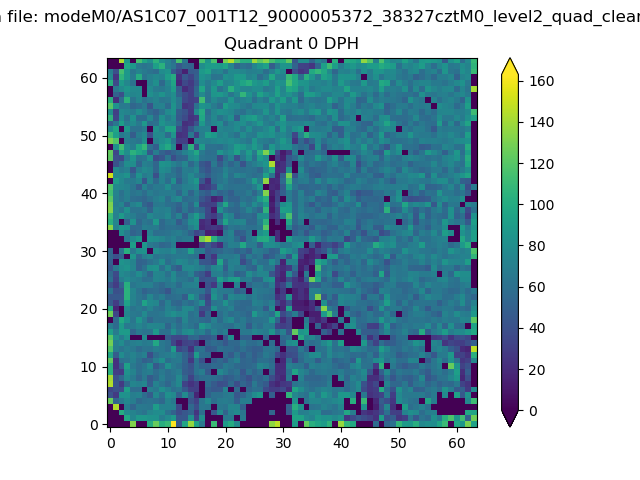 |
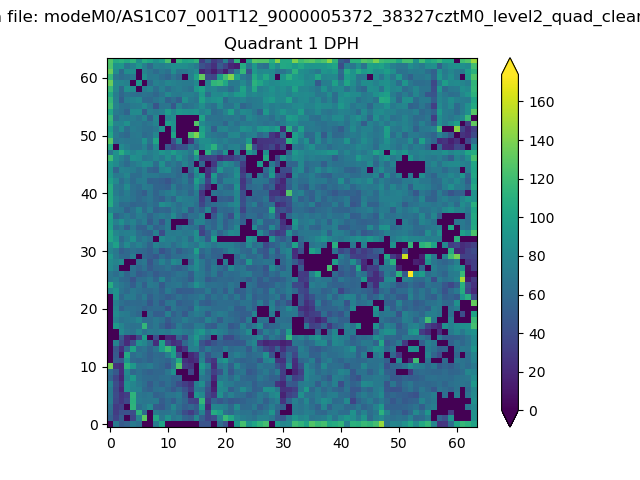 |
Quadrant B |
|---|---|---|---|
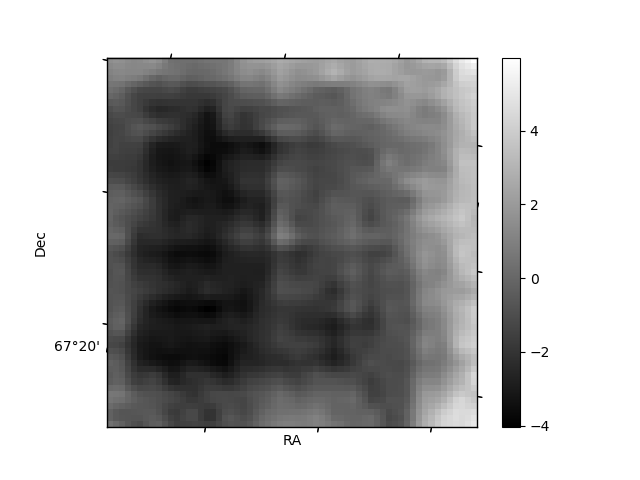
| Quadrant D | 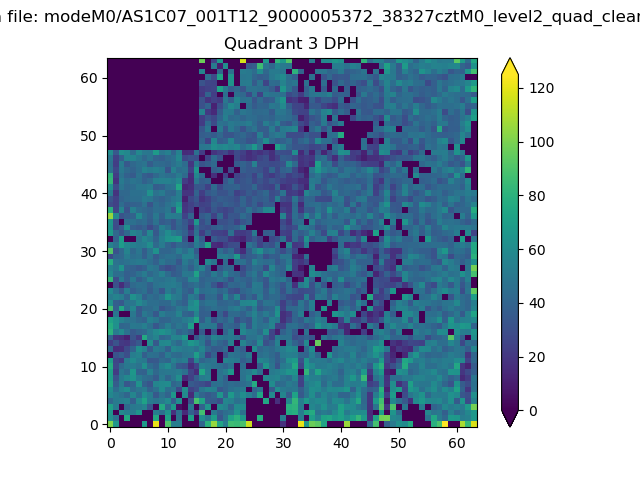 |
 |
Quadrant C |
| Plot type | Count rate plots | Images |
|---|---|---|
| Comparison with Poisson distribution Blue bars denote a histogram of data divided into 1 sec bins. Red curve is a Poisson curve with rate = median count rate of data. |
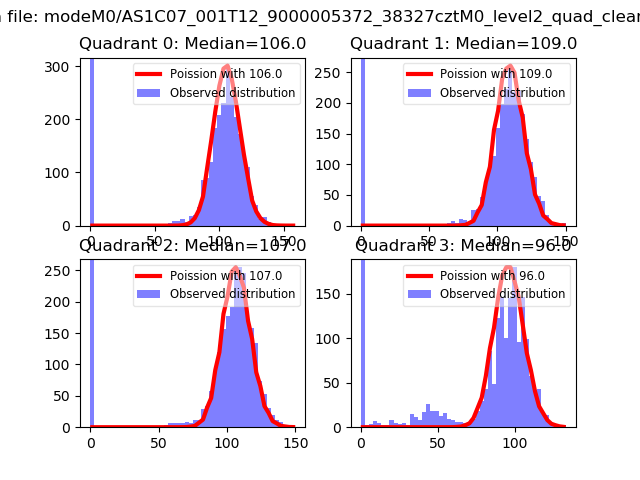 |
 |
| Quadrant-wise count rates Data is divided into 100 sec bins |
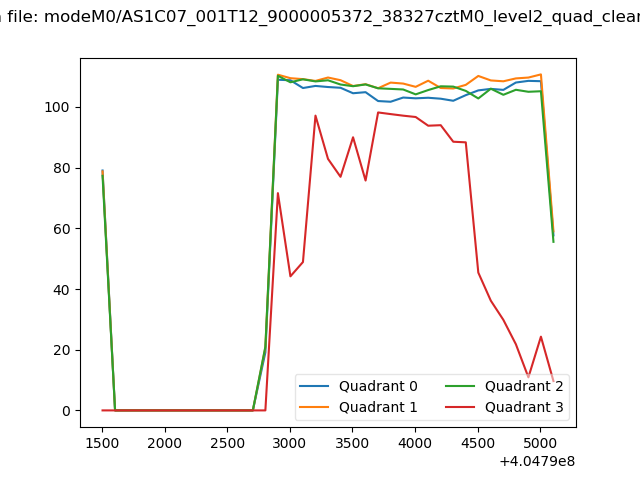 |
|
| Module-wise count rates for Quadrant A Data is divided into 100 sec bins |
 |
 |
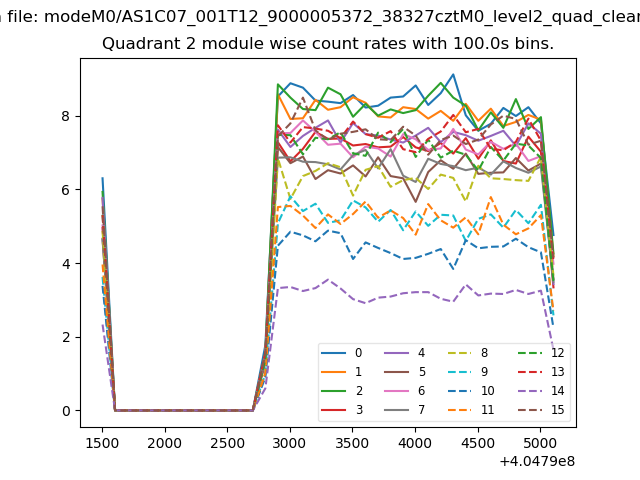
| Module-wise count rates for Quadrant B Data is divided into 100 sec bins |
 |
 |
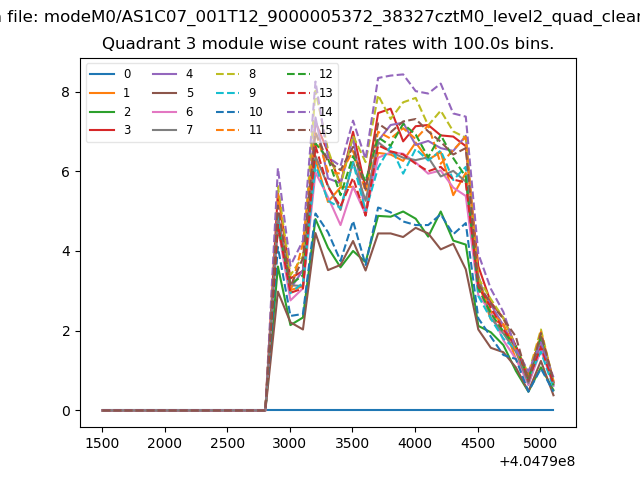
| Module-wise count rates for Quadrant C Data is divided into 100 sec bins |
 |
 |
| Module-wise count rates for Quadrant D Data is divided into 100 sec bins |
 |
 |
| Parameter | Plot |
|---|---|
| CZT HV Monitor | 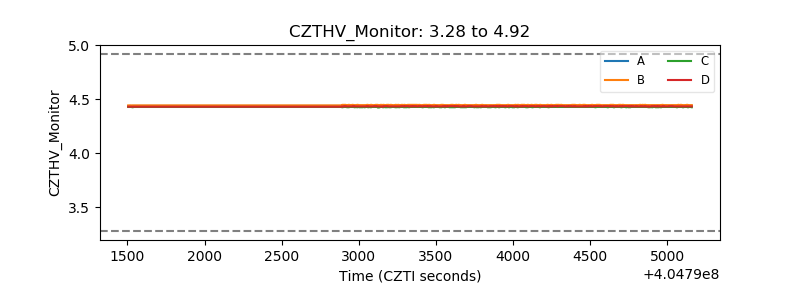 |
| D_VDD | 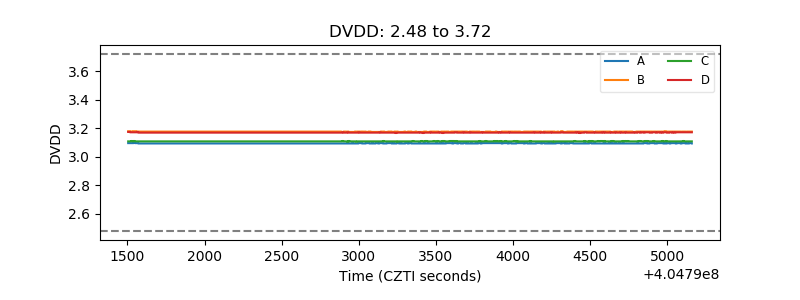 |
| Temperature 1 | 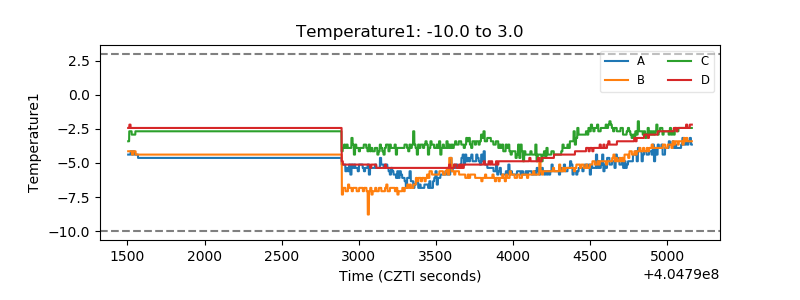 |
| Veto HV Monitor | 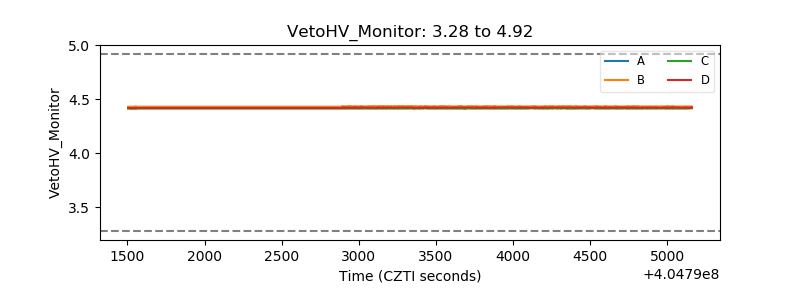 |
| Veto LLD | 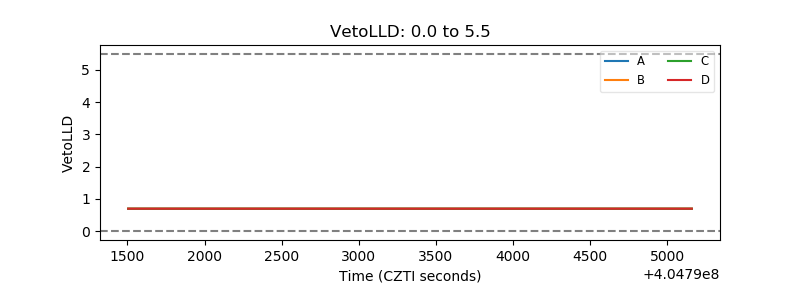 |
| Alpha Counter | 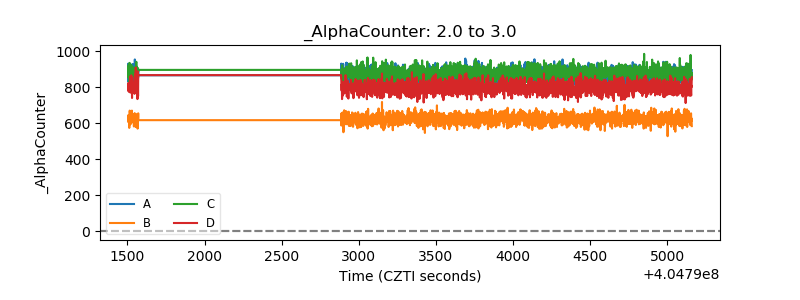 |
| _CPM_Rate | 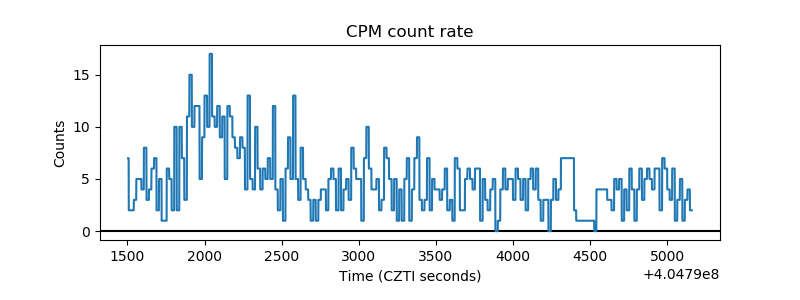 |
| CZT Counter | 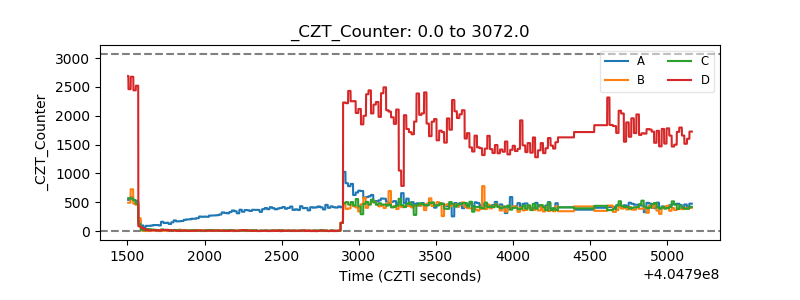 |
| +2.5 Volts monitor | 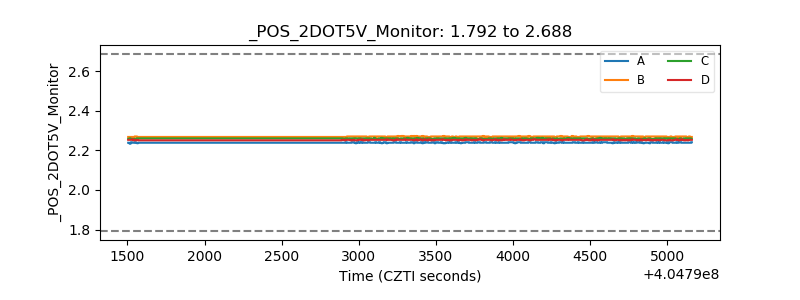 |
| +5 Volts monitor | 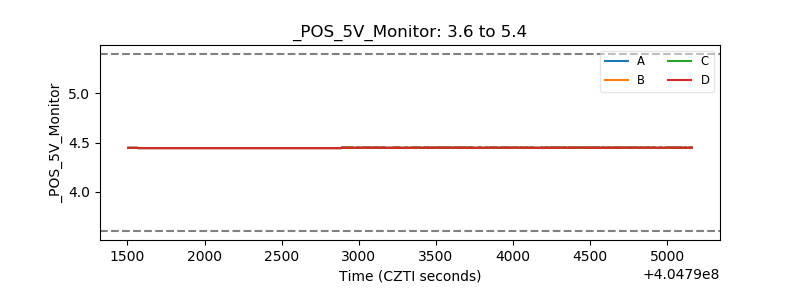 |
| _ROLL_ROT | 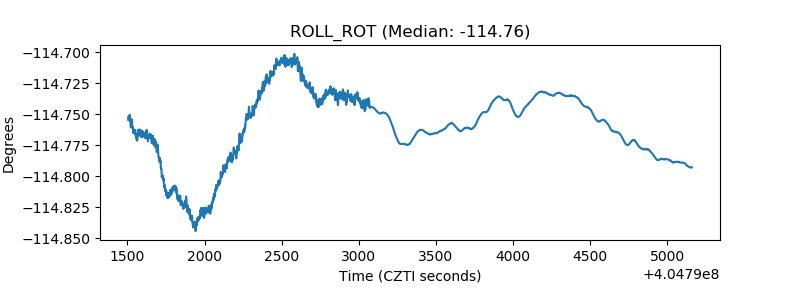 |
| _Roll_DEC | 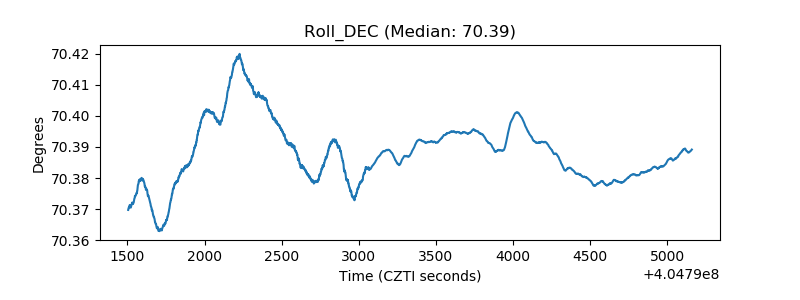 |
| _Roll_RA | 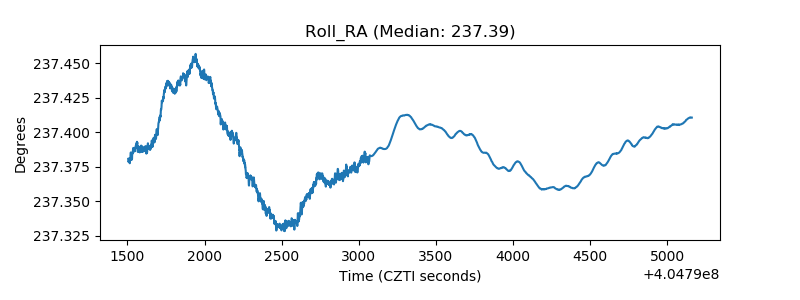 |
| Veto Counter | 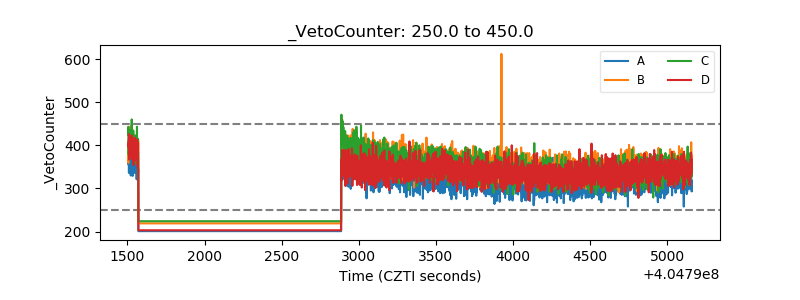 |