| Param | Original file | Final file |
|---|---|---|
| Filename | modeM0/AS1A10_094T24_9000005374_38327cztM0_level2.fits | modeM0/AS1A10_094T24_9000005374_38327cztM0_level2_quad_clean.evt |
| Size (bytes) | 1,441,350,720 | 231,255,360 |
| Size | 1.3 GB | 220.5 MB |
| Events in quadrant A | 7,907,546 | 1,673,138 |
| Events in quadrant B | 7,929,943 | 1,701,301 |
| Events in quadrant C | 7,623,232 | 1,664,368 |
| Events in quadrant D | 28,688,368 | 887,858 |
| Mode SS | |||
|---|---|---|---|
| Quadrant | BADHDUFLAG | Total packets | Discarded packets |
| A | 0 | 318 | 0 |
| B | 0 | 318 | 0 |
| C | 0 | 318 | 0 |
| D | 0 | 318 | 0 |
| Mode M0 | |||
|---|---|---|---|
| Quadrant | BADHDUFLAG | Total packets | Discarded packets |
| A | 0 | 32691 | 3 |
| B | 0 | 33857 | 3 |
| C | 0 | 32165 | 3 |
| D | 0 | 95873 | 3 |
| Mode M9 | |||
|---|---|---|---|
| Quadrant | BADHDUFLAG | Total packets | Discarded packets |
| A | 0 | 51 | 0 |
| B | 0 | 50 | 0 |
| C | 0 | 50 | 0 |
| D | 0 | 50 | 0 |
| Quadrant | Total seconds | Saturated seconds | Saturation percentage |
|---|---|---|---|
| A | 15580 | 32 | 0.205392% |
| B | 15580 | 144 | 0.924262% |
| C | 15580 | 44 | 0.282413% |
| D | 15580 | 7468 | 47.933248% |
Noise dominated data is calculated using 1-second bins in cleaned event files. If a bin has >2000 counts, and if more than 50% of those come from <1% of pixels, then it is considered to be noise-dominated and hence unusable.
| Quadrant | # 1 sec bins | Bins with >0 counts | Bins with >2000 counts | High rate bins dominated by noise | Noise dominated (total time) | Noise dominated (detector-on time) | Marked lightcurve |
|---|---|---|---|---|---|---|---|
| A | 19637 | 15583 | 15 | 15 | 0.08% | 0.10% | 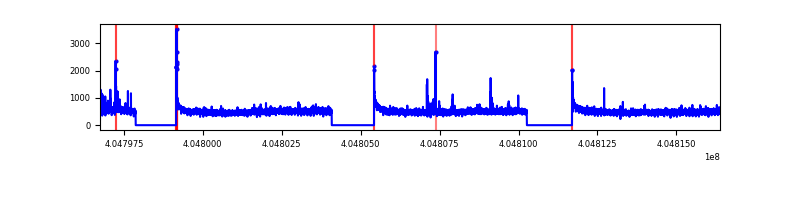 |
| B | 19637 | 15583 | 78 | 78 | 0.40% | 0.50% | 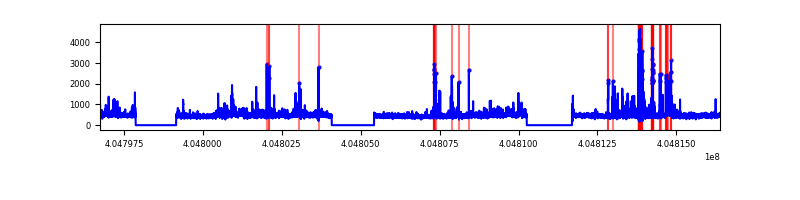 |
| C | 19637 | 15583 | 40 | 40 | 0.20% | 0.26% | 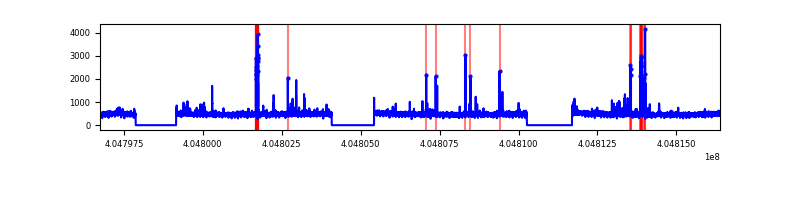 |
| D | 19637 | 15583 | 7351 | 7351 | 37.43% | 47.17% | 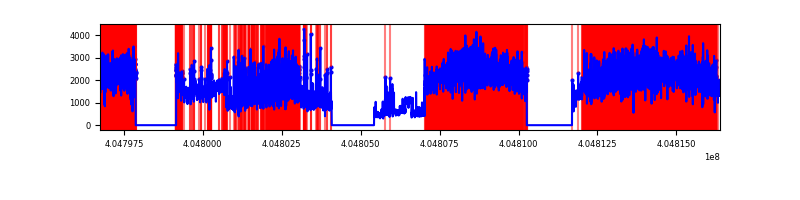 |
Top three noisy pixels from each quadrant. If the there are fewer than three noisy pixels in the level2.evt file, extra rows are filled as -1
| Pixel properties | Quadrant properties | ||||||
|---|---|---|---|---|---|---|---|
| Quadrant | DetID | PixID | Counts | Sigma | Mean | Median | Sigma |
| A | 10 | 83 | 957048 | 2752.85 | 1725 | 1690 | 347.0 |
| A | 12 | 189 | 95694 | 270.87 | 1725 | 1690 | 347.0 |
| A | 9 | 143 | 80148 | 226.08 | 1725 | 1690 | 347.0 |
| B | 0 | 183 | 517001 | 1575.43 | 1716 | 1669 | 327.1 |
| B | 0 | 229 | 300914 | 914.83 | 1716 | 1669 | 327.1 |
| B | 5 | 184 | 126301 | 381.01 | 1716 | 1669 | 327.1 |
| C | 15 | 214 | 654376 | 1670.46 | 1689 | 1697 | 390.7 |
| C | 5 | 250 | 249095 | 633.19 | 1689 | 1697 | 390.7 |
| C | 1 | 23 | 34660 | 84.36 | 1689 | 1697 | 390.7 |
| D | 10 | 203 | 14925036 | 41723.44 | 1465 | 1421 | 357.7 |
| D | 2 | 16 | 5526382 | 15446.68 | 1465 | 1421 | 357.7 |
| D | 12 | 235 | 1495299 | 4176.58 | 1465 | 1421 | 357.7 |
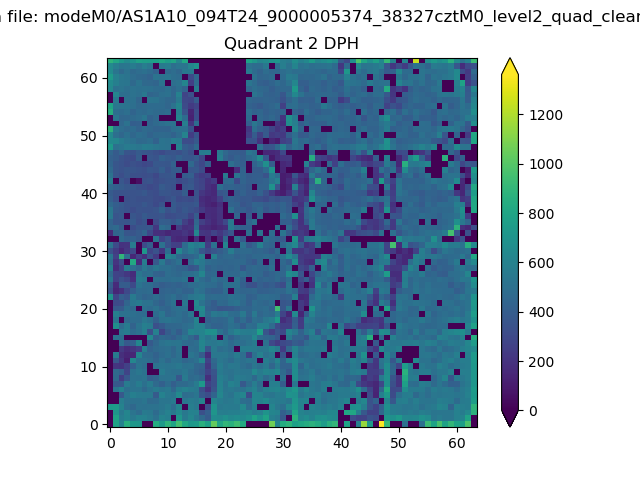
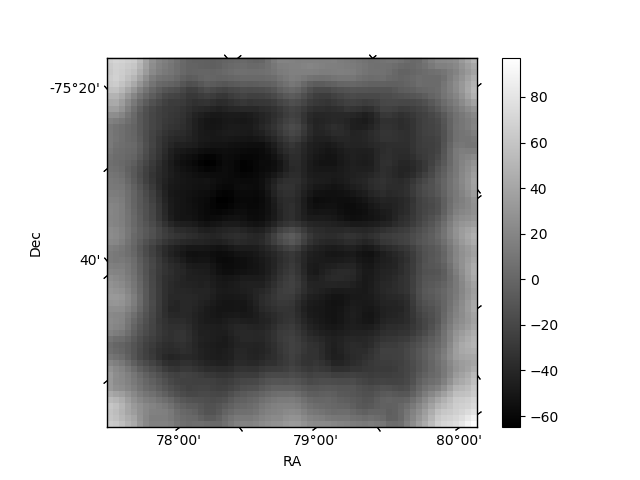
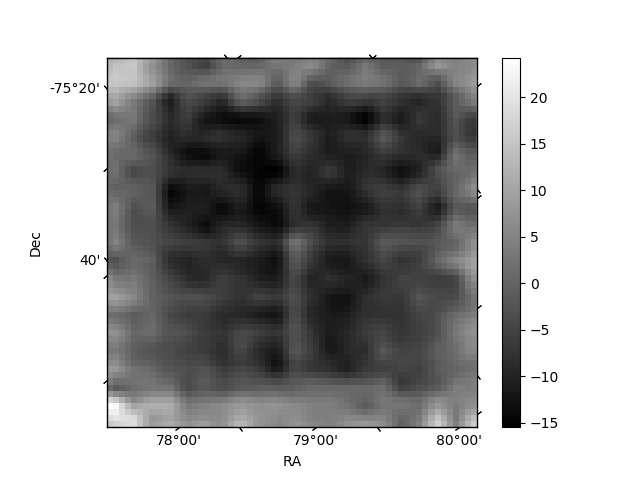
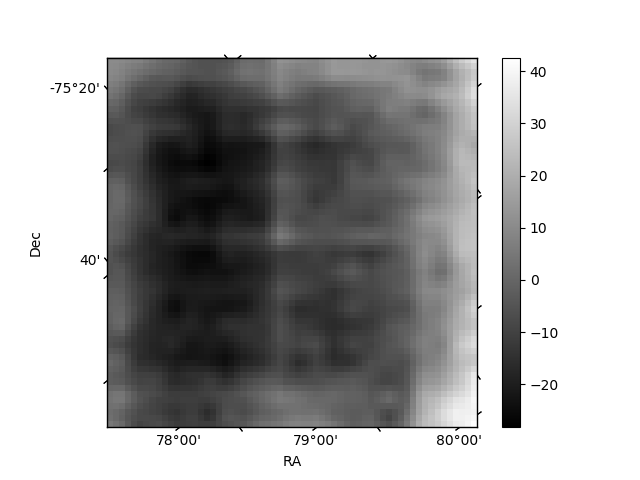
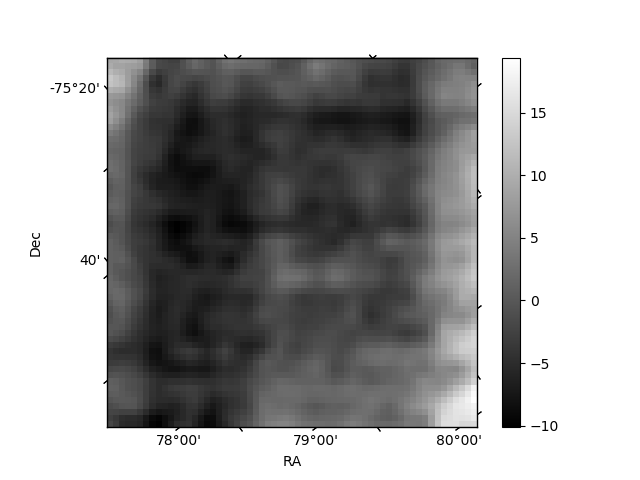
Histogram calculated using DETX and DETY for each event in the final _common_clean file
| Quadrant A | 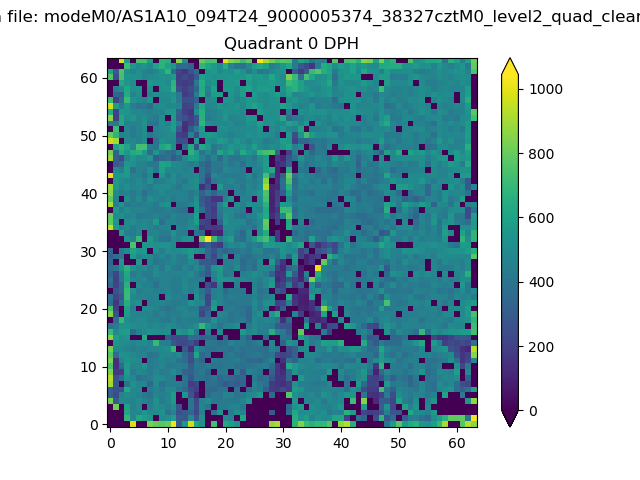 |
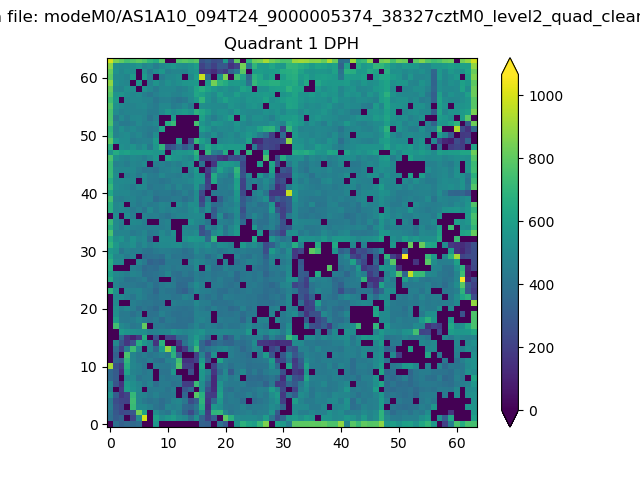 |
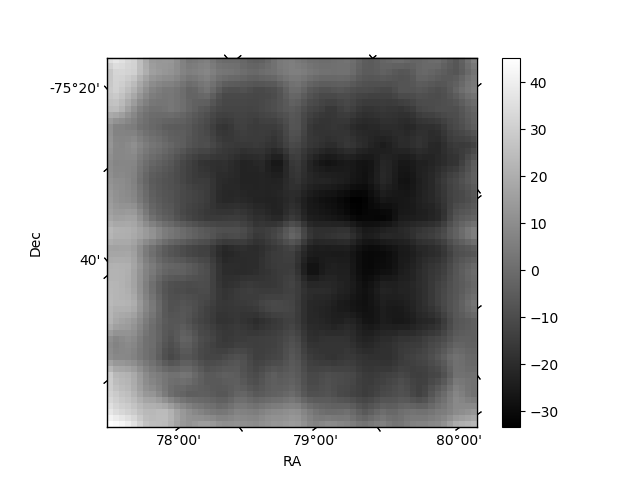
Quadrant B |
|---|---|---|---|
| Quadrant D | 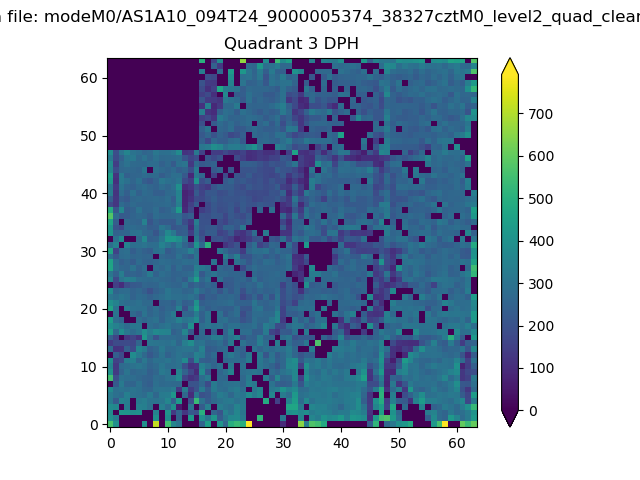 |
 |
Quadrant C |
| Plot type | Count rate plots | Images |
|---|---|---|
| Comparison with Poisson distribution Blue bars denote a histogram of data divided into 1 sec bins. Red curve is a Poisson curve with rate = median count rate of data. |
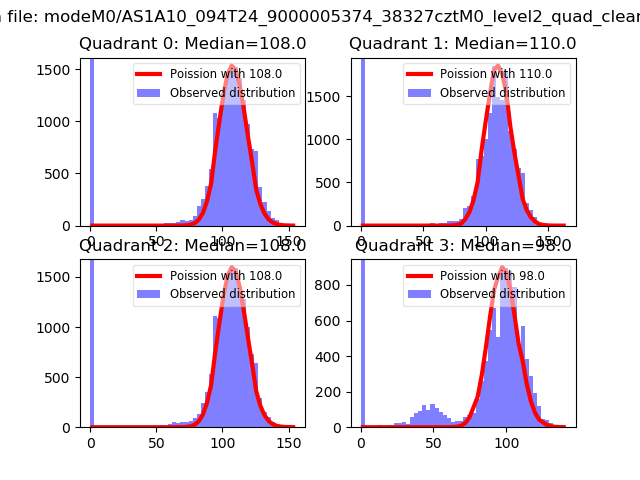 |
 |
| Quadrant-wise count rates Data is divided into 100 sec bins |
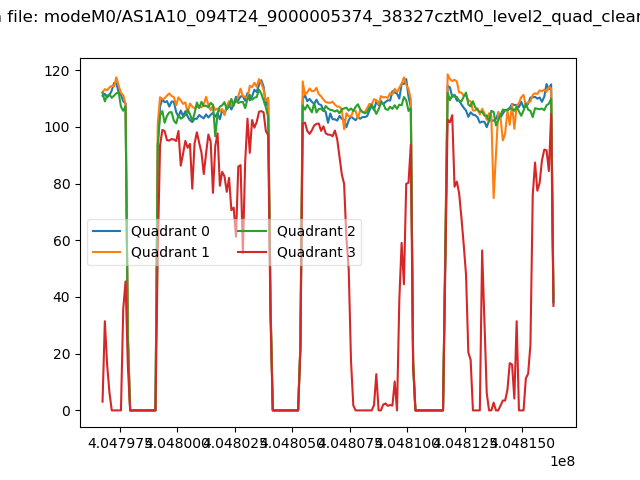 |
|
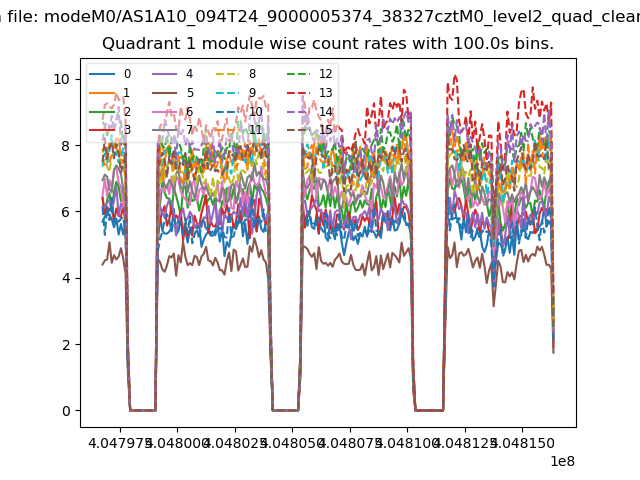
| Module-wise count rates for Quadrant A Data is divided into 100 sec bins |
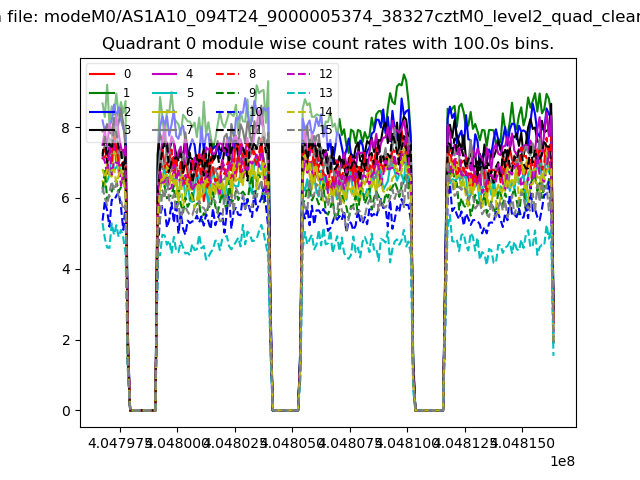 |
 |
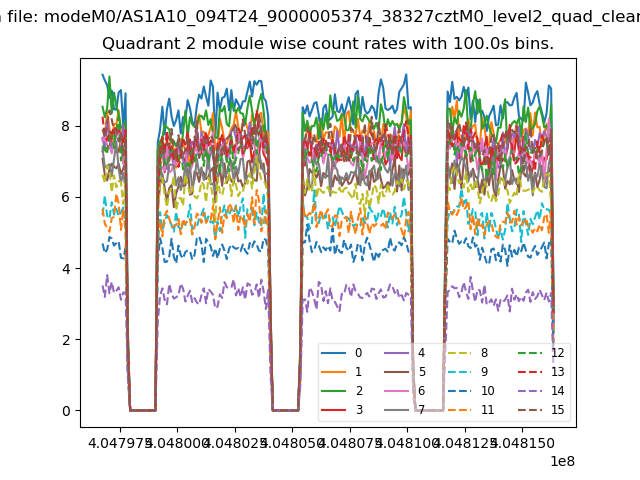
| Module-wise count rates for Quadrant B Data is divided into 100 sec bins |
 |
 |
| Module-wise count rates for Quadrant C Data is divided into 100 sec bins |
 |
 |
| Module-wise count rates for Quadrant D Data is divided into 100 sec bins |
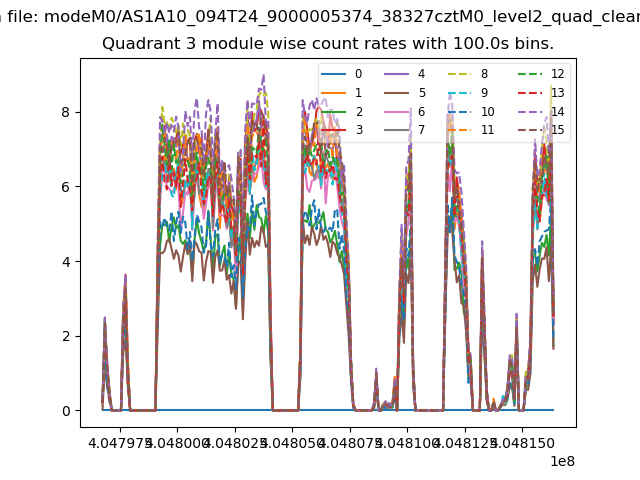 |
 |
| Parameter | Plot |
|---|---|
| CZT HV Monitor | 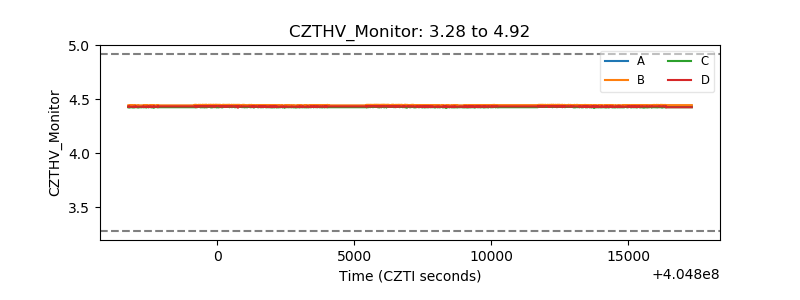 |
| D_VDD | 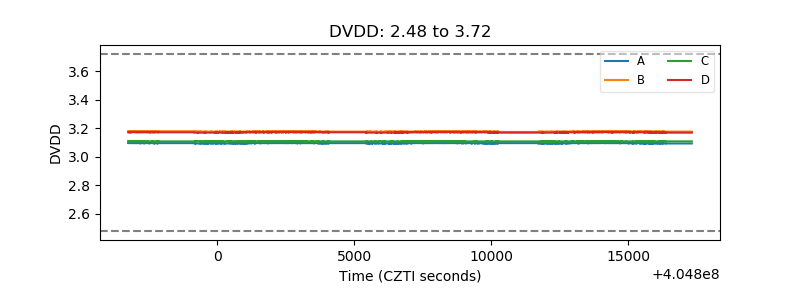 |
| Temperature 1 | 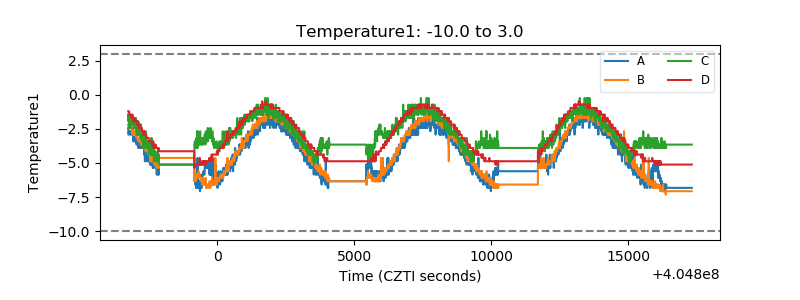 |
| Veto HV Monitor | 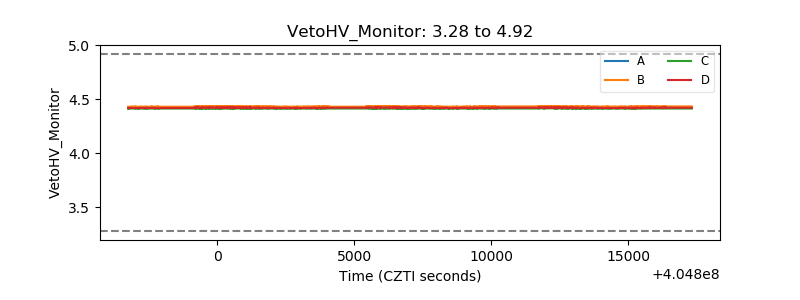 |
| Veto LLD | 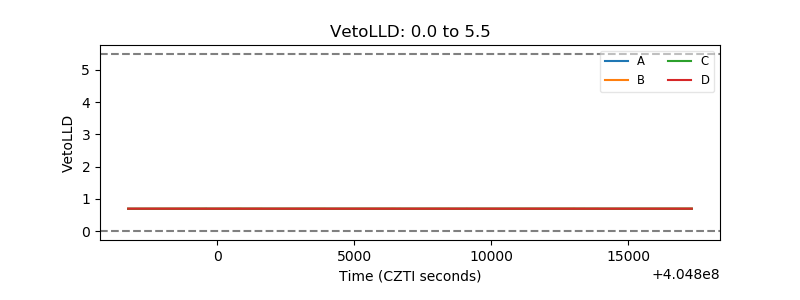 |
| Alpha Counter | 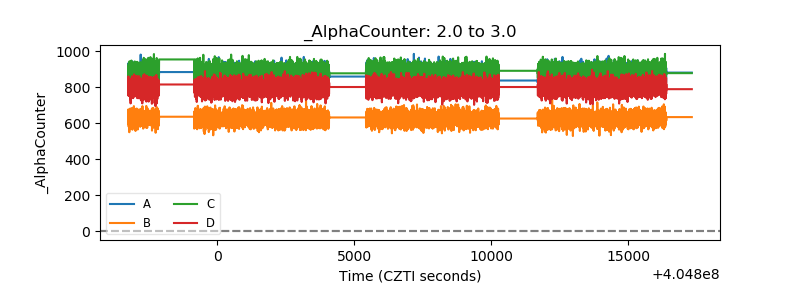 |
| _CPM_Rate | 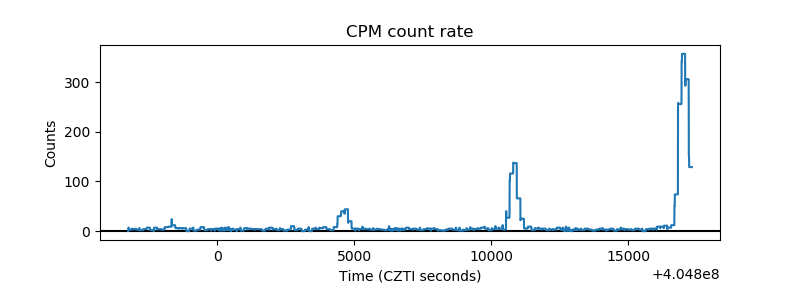 |
| CZT Counter | 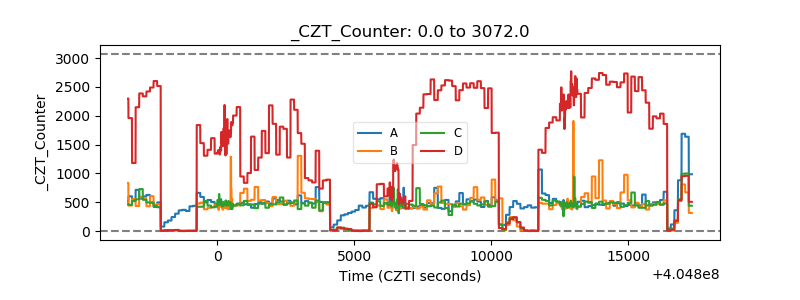 |
| +2.5 Volts monitor | 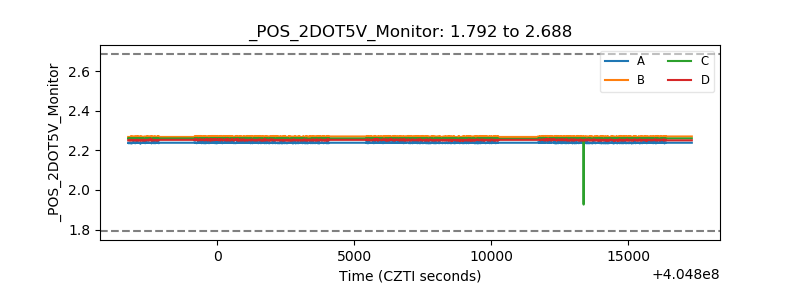 |
| +5 Volts monitor | 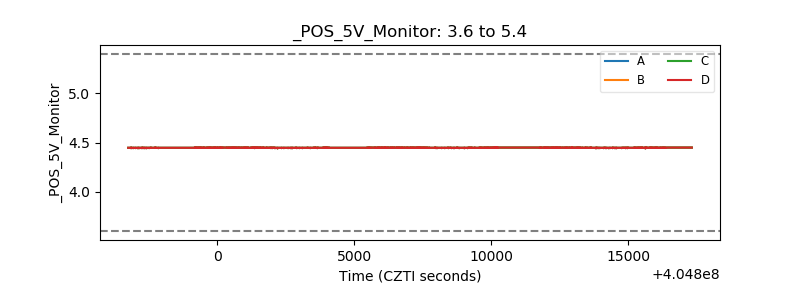 |
| _ROLL_ROT | 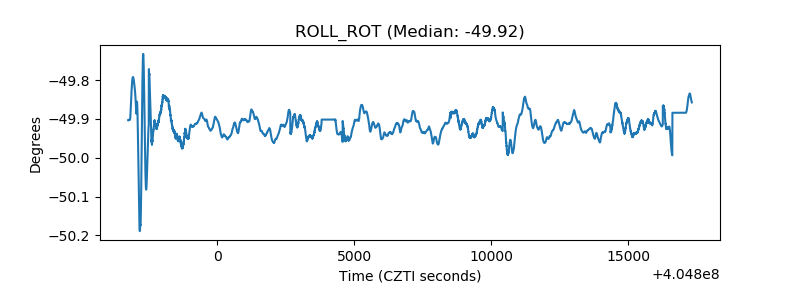 |
| _Roll_DEC | 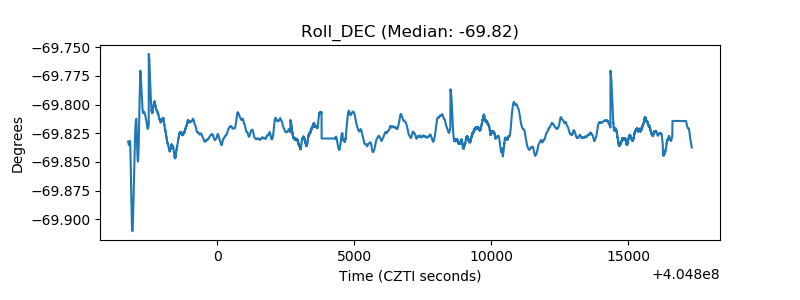 |
| _Roll_RA | 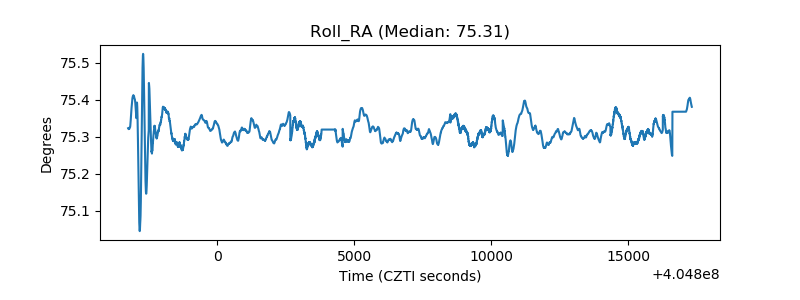 |
| Veto Counter | 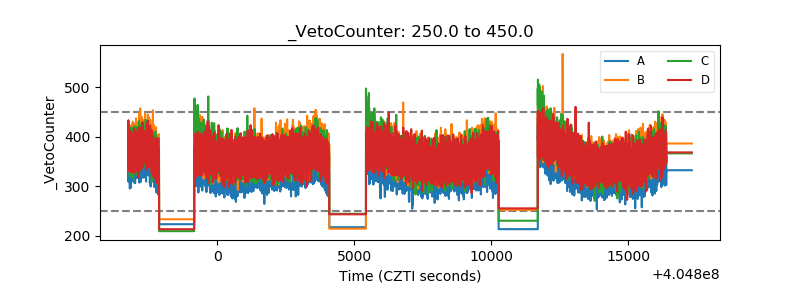 |