| Param | Original file | Final file |
|---|---|---|
| Filename | modeM0/AS1A10_094T24_9000005374_38329cztM0_level2.fits | modeM0/AS1A10_094T24_9000005374_38329cztM0_level2_quad_clean.evt |
| Size (bytes) | 979,496,640 | 161,242,560 |
| Size | 934.1 MB | 153.8 MB |
| Events in quadrant A | 5,384,654 | 1,177,168 |
| Events in quadrant B | 5,478,053 | 1,201,608 |
| Events in quadrant C | 4,864,112 | 1,168,876 |
| Events in quadrant D | 19,750,214 | 635,054 |
| Mode SS | |||
|---|---|---|---|
| Quadrant | BADHDUFLAG | Total packets | Discarded packets |
| A | 0 | 206 | 0 |
| B | 0 | 206 | 0 |
| C | 0 | 206 | 0 |
| D | 0 | 206 | 0 |
| Mode M0 | |||
|---|---|---|---|
| Quadrant | BADHDUFLAG | Total packets | Discarded packets |
| A | 0 | 22118 | 4 |
| B | 0 | 22856 | 3 |
| C | 0 | 20801 | 3 |
| D | 0 | 65527 | 3 |
| Mode M9 | |||
|---|---|---|---|
| Quadrant | BADHDUFLAG | Total packets | Discarded packets |
| A | 0 | 46 | 0 |
| B | 0 | 46 | 0 |
| C | 0 | 46 | 0 |
| D | 0 | 47 | 0 |
| Quadrant | Total seconds | Saturated seconds | Saturation percentage |
|---|---|---|---|
| A | 10091 | 34 | 0.336934% |
| B | 10091 | 90 | 0.891884% |
| C | 10091 | 17 | 0.168467% |
| D | 10091 | 4725 | 46.823902% |
Noise dominated data is calculated using 1-second bins in cleaned event files. If a bin has >2000 counts, and if more than 50% of those come from <1% of pixels, then it is considered to be noise-dominated and hence unusable.
| Quadrant | # 1 sec bins | Bins with >0 counts | Bins with >2000 counts | High rate bins dominated by noise | Noise dominated (total time) | Noise dominated (detector-on time) | Marked lightcurve |
|---|---|---|---|---|---|---|---|
| A | 13617 | 10093 | 15 | 15 | 0.11% | 0.15% | 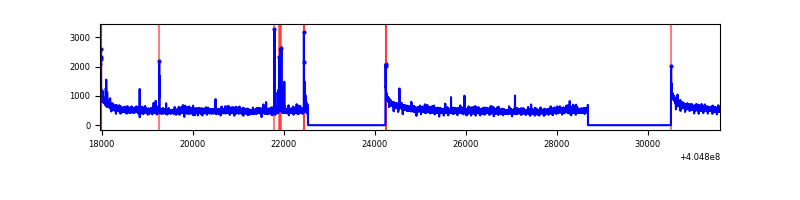 |
| B | 13617 | 10093 | 38 | 38 | 0.28% | 0.38% | 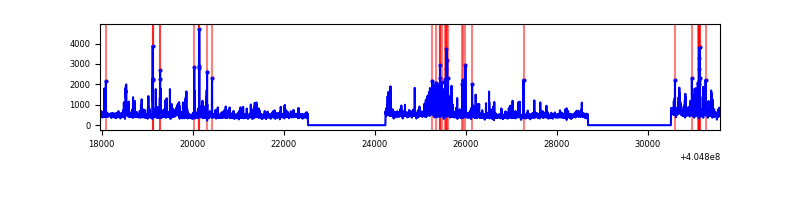 |
| C | 13617 | 10093 | 7 | 7 | 0.05% | 0.07% | 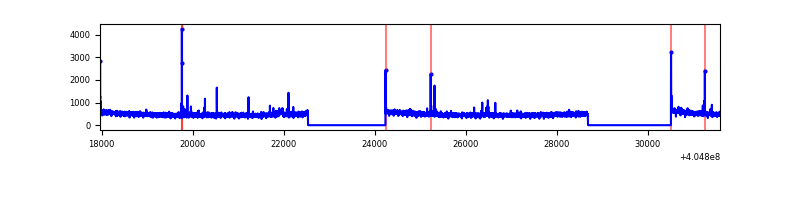 |
| D | 13617 | 10093 | 5143 | 5143 | 37.77% | 50.96% | 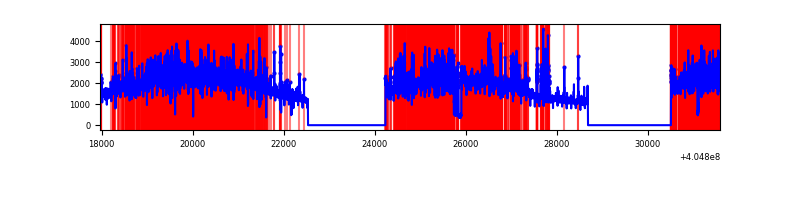 |
Top three noisy pixels from each quadrant. If the there are fewer than three noisy pixels in the level2.evt file, extra rows are filled as -1
| Pixel properties | Quadrant properties | ||||||
|---|---|---|---|---|---|---|---|
| Quadrant | DetID | PixID | Counts | Sigma | Mean | Median | Sigma |
| A | 10 | 83 | 732178 | 3209.97 | 1141 | 1119 | 227.7 |
| A | 13 | 248 | 82249 | 356.23 | 1141 | 1119 | 227.7 |
| A | 12 | 189 | 75620 | 327.12 | 1141 | 1119 | 227.7 |
| B | 0 | 183 | 353380 | 1654.71 | 1134 | 1103 | 212.9 |
| B | 0 | 229 | 346461 | 1622.21 | 1134 | 1103 | 212.9 |
| B | 0 | 186 | 135775 | 632.58 | 1134 | 1103 | 212.9 |
| C | 15 | 214 | 427755 | 1659.41 | 1110 | 1116 | 257.1 |
| C | 1 | 23 | 33656 | 126.56 | 1110 | 1116 | 257.1 |
| C | 0 | 10 | 26376 | 98.25 | 1110 | 1116 | 257.1 |
| D | 10 | 203 | 12754112 | 51524.45 | 994 | 966 | 247.5 |
| D | 2 | 16 | 743463 | 2999.79 | 994 | 966 | 247.5 |
| D | 12 | 235 | 705891 | 2847.99 | 994 | 966 | 247.5 |
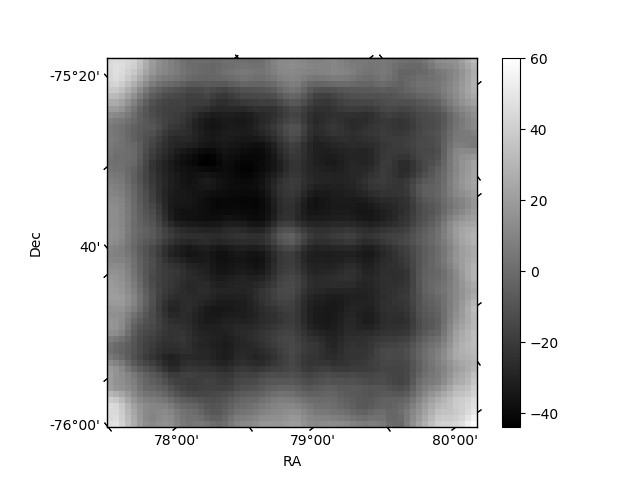
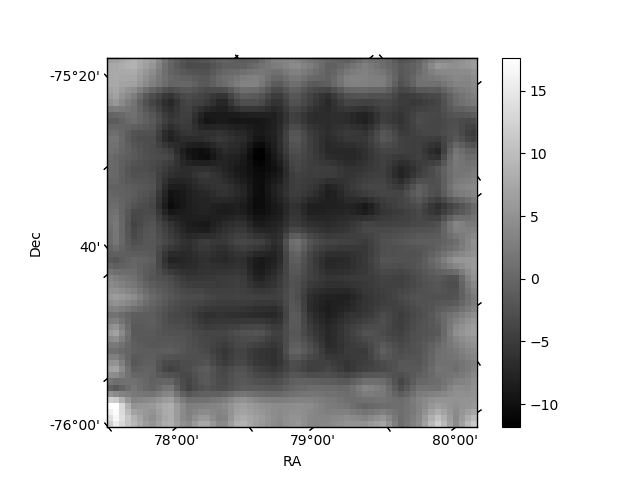
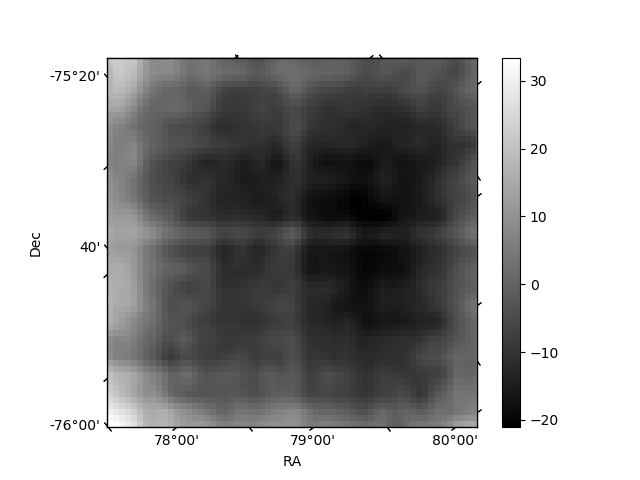
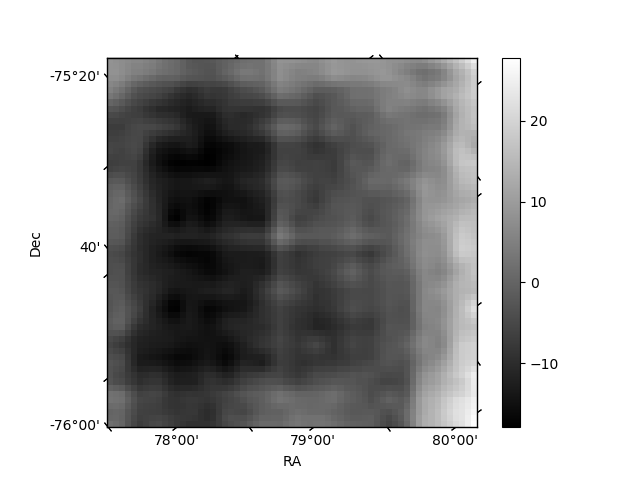
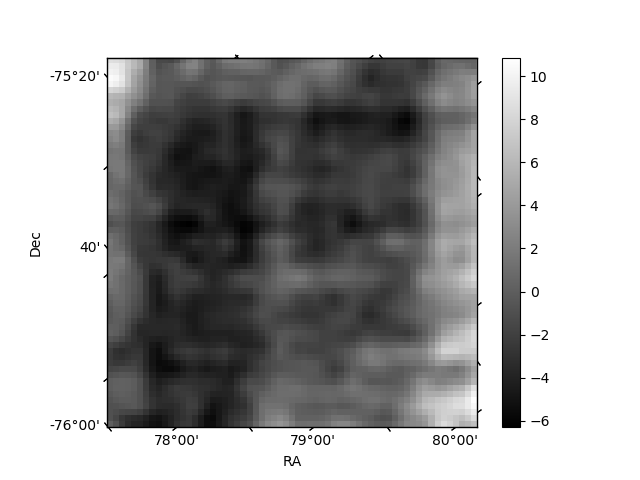
Histogram calculated using DETX and DETY for each event in the final _common_clean file
| Quadrant A | 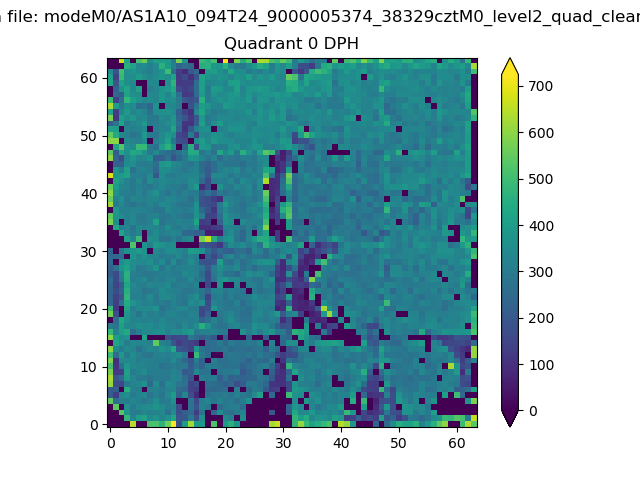 |
 |
Quadrant B |
|---|---|---|---|
| Quadrant D | 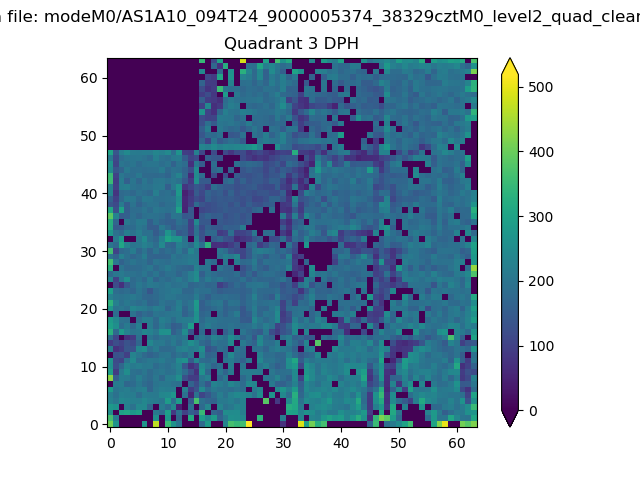 |
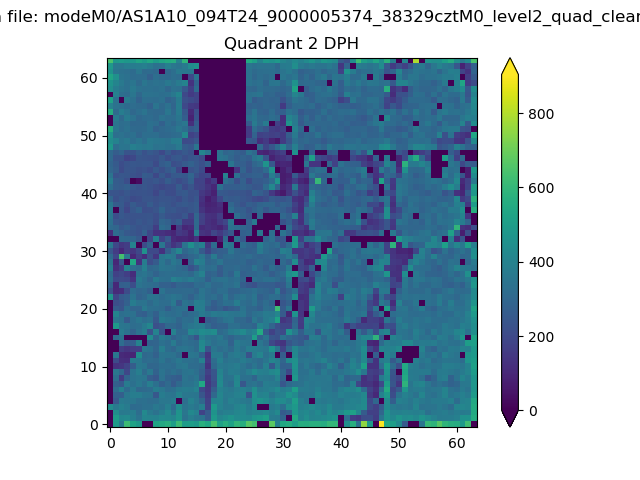 |
Quadrant C |
| Plot type | Count rate plots | Images |
|---|---|---|
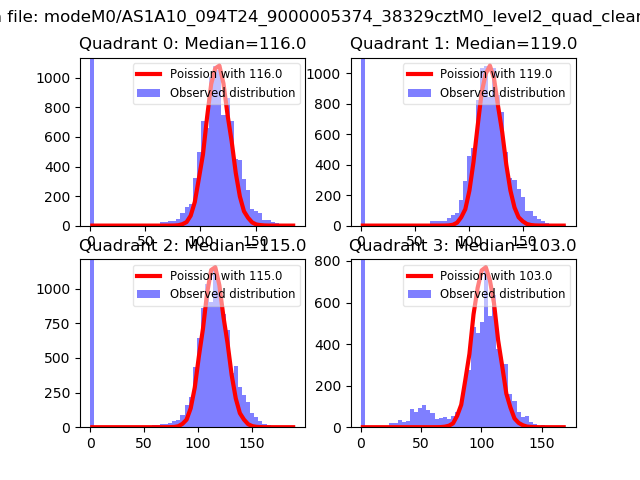
| Comparison with Poisson distribution Blue bars denote a histogram of data divided into 1 sec bins. Red curve is a Poisson curve with rate = median count rate of data. |
 |
 |
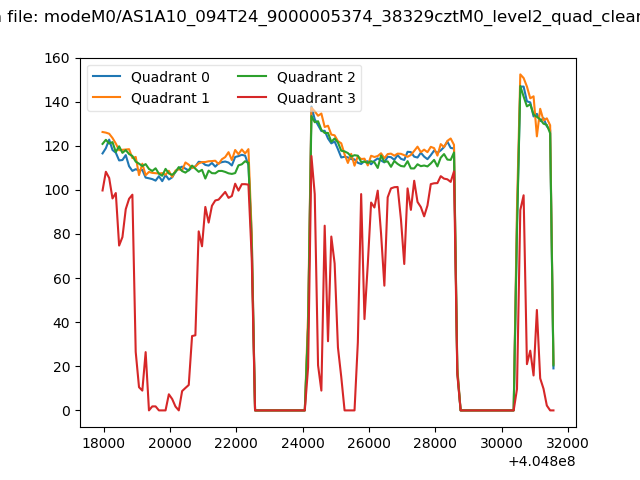
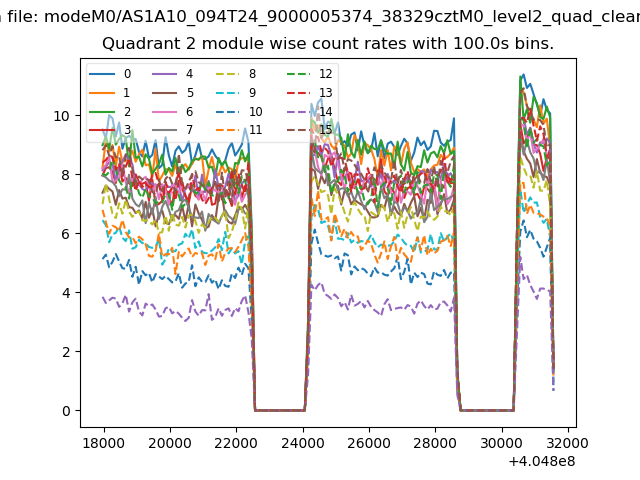
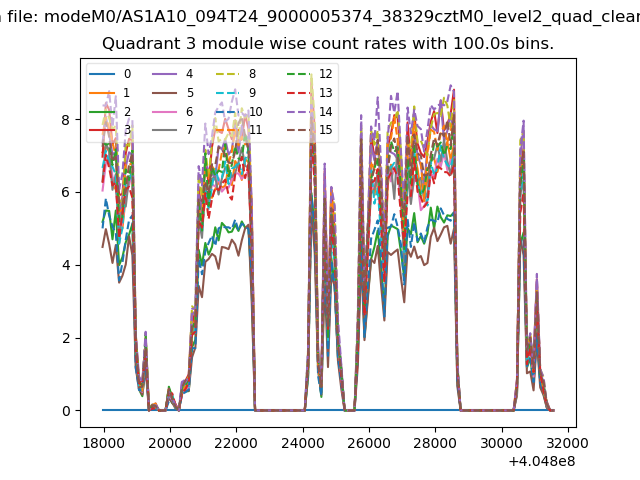
| Quadrant-wise count rates Data is divided into 100 sec bins |
 |
|
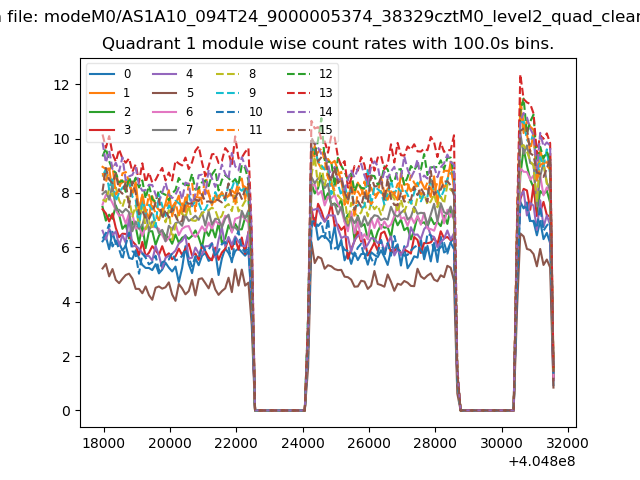
| Module-wise count rates for Quadrant A Data is divided into 100 sec bins |
 |
 |
| Module-wise count rates for Quadrant B Data is divided into 100 sec bins |
 |
 |
| Module-wise count rates for Quadrant C Data is divided into 100 sec bins |
 |
 |
| Module-wise count rates for Quadrant D Data is divided into 100 sec bins |
 |
 |
| Parameter | Plot |
|---|---|
| CZT HV Monitor | 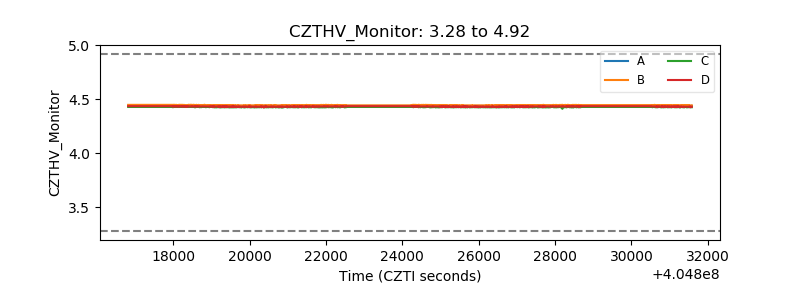 |
| D_VDD | 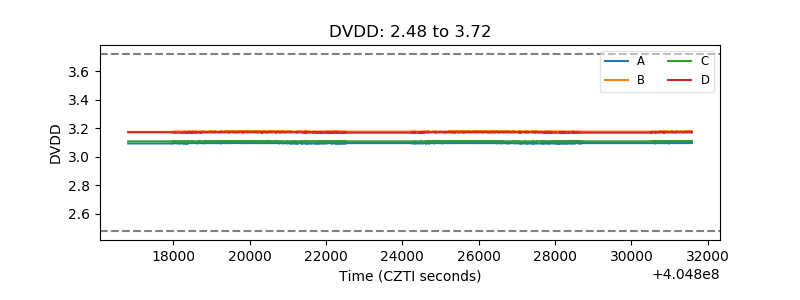 |
| Temperature 1 | 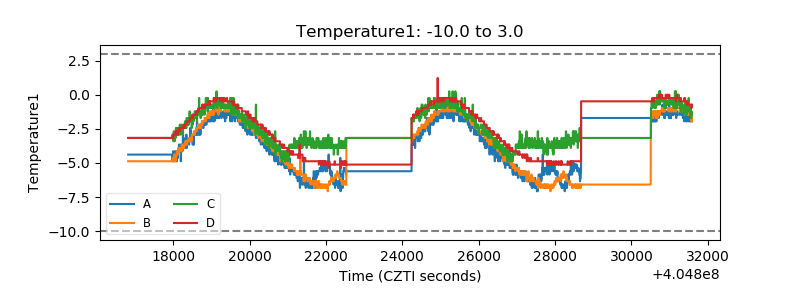 |
| Veto HV Monitor |  |
| Veto LLD | 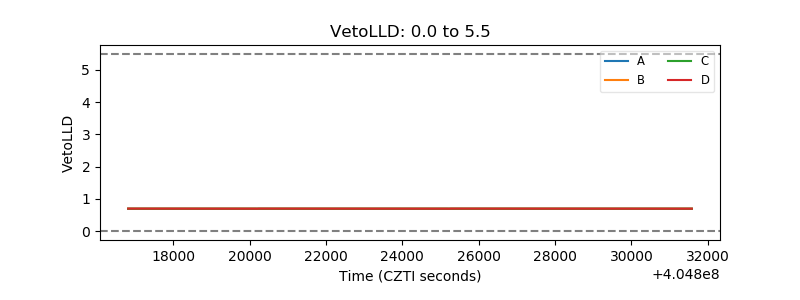 |
| Alpha Counter | 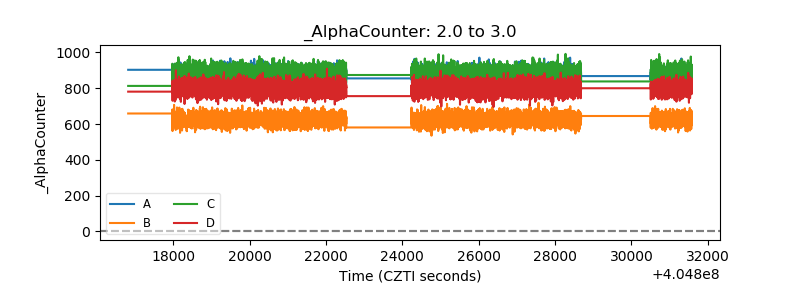 |
| _CPM_Rate | 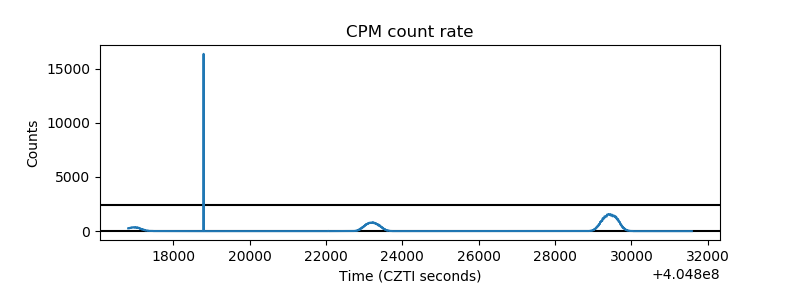 |
| CZT Counter | 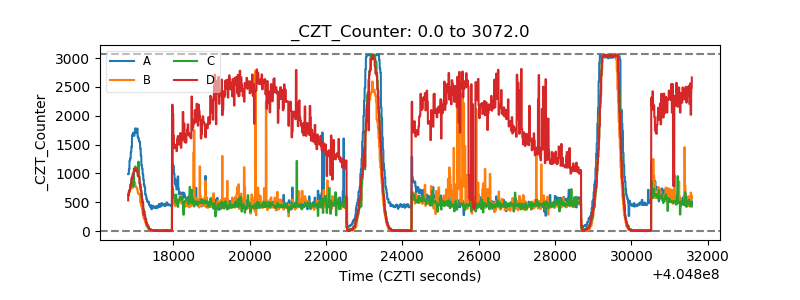 |
| +2.5 Volts monitor | 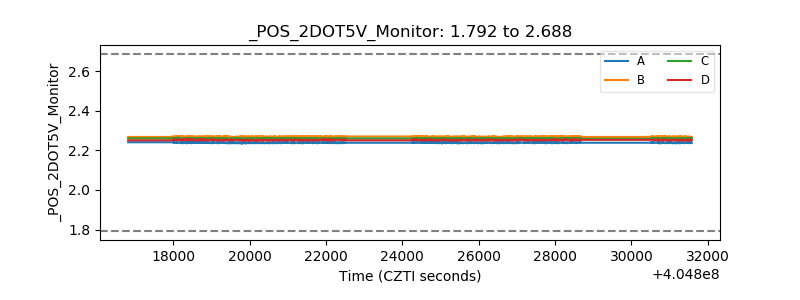 |
| +5 Volts monitor | 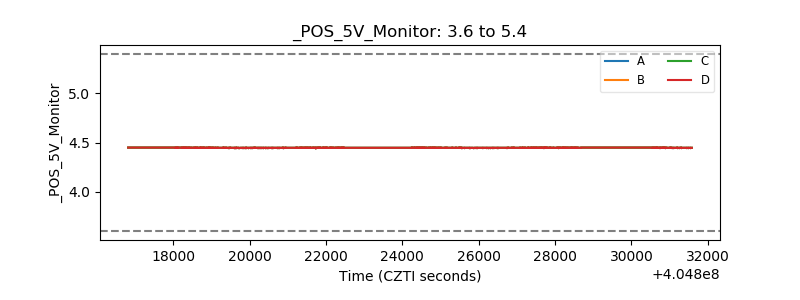 |
| _ROLL_ROT | 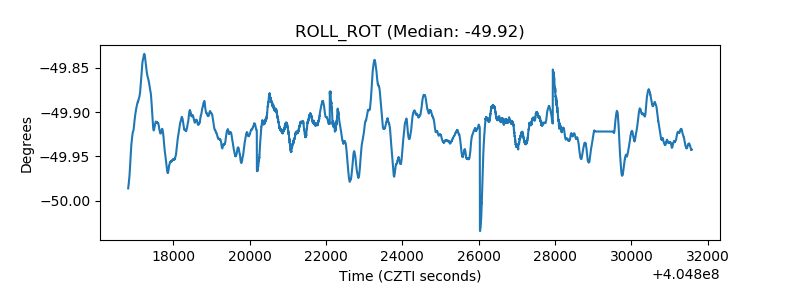 |
| _Roll_DEC | 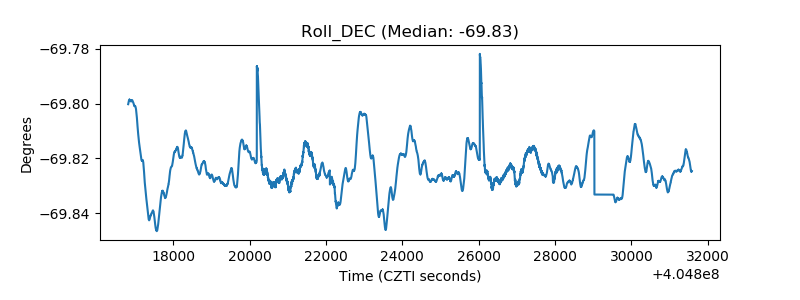 |
| _Roll_RA | 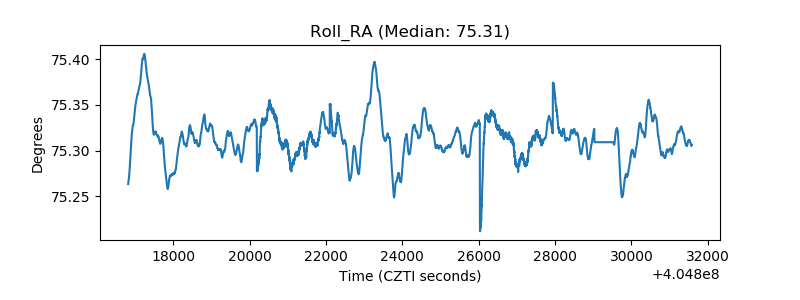 |
| Veto Counter | 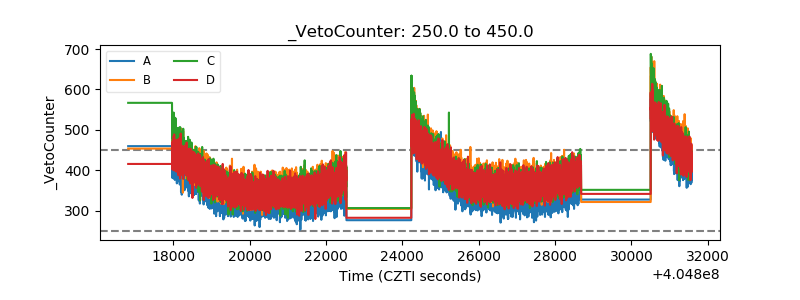 |