| Param | Original file | Final file |
|---|---|---|
| Filename | modeM0/AS1A10_094T24_9000005374_38330cztM0_level2.fits | modeM0/AS1A10_094T24_9000005374_38330cztM0_level2_quad_clean.evt |
| Size (bytes) | 498,202,560 | 82,912,320 |
| Size | 475.1 MB | 79.1 MB |
| Events in quadrant A | 2,694,679 | 630,060 |
| Events in quadrant B | 2,993,020 | 634,144 |
| Events in quadrant C | 2,441,855 | 610,366 |
| Events in quadrant D | 9,929,659 | 290,838 |
| Mode SS | |||
|---|---|---|---|
| Quadrant | BADHDUFLAG | Total packets | Discarded packets |
| A | 0 | 100 | 0 |
| B | 0 | 100 | 0 |
| C | 0 | 100 | 0 |
| D | 0 | 100 | 0 |
| Mode M0 | |||
|---|---|---|---|
| Quadrant | BADHDUFLAG | Total packets | Discarded packets |
| A | 0 | 11000 | 2 |
| B | 0 | 12126 | 1 |
| C | 0 | 10216 | 1 |
| D | 0 | 32882 | 1 |
| Mode M9 | |||
|---|---|---|---|
| Quadrant | BADHDUFLAG | Total packets | Discarded packets |
| A | 0 | 20 | 0 |
| B | 0 | 20 | 0 |
| C | 0 | 20 | 0 |
| D | 0 | 20 | 0 |
| Quadrant | Total seconds | Saturated seconds | Saturation percentage |
|---|---|---|---|
| A | 4923 | 12 | 0.243754% |
| B | 4923 | 113 | 2.295348% |
| C | 4923 | 13 | 0.264067% |
| D | 4923 | 2475 | 50.274223% |
Noise dominated data is calculated using 1-second bins in cleaned event files. If a bin has >2000 counts, and if more than 50% of those come from <1% of pixels, then it is considered to be noise-dominated and hence unusable.
| Quadrant | # 1 sec bins | Bins with >0 counts | Bins with >2000 counts | High rate bins dominated by noise | Noise dominated (total time) | Noise dominated (detector-on time) | Marked lightcurve |
|---|---|---|---|---|---|---|---|
| A | 6897 | 4924 | 3 | 3 | 0.04% | 0.06% | 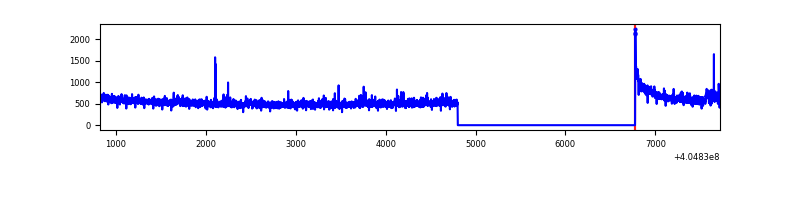 |
| B | 6897 | 4924 | 72 | 72 | 1.04% | 1.46% | 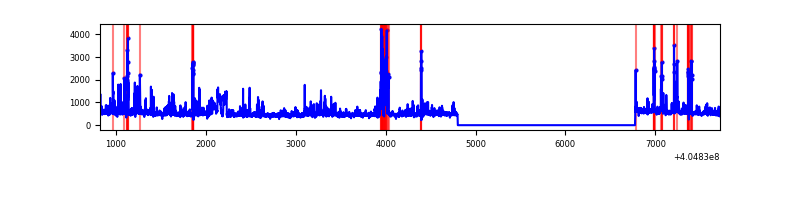 |
| C | 6897 | 4924 | 10 | 10 | 0.14% | 0.20% | 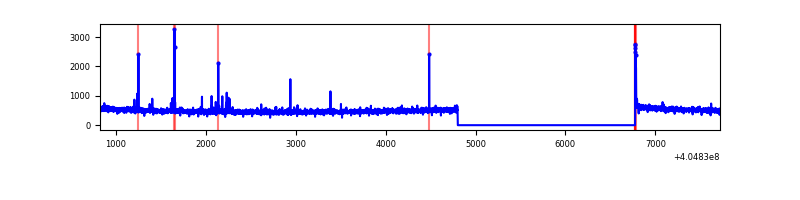 |
| D | 6896 | 4923 | 2642 | 2642 | 38.31% | 53.67% | 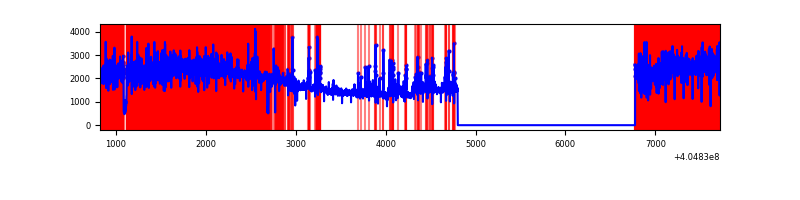 |
Top three noisy pixels from each quadrant. If the there are fewer than three noisy pixels in the level2.evt file, extra rows are filled as -1
| Pixel properties | Quadrant properties | ||||||
|---|---|---|---|---|---|---|---|
| Quadrant | DetID | PixID | Counts | Sigma | Mean | Median | Sigma |
| A | 10 | 83 | 344241 | 2952.23 | 580 | 571 | 116.4 |
| A | 12 | 189 | 67540 | 575.28 | 580 | 571 | 116.4 |
| A | 13 | 6 | 19921 | 166.22 | 580 | 571 | 116.4 |
| B | 5 | 184 | 256501 | 2395.28 | 573 | 559 | 106.9 |
| B | 0 | 229 | 181519 | 1693.55 | 573 | 559 | 106.9 |
| B | 0 | 186 | 103813 | 966.32 | 573 | 559 | 106.9 |
| C | 15 | 214 | 203908 | 1577.08 | 558 | 561 | 128.9 |
| C | 0 | 10 | 20308 | 153.15 | 558 | 561 | 128.9 |
| C | 14 | 254 | 19510 | 146.96 | 558 | 561 | 128.9 |
| D | 10 | 203 | 5961196 | 51279.11 | 473 | 458 | 116.2 |
| D | 2 | 16 | 613347 | 5272.57 | 473 | 458 | 116.2 |
| D | 1 | 20 | 602707 | 5181.03 | 473 | 458 | 116.2 |
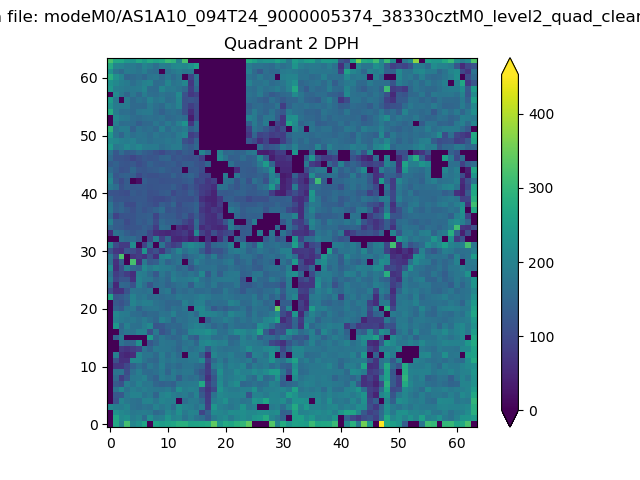
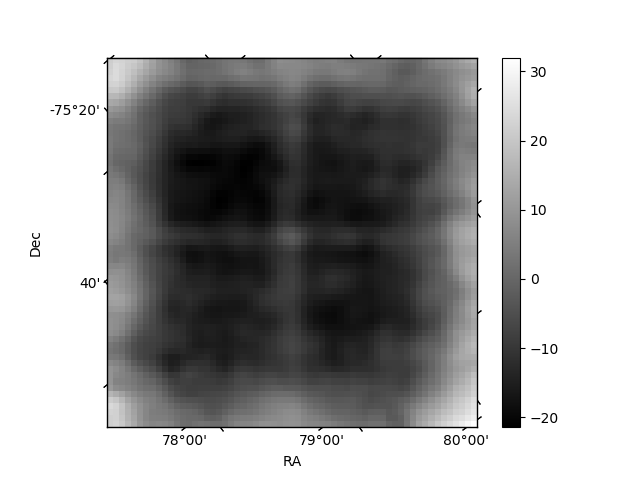
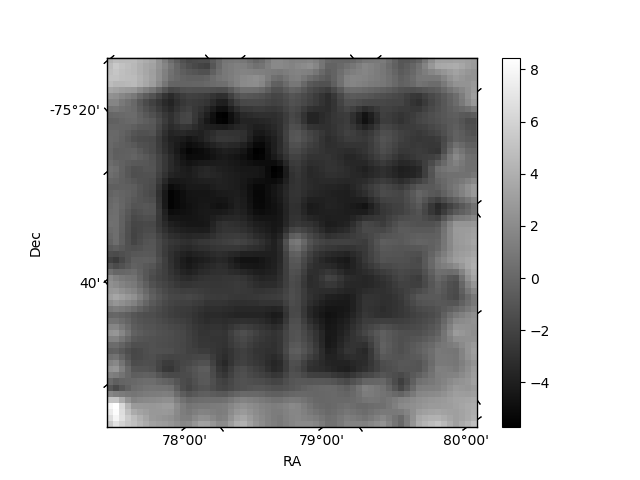
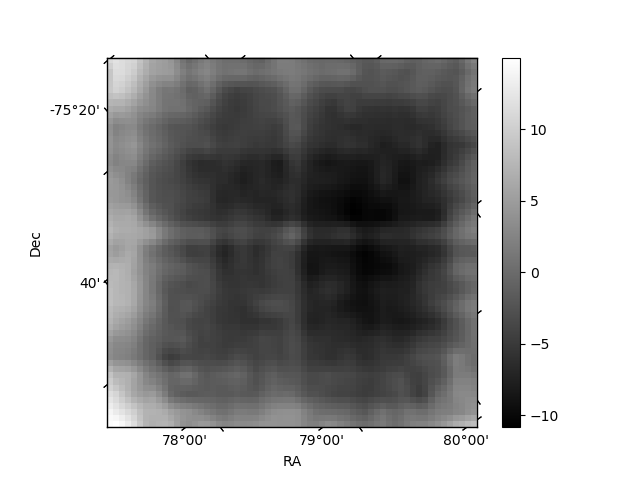
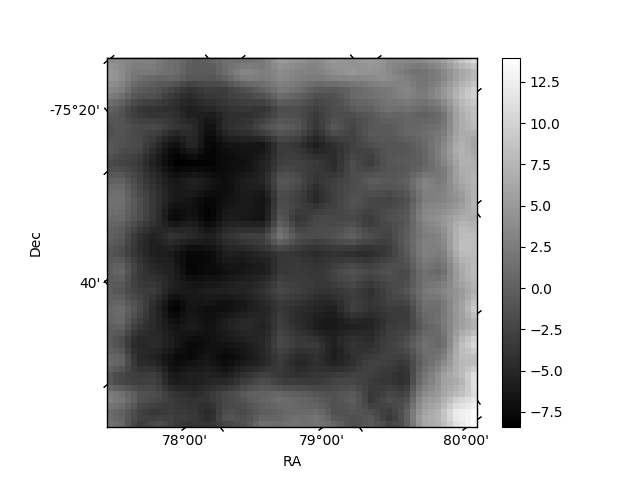
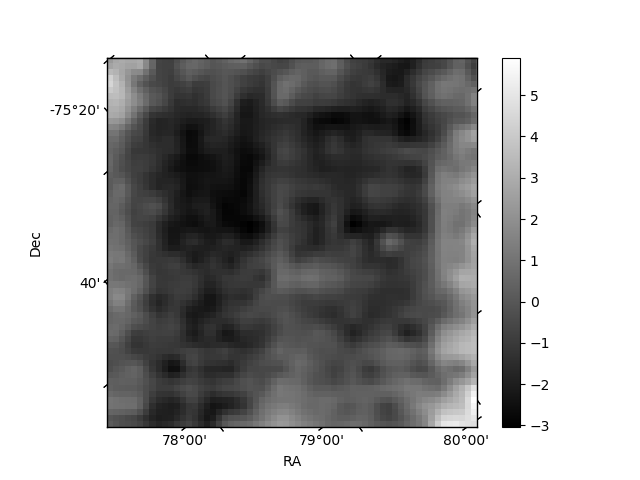
Histogram calculated using DETX and DETY for each event in the final _common_clean file
| Quadrant A | 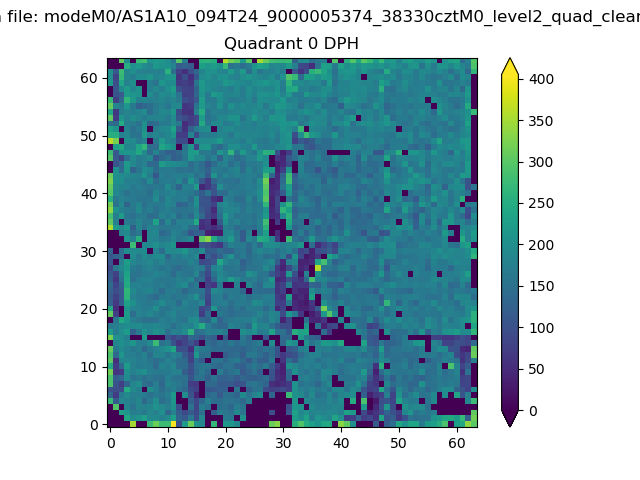 |
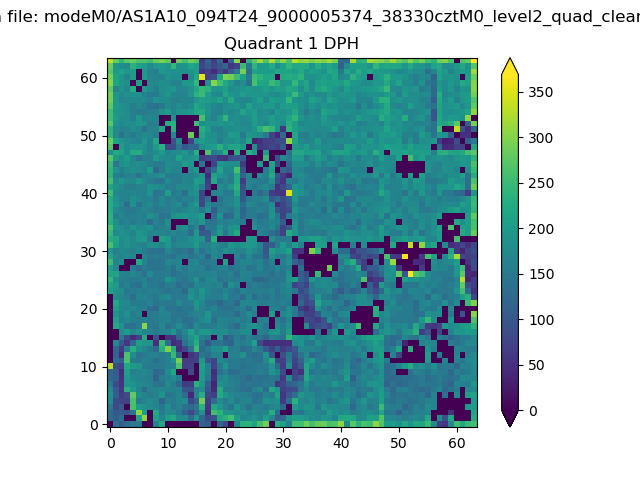 |
Quadrant B |
|---|---|---|---|
| Quadrant D | 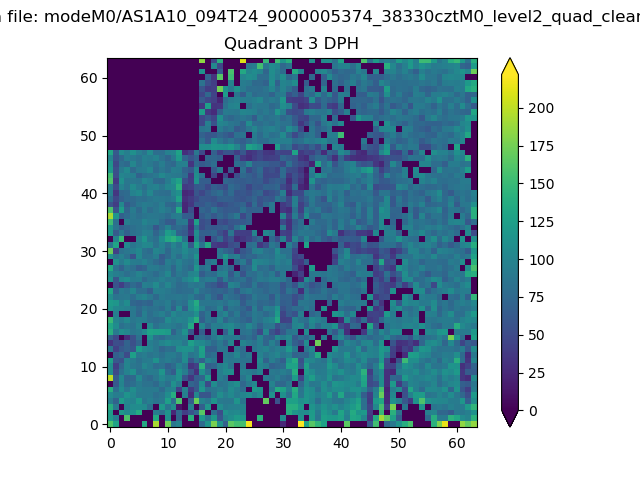 |
 |
Quadrant C |
| Plot type | Count rate plots | Images |
|---|---|---|
| Comparison with Poisson distribution Blue bars denote a histogram of data divided into 1 sec bins. Red curve is a Poisson curve with rate = median count rate of data. |
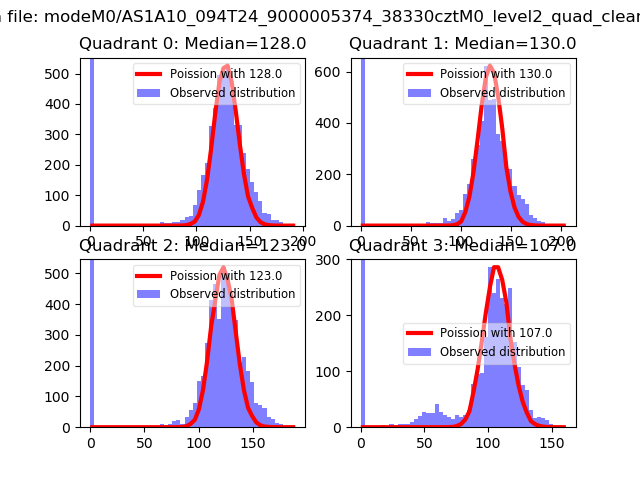 |
 |
| Quadrant-wise count rates Data is divided into 100 sec bins |
 |
|
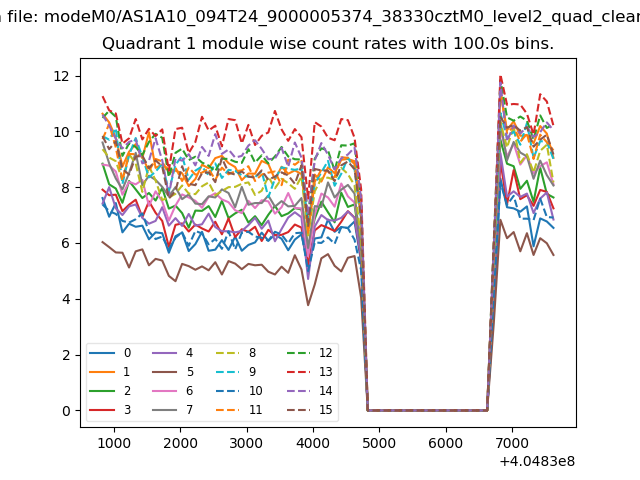
| Module-wise count rates for Quadrant A Data is divided into 100 sec bins |
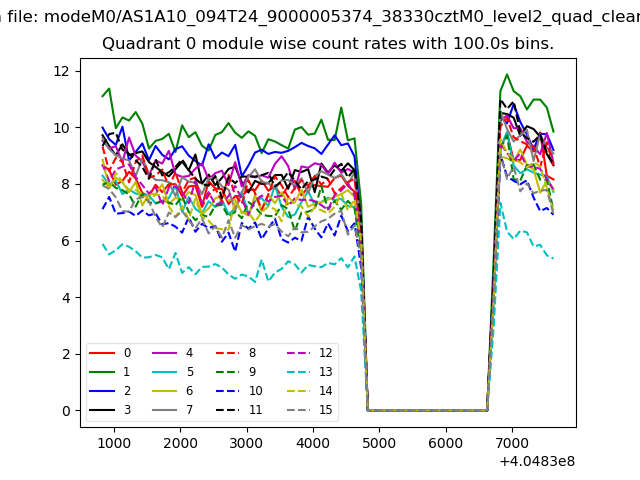 |
 |
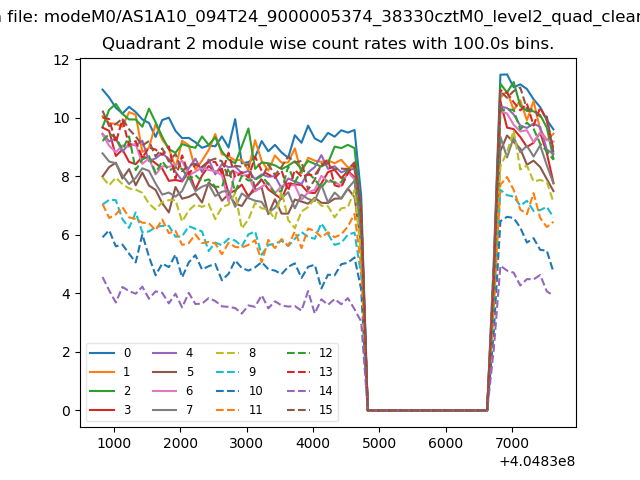
| Module-wise count rates for Quadrant B Data is divided into 100 sec bins |
 |
 |
| Module-wise count rates for Quadrant C Data is divided into 100 sec bins |
 |
 |
| Module-wise count rates for Quadrant D Data is divided into 100 sec bins |
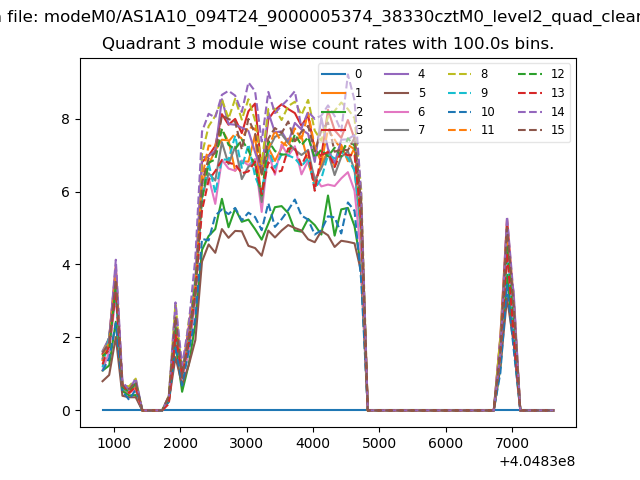 |
 |
| Parameter | Plot |
|---|---|
| CZT HV Monitor |  |
| D_VDD | 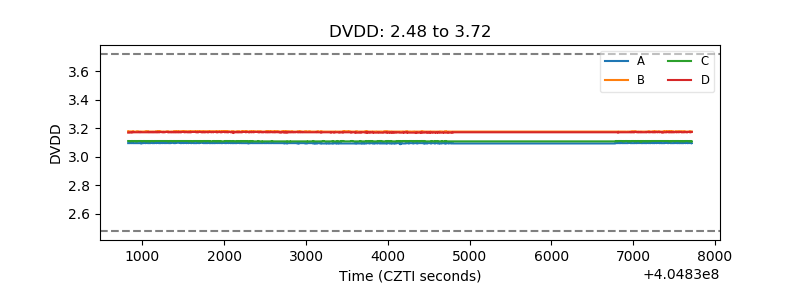 |
| Temperature 1 | 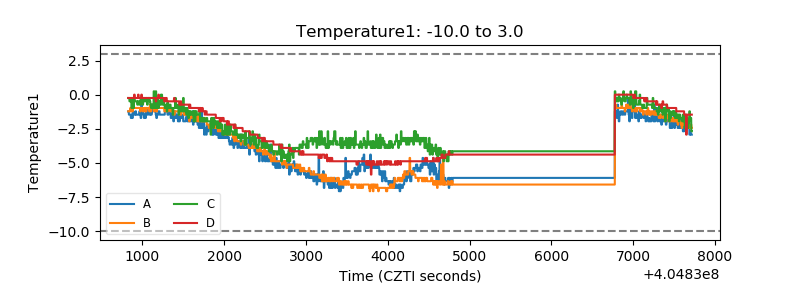 |
| Veto HV Monitor |  |
| Veto LLD | 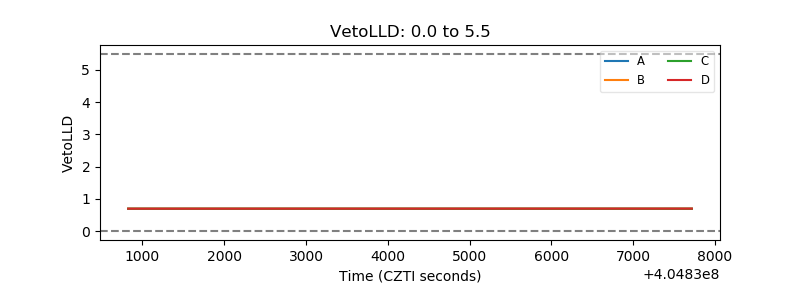 |
| Alpha Counter | 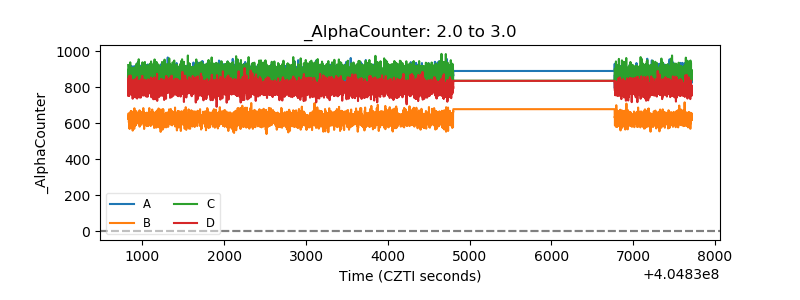 |
| _CPM_Rate | 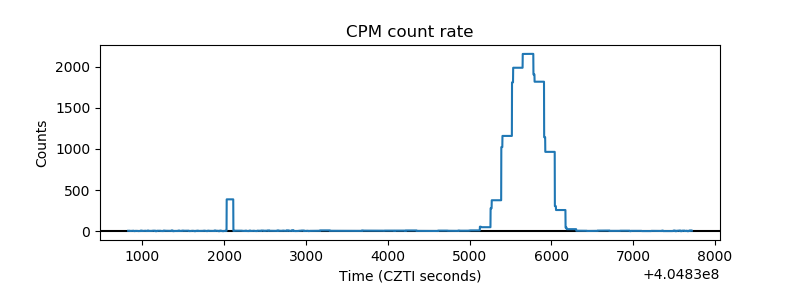 |
| CZT Counter | 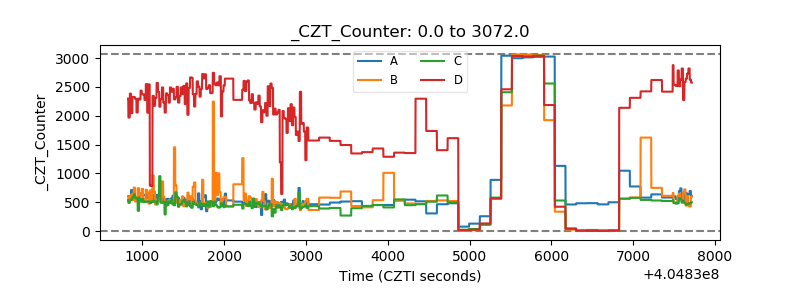 |
| +2.5 Volts monitor | 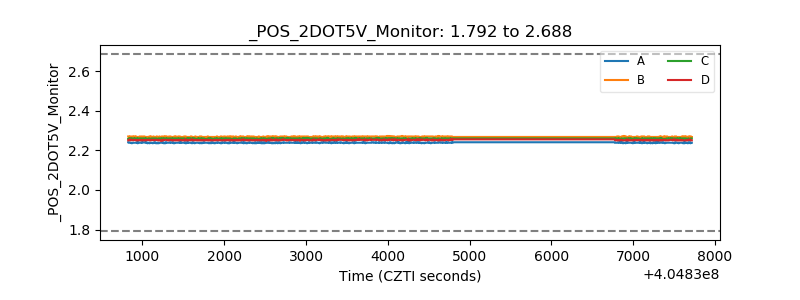 |
| +5 Volts monitor | 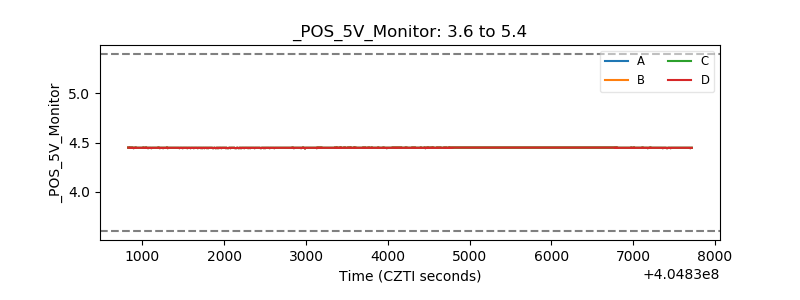 |
| _ROLL_ROT | 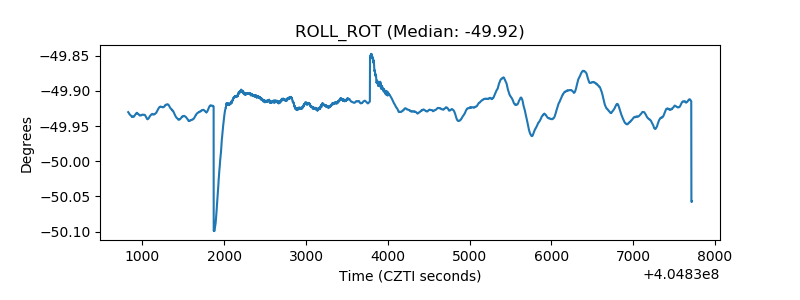 |
| _Roll_DEC | 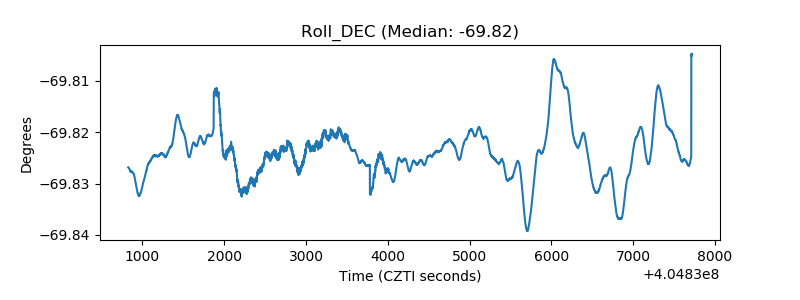 |
| _Roll_RA | 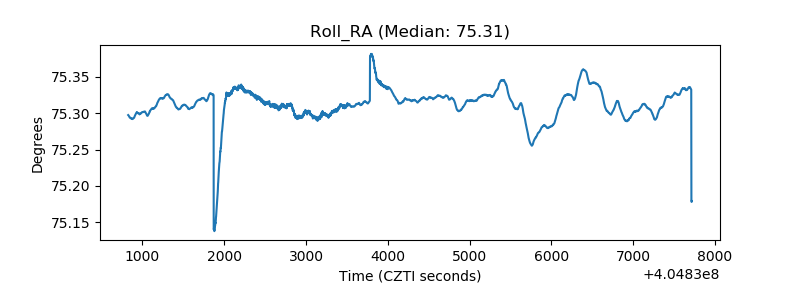 |
| Veto Counter | 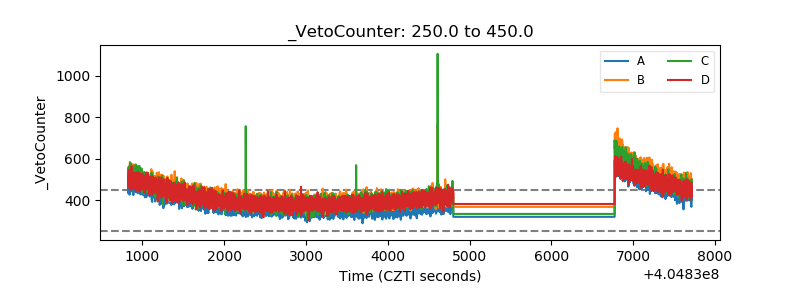 |