| Param | Original file | Final file |
|---|---|---|
| Filename | modeM0/AS1A10_094T24_9000005374_38331cztM0_level2.fits | modeM0/AS1A10_094T24_9000005374_38331cztM0_level2_quad_clean.evt |
| Size (bytes) | 515,243,520 | 91,097,280 |
| Size | 491.4 MB | 86.9 MB |
| Events in quadrant A | 3,009,500 | 681,150 |
| Events in quadrant B | 2,964,466 | 693,674 |
| Events in quadrant C | 2,657,997 | 656,253 |
| Events in quadrant D | 10,041,682 | 367,471 |
| Mode SS | |||
|---|---|---|---|
| Quadrant | BADHDUFLAG | Total packets | Discarded packets |
| A | 0 | 104 | 0 |
| B | 0 | 104 | 0 |
| C | 0 | 104 | 0 |
| D | 0 | 104 | 0 |
| Mode M0 | |||
|---|---|---|---|
| Quadrant | BADHDUFLAG | Total packets | Discarded packets |
| A | 0 | 12148 | 3 |
| B | 0 | 12119 | 2 |
| C | 0 | 10926 | 2 |
| D | 0 | 33431 | 2 |
| Mode M9 | |||
|---|---|---|---|
| Quadrant | BADHDUFLAG | Total packets | Discarded packets |
| A | 0 | 21 | 0 |
| B | 0 | 21 | 0 |
| C | 0 | 21 | 0 |
| D | 0 | 22 | 0 |
| Quadrant | Total seconds | Saturated seconds | Saturation percentage |
|---|---|---|---|
| A | 5141 | 28 | 0.544641% |
| B | 5141 | 74 | 1.439409% |
| C | 5141 | 27 | 0.525190% |
| D | 5141 | 2190 | 42.598716% |
Noise dominated data is calculated using 1-second bins in cleaned event files. If a bin has >2000 counts, and if more than 50% of those come from <1% of pixels, then it is considered to be noise-dominated and hence unusable.
| Quadrant | # 1 sec bins | Bins with >0 counts | Bins with >2000 counts | High rate bins dominated by noise | Noise dominated (total time) | Noise dominated (detector-on time) | Marked lightcurve |
|---|---|---|---|---|---|---|---|
| A | 7205 | 5142 | 12 | 12 | 0.17% | 0.23% | 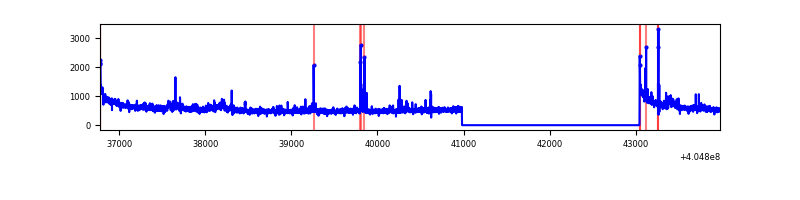 |
| B | 7205 | 5142 | 44 | 44 | 0.61% | 0.86% | 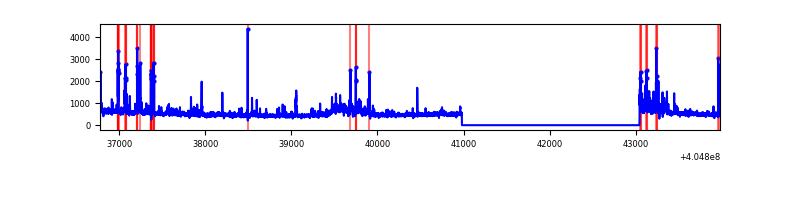 |
| C | 7205 | 5142 | 19 | 19 | 0.26% | 0.37% | 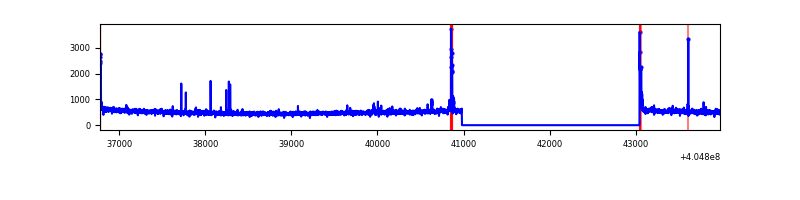 |
| D | 7205 | 5142 | 2636 | 2636 | 36.59% | 51.26% | 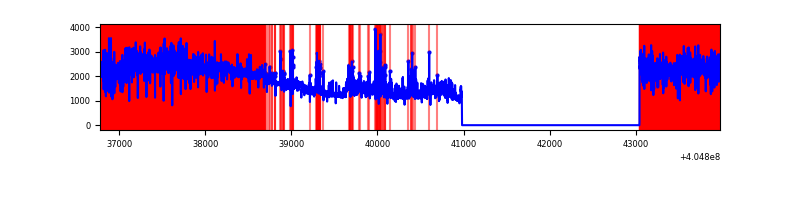 |
Top three noisy pixels from each quadrant. If the there are fewer than three noisy pixels in the level2.evt file, extra rows are filled as -1
| Pixel properties | Quadrant properties | ||||||
|---|---|---|---|---|---|---|---|
| Quadrant | DetID | PixID | Counts | Sigma | Mean | Median | Sigma |
| A | 10 | 83 | 419842 | 3350.09 | 618 | 607 | 125.1 |
| A | 12 | 189 | 74624 | 591.47 | 618 | 607 | 125.1 |
| A | 13 | 248 | 35628 | 279.85 | 618 | 607 | 125.1 |
| B | 0 | 183 | 150739 | 1324.6 | 616 | 601 | 113.3 |
| B | 0 | 229 | 116542 | 1022.9 | 616 | 601 | 113.3 |
| B | 0 | 186 | 100140 | 878.19 | 616 | 601 | 113.3 |
| C | 15 | 214 | 217236 | 1595.02 | 593 | 598 | 135.8 |
| C | 14 | 254 | 65380 | 476.96 | 593 | 598 | 135.8 |
| C | 0 | 10 | 45469 | 330.37 | 593 | 598 | 135.8 |
| D | 10 | 203 | 5794593 | 46003.13 | 519 | 505 | 125.9 |
| D | 2 | 16 | 942962 | 7482.8 | 519 | 505 | 125.9 |
| D | 1 | 20 | 696893 | 5529.09 | 519 | 505 | 125.9 |
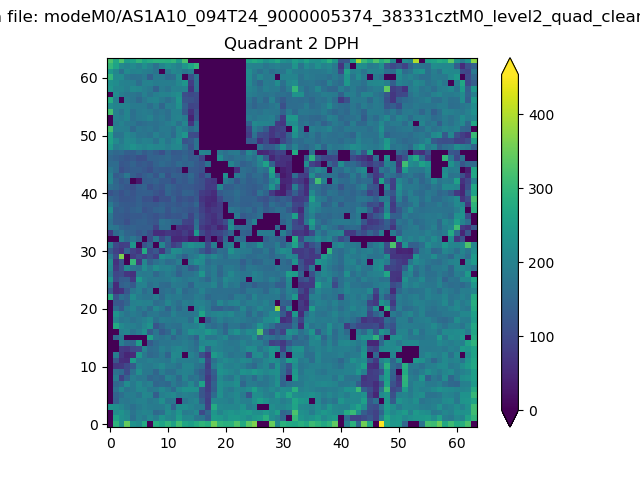
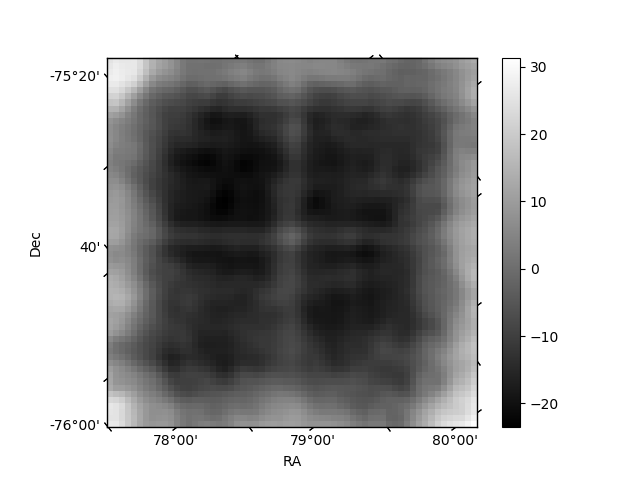
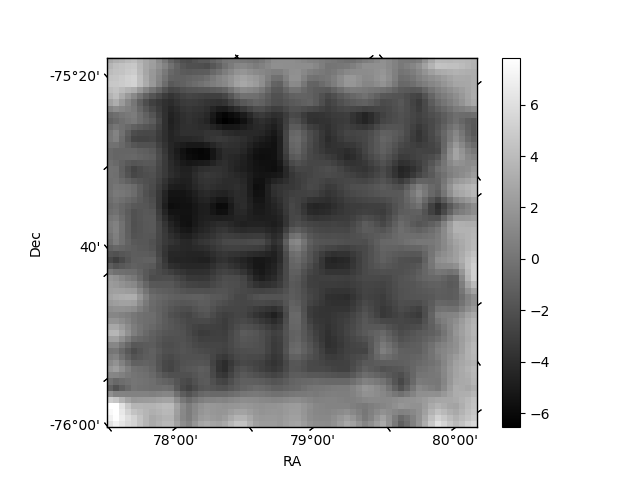
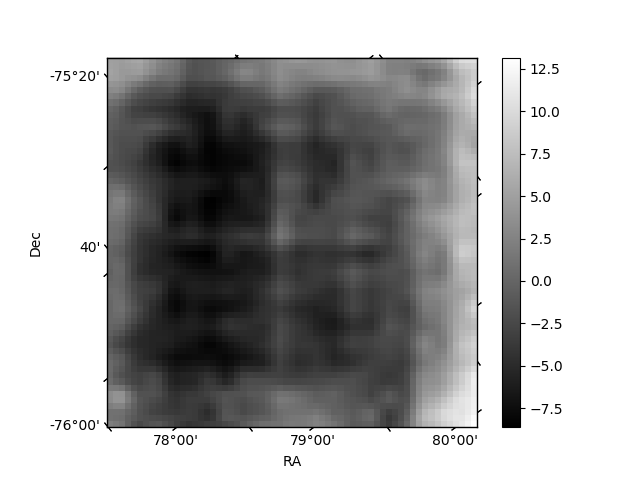
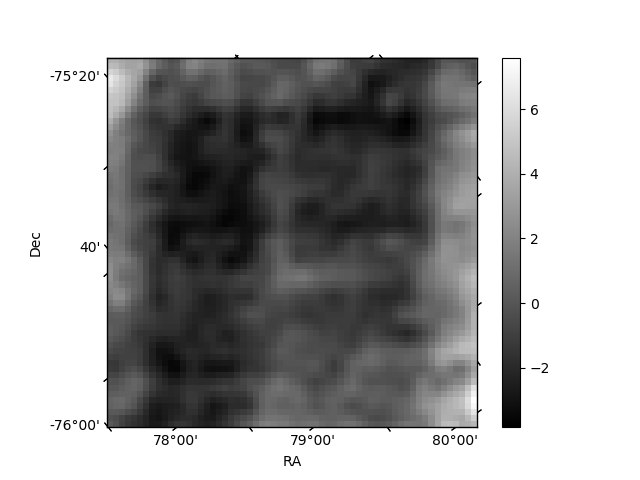
Histogram calculated using DETX and DETY for each event in the final _common_clean file
| Quadrant A | 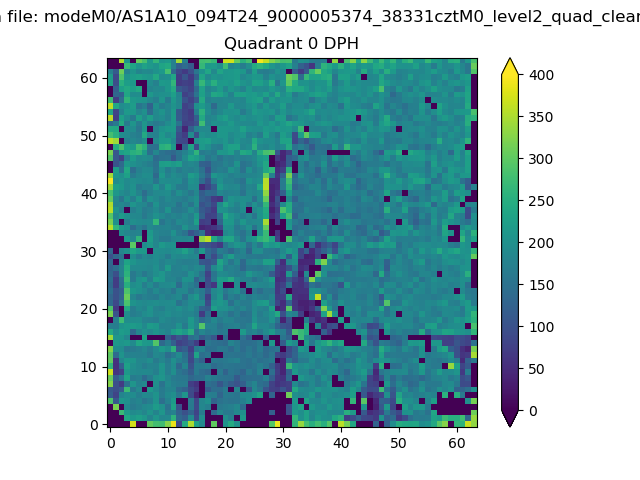 |
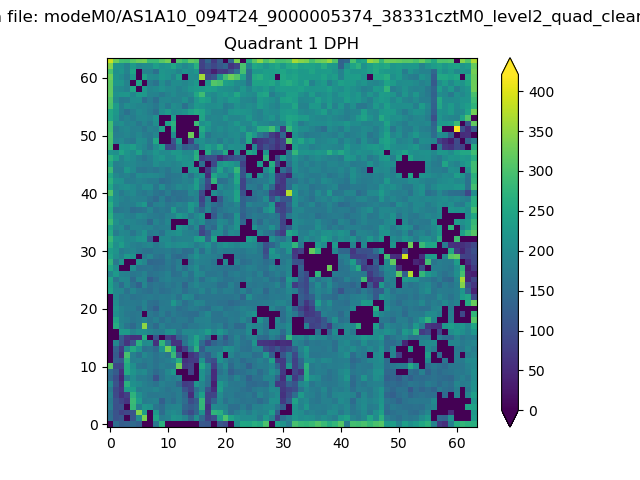 |
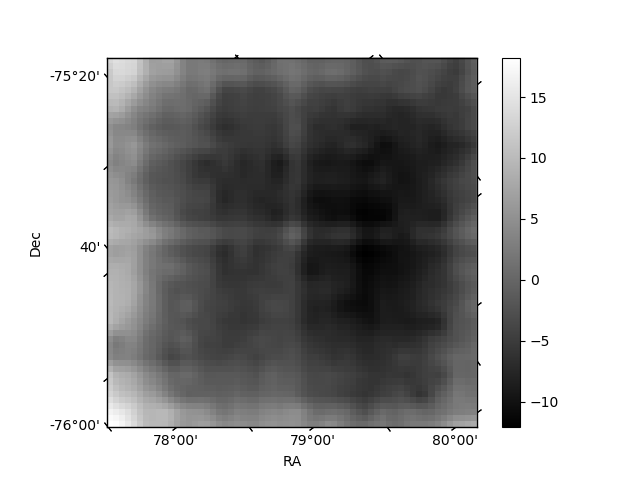
Quadrant B |
|---|---|---|---|
| Quadrant D | 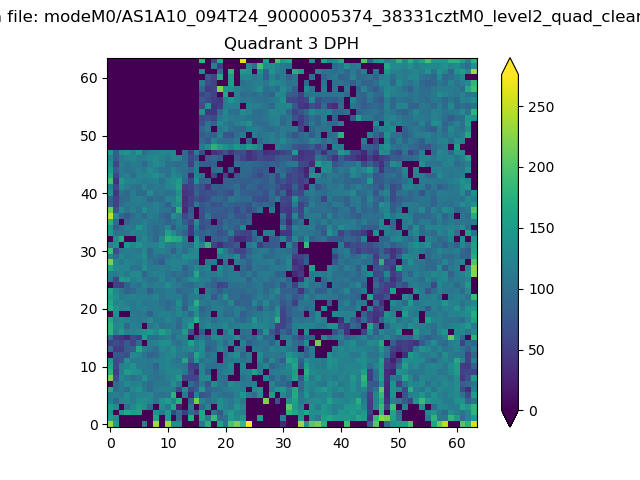 |
 |
Quadrant C |
| Plot type | Count rate plots | Images |
|---|---|---|
| Comparison with Poisson distribution Blue bars denote a histogram of data divided into 1 sec bins. Red curve is a Poisson curve with rate = median count rate of data. |
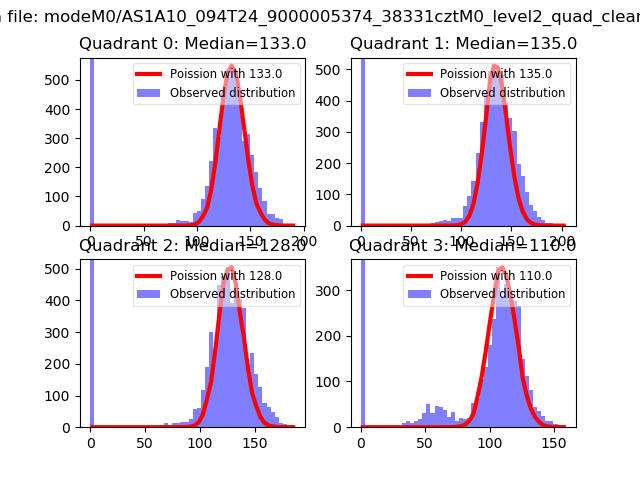 |
 |
| Quadrant-wise count rates Data is divided into 100 sec bins |
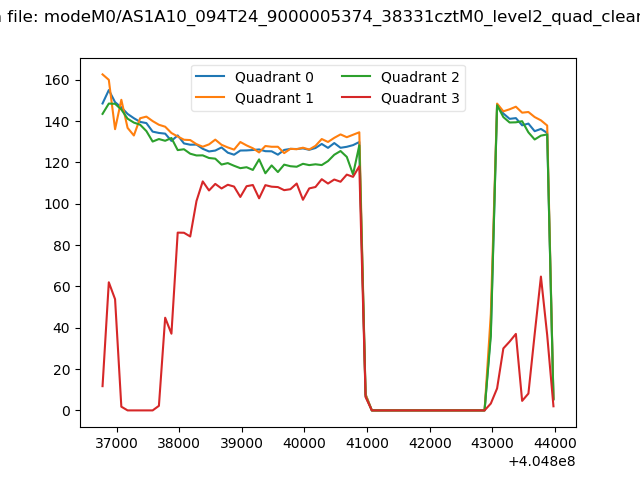 |
|
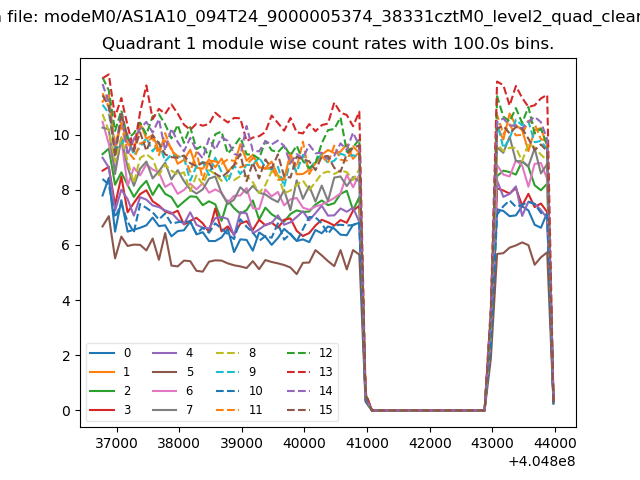
| Module-wise count rates for Quadrant A Data is divided into 100 sec bins |
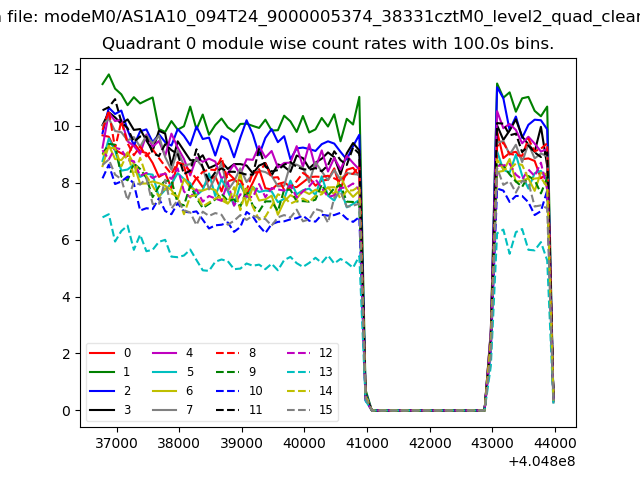 |
 |
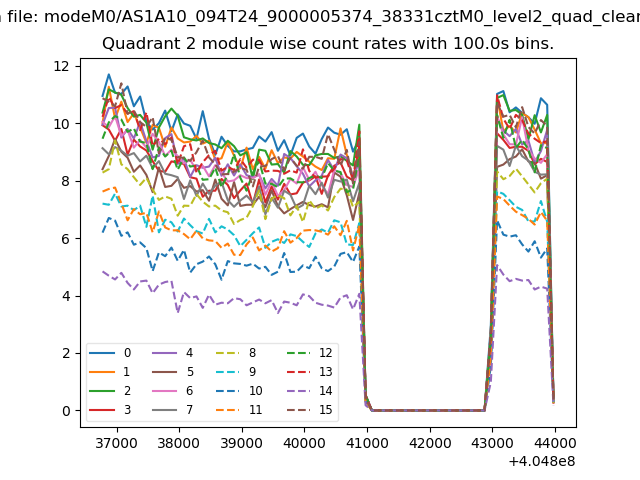
| Module-wise count rates for Quadrant B Data is divided into 100 sec bins |
 |
 |
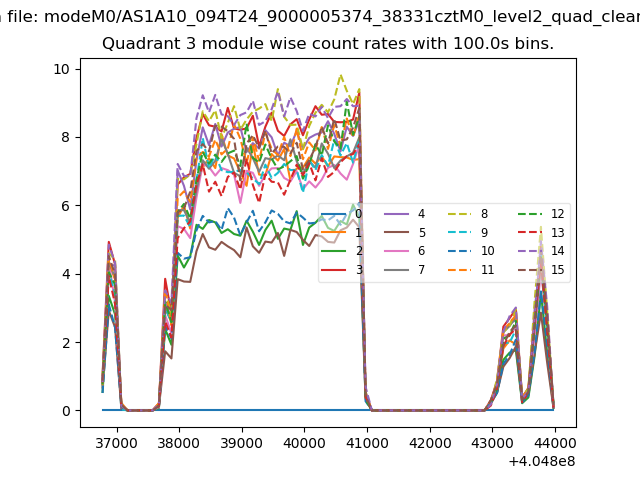
| Module-wise count rates for Quadrant C Data is divided into 100 sec bins |
 |
 |
| Module-wise count rates for Quadrant D Data is divided into 100 sec bins |
 |
 |
| Parameter | Plot |
|---|---|
| CZT HV Monitor | 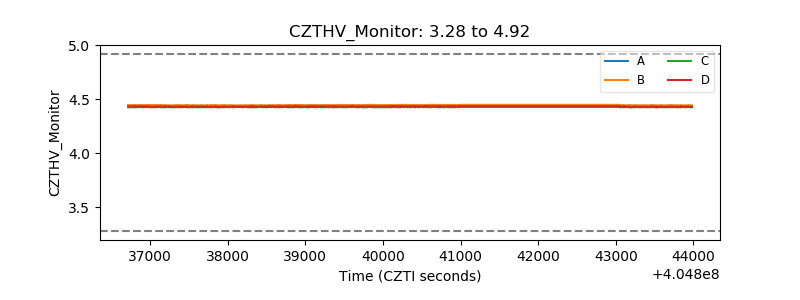 |
| D_VDD | 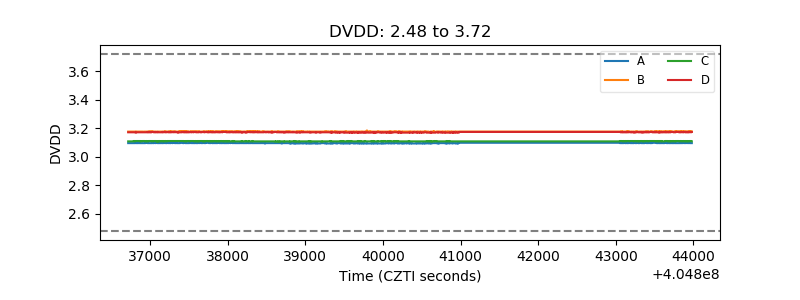 |
| Temperature 1 | 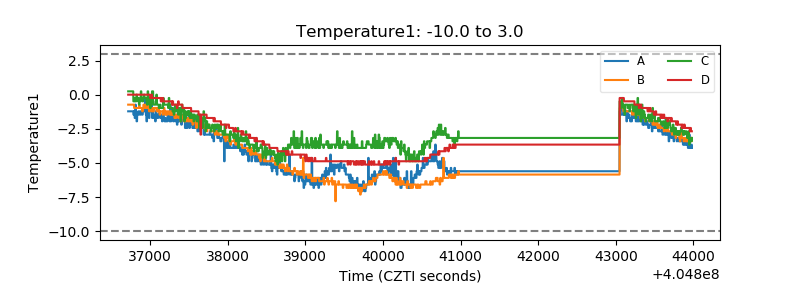 |
| Veto HV Monitor | 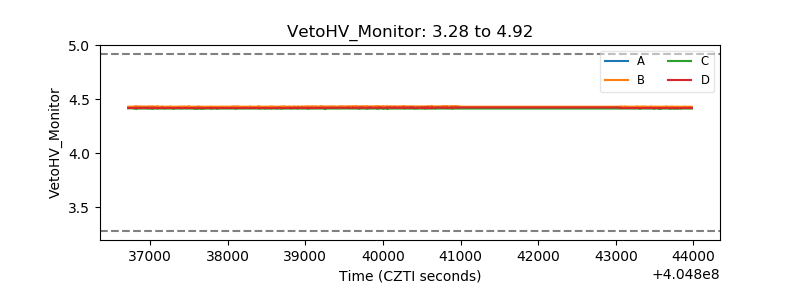 |
| Veto LLD | 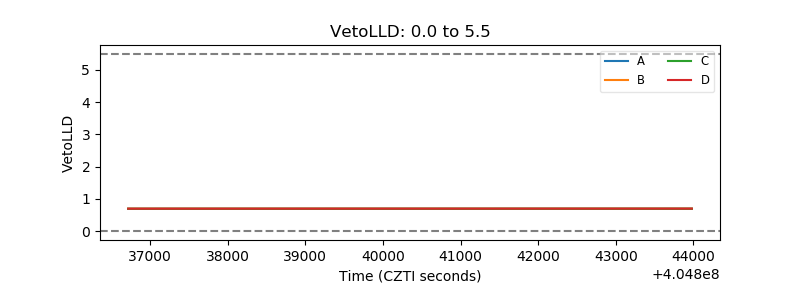 |
| Alpha Counter | 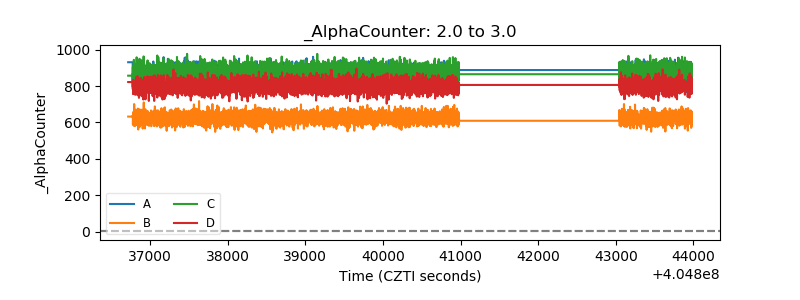 |
| _CPM_Rate | 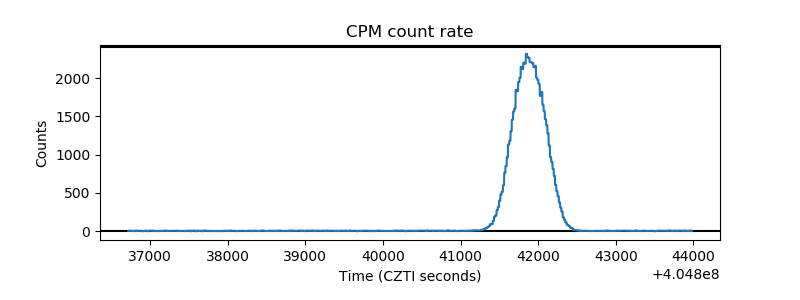 |
| CZT Counter | 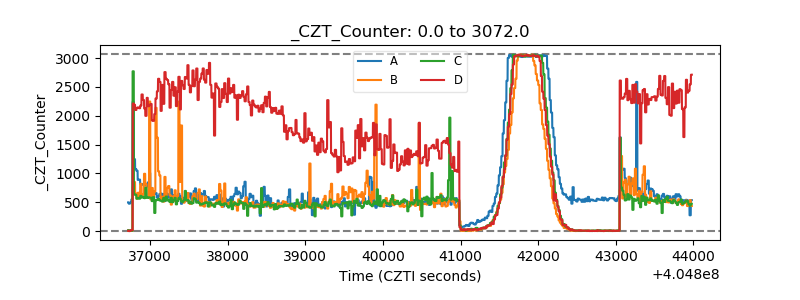 |
| +2.5 Volts monitor | 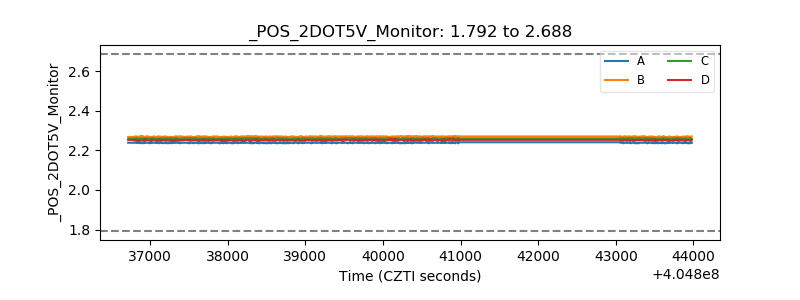 |
| +5 Volts monitor |  |
| _ROLL_ROT | 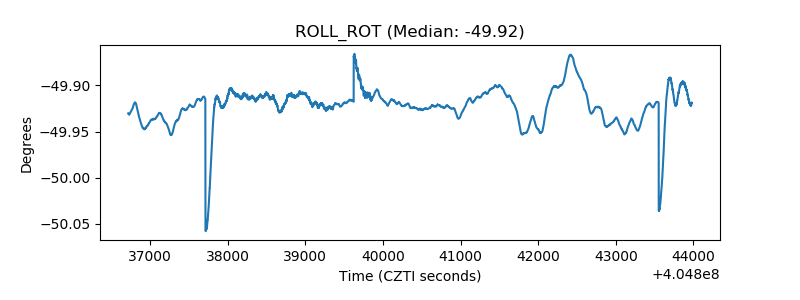 |
| _Roll_DEC | 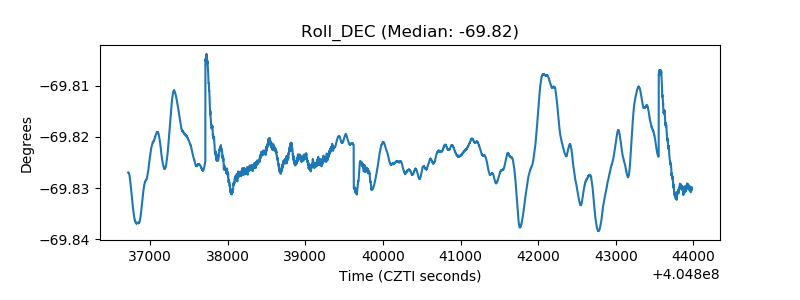 |
| _Roll_RA | 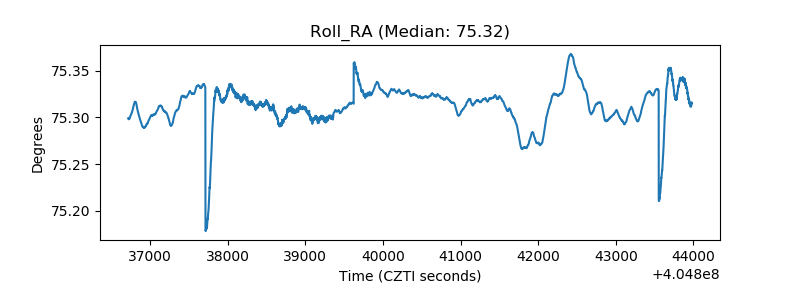 |
| Veto Counter | 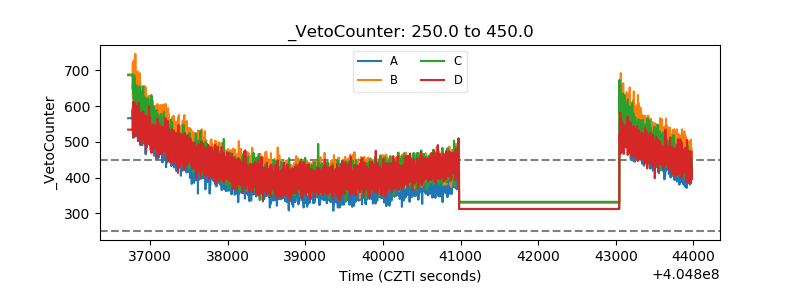 |