| Param | Original file | Final file |
|---|---|---|
| Filename | modeM0/AS1A10_094T24_9000005374_38332cztM0_level2.fits | modeM0/AS1A10_094T24_9000005374_38332cztM0_level2_quad_clean.evt |
| Size (bytes) | 460,359,360 | 88,081,920 |
| Size | 439.0 MB | 84.0 MB |
| Events in quadrant A | 2,806,056 | 632,932 |
| Events in quadrant B | 2,690,740 | 651,296 |
| Events in quadrant C | 2,444,499 | 612,001 |
| Events in quadrant D | 8,719,617 | 427,515 |
| Mode SS | |||
|---|---|---|---|
| Quadrant | BADHDUFLAG | Total packets | Discarded packets |
| A | 0 | 100 | 0 |
| B | 0 | 100 | 0 |
| C | 0 | 100 | 0 |
| D | 0 | 100 | 0 |
| Mode M0 | |||
|---|---|---|---|
| Quadrant | BADHDUFLAG | Total packets | Discarded packets |
| A | 0 | 11364 | 3 |
| B | 0 | 11029 | 2 |
| C | 0 | 10155 | 2 |
| D | 0 | 29287 | 2 |
| Mode M9 | |||
|---|---|---|---|
| Quadrant | BADHDUFLAG | Total packets | Discarded packets |
| A | 0 | 27 | 0 |
| B | 0 | 27 | 0 |
| C | 0 | 27 | 0 |
| D | 0 | 28 | 0 |
| Quadrant | Total seconds | Saturated seconds | Saturation percentage |
|---|---|---|---|
| A | 4896 | 29 | 0.592320% |
| B | 4896 | 42 | 0.857843% |
| C | 4896 | 14 | 0.285948% |
| D | 4896 | 1436 | 29.330065% |
Noise dominated data is calculated using 1-second bins in cleaned event files. If a bin has >2000 counts, and if more than 50% of those come from <1% of pixels, then it is considered to be noise-dominated and hence unusable.
| Quadrant | # 1 sec bins | Bins with >0 counts | Bins with >2000 counts | High rate bins dominated by noise | Noise dominated (total time) | Noise dominated (detector-on time) | Marked lightcurve |
|---|---|---|---|---|---|---|---|
| A | 7049 | 4897 | 12 | 12 | 0.17% | 0.25% | 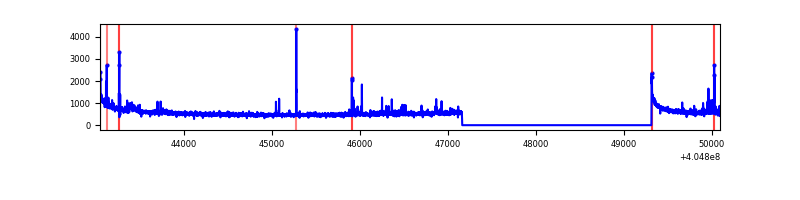 |
| B | 7049 | 4897 | 20 | 20 | 0.28% | 0.41% | 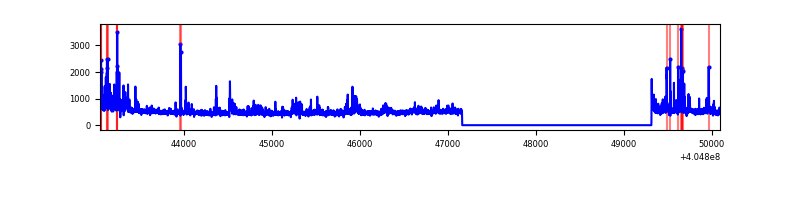 |
| C | 7049 | 4897 | 9 | 9 | 0.13% | 0.18% | 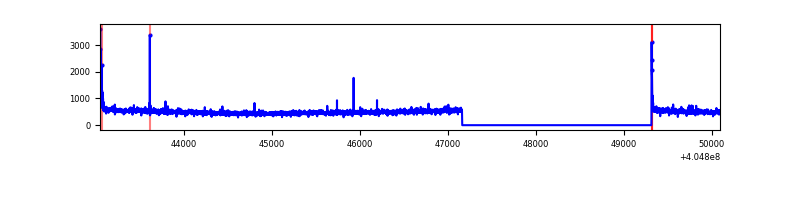 |
| D | 7049 | 4897 | 2075 | 2075 | 29.44% | 42.37% | 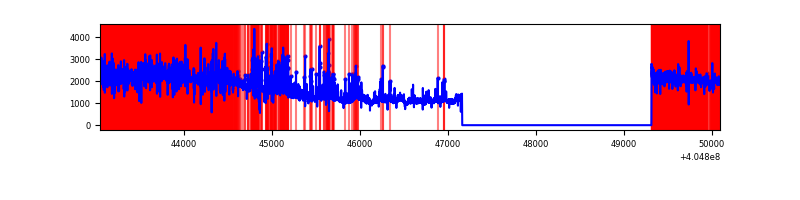 |
Top three noisy pixels from each quadrant. If the there are fewer than three noisy pixels in the level2.evt file, extra rows are filled as -1
| Pixel properties | Quadrant properties | ||||||
|---|---|---|---|---|---|---|---|
| Quadrant | DetID | PixID | Counts | Sigma | Mean | Median | Sigma |
| A | 10 | 83 | 409278 | 3580.47 | 573 | 563 | 114.2 |
| A | 13 | 248 | 72928 | 633.94 | 573 | 563 | 114.2 |
| A | 12 | 189 | 53449 | 463.3 | 573 | 563 | 114.2 |
| B | 0 | 183 | 132720 | 1232.31 | 576 | 563 | 107.2 |
| B | 0 | 229 | 98930 | 917.23 | 576 | 563 | 107.2 |
| B | 0 | 186 | 67951 | 628.36 | 576 | 563 | 107.2 |
| C | 15 | 214 | 208444 | 1637.09 | 555 | 560 | 127.0 |
| C | 0 | 10 | 42336 | 328.99 | 555 | 560 | 127.0 |
| C | 14 | 254 | 11348 | 84.96 | 555 | 560 | 127.0 |
| D | 10 | 203 | 5310227 | 42076.3 | 516 | 501 | 126.2 |
| D | 2 | 16 | 783199 | 6202.4 | 516 | 501 | 126.2 |
| D | 2 | 250 | 239556 | 1894.36 | 516 | 501 | 126.2 |
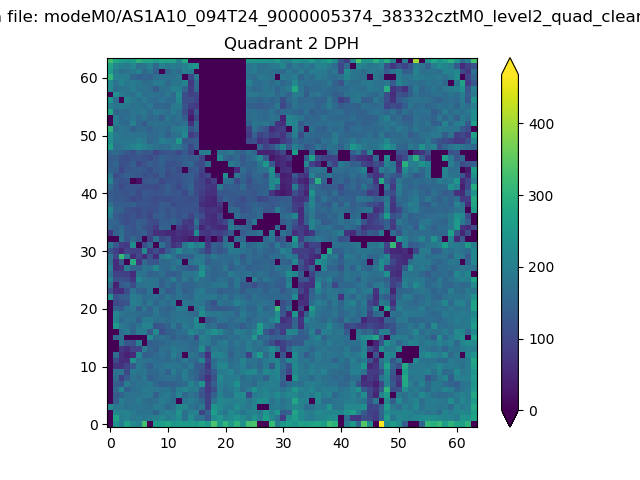
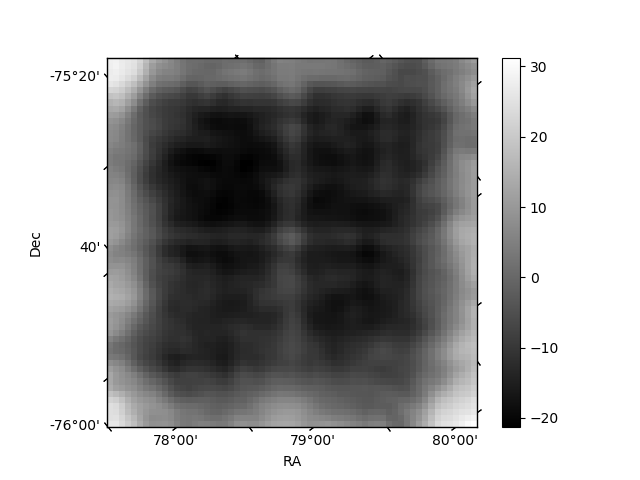
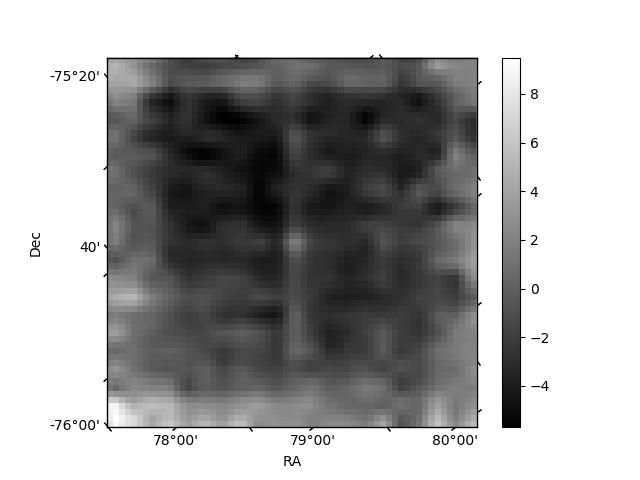
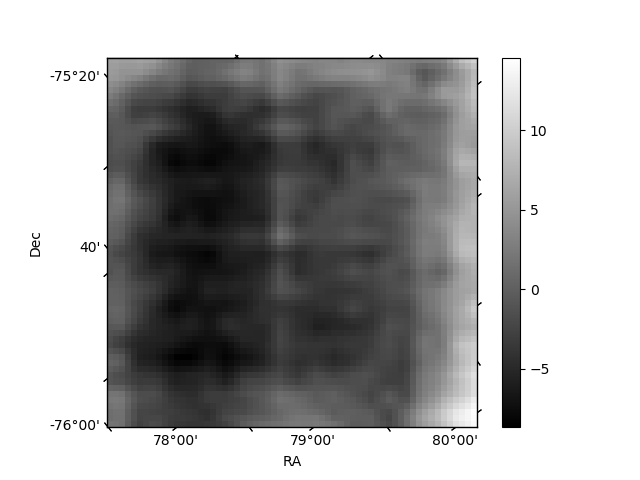
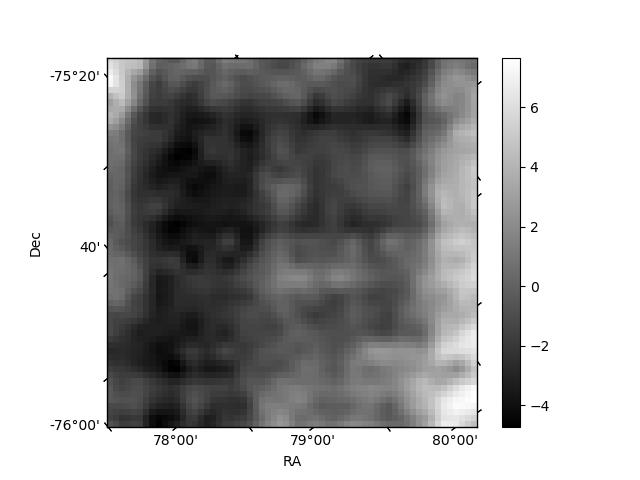
Histogram calculated using DETX and DETY for each event in the final _common_clean file
| Quadrant A | 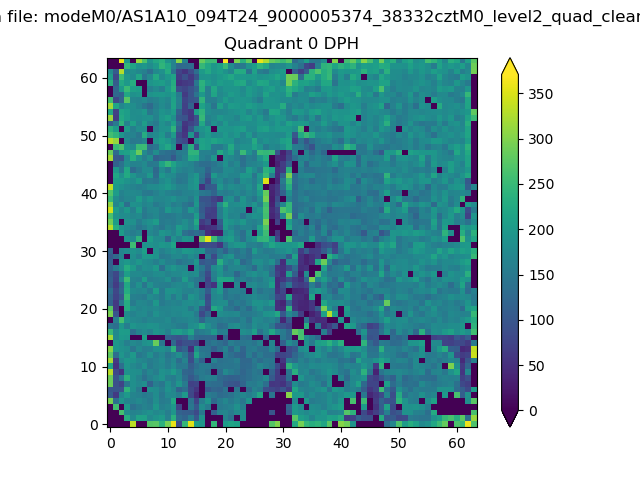 |
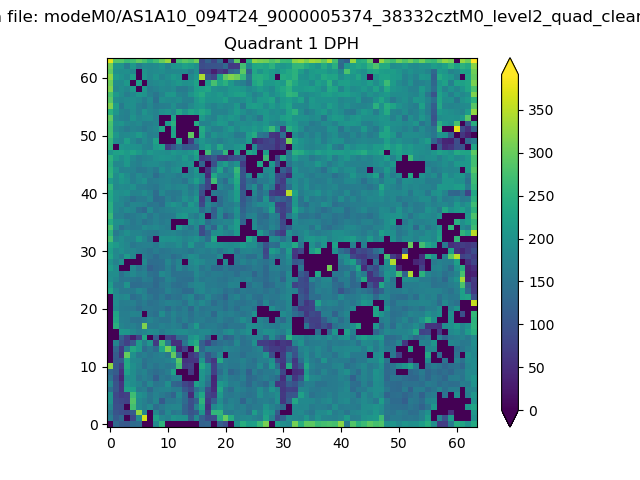 |
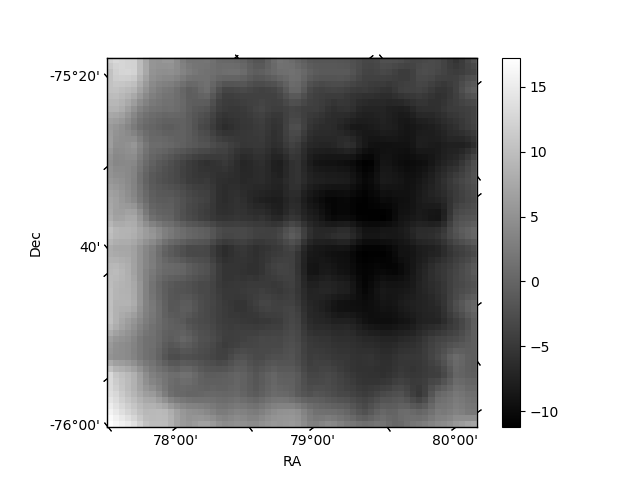
Quadrant B |
|---|---|---|---|
| Quadrant D | 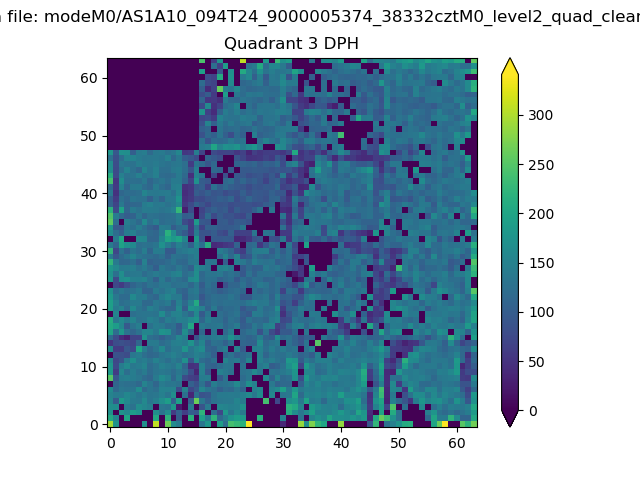 |
 |
Quadrant C |
| Plot type | Count rate plots | Images |
|---|---|---|
| Comparison with Poisson distribution Blue bars denote a histogram of data divided into 1 sec bins. Red curve is a Poisson curve with rate = median count rate of data. |
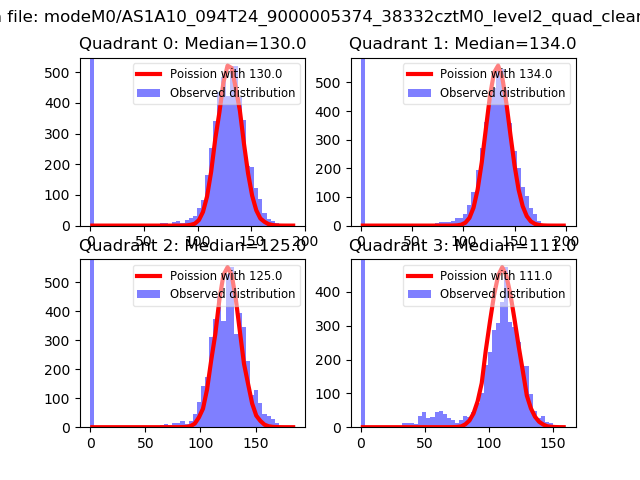 |
 |
| Quadrant-wise count rates Data is divided into 100 sec bins |
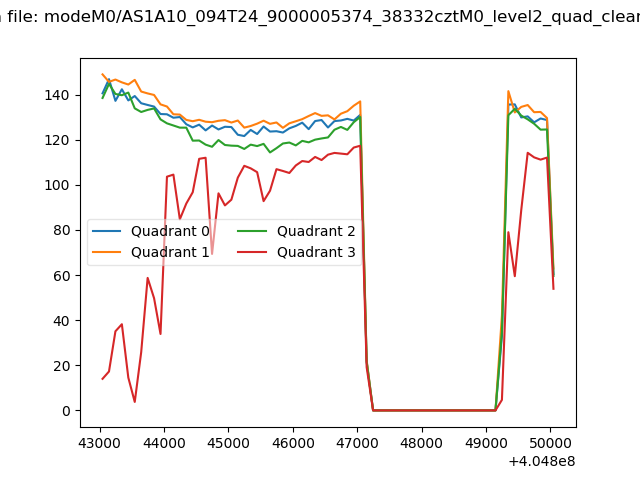 |
|
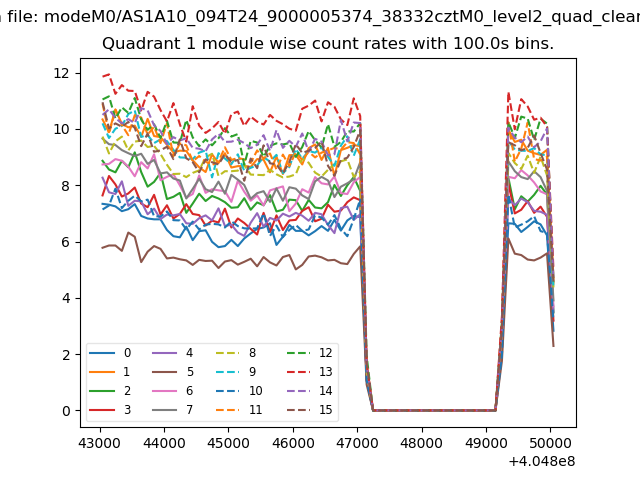
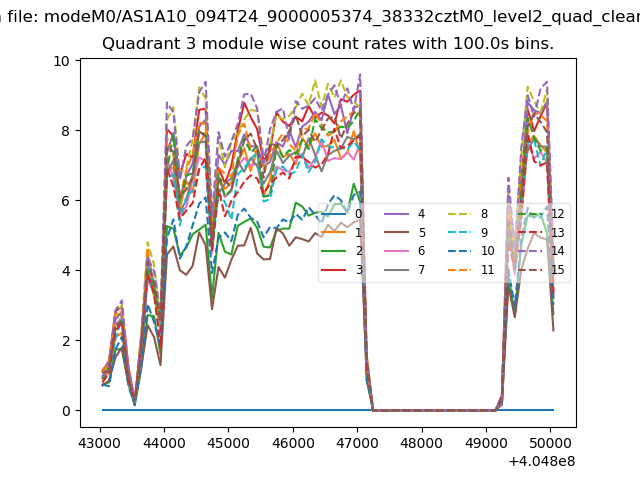
| Module-wise count rates for Quadrant A Data is divided into 100 sec bins |
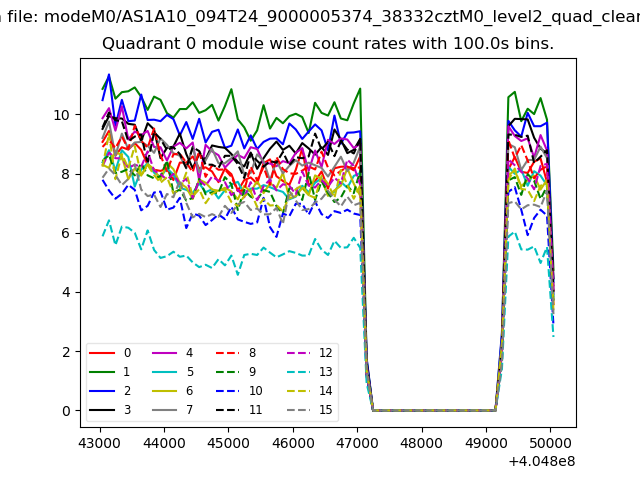 |
 |
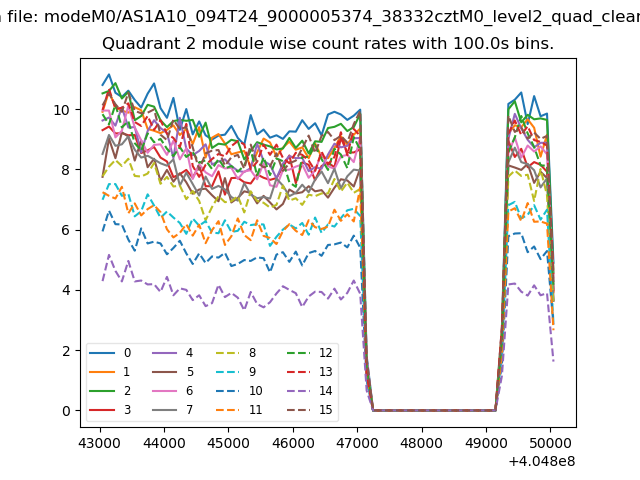
| Module-wise count rates for Quadrant B Data is divided into 100 sec bins |
 |
 |
| Module-wise count rates for Quadrant C Data is divided into 100 sec bins |
 |
 |
| Module-wise count rates for Quadrant D Data is divided into 100 sec bins |
 |
 |
| Parameter | Plot |
|---|---|
| CZT HV Monitor | 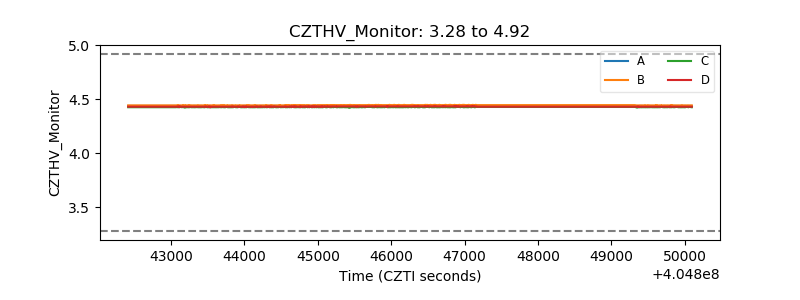 |
| D_VDD | 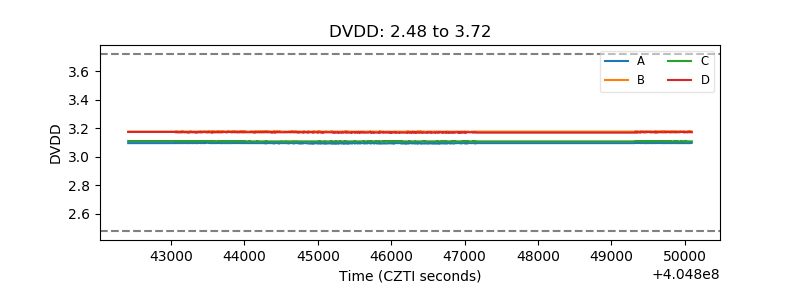 |
| Temperature 1 | 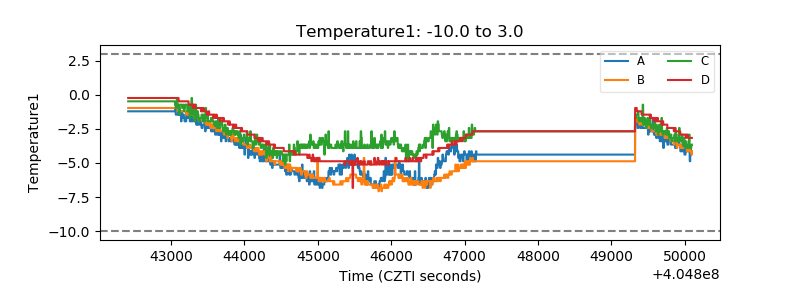 |
| Veto HV Monitor | 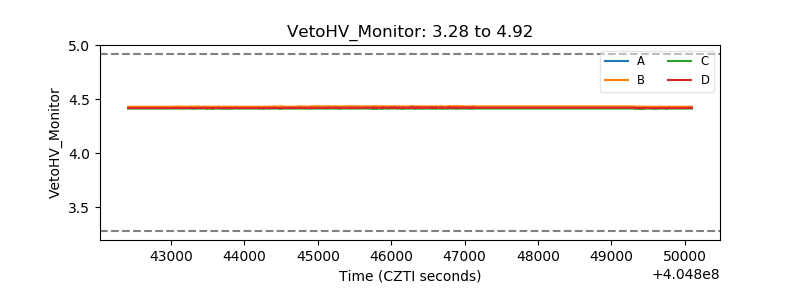 |
| Veto LLD | 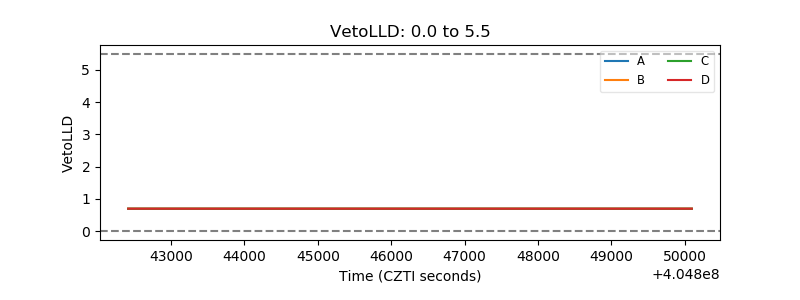 |
| Alpha Counter | 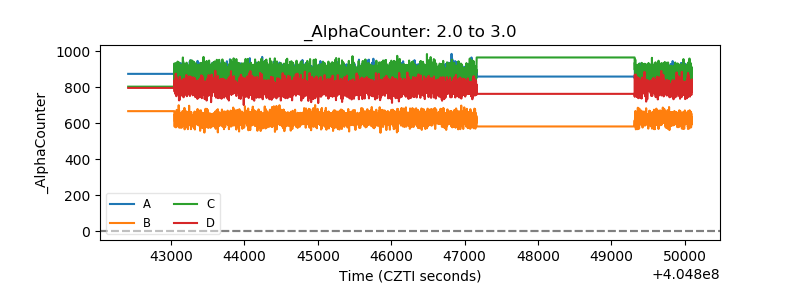 |
| _CPM_Rate | 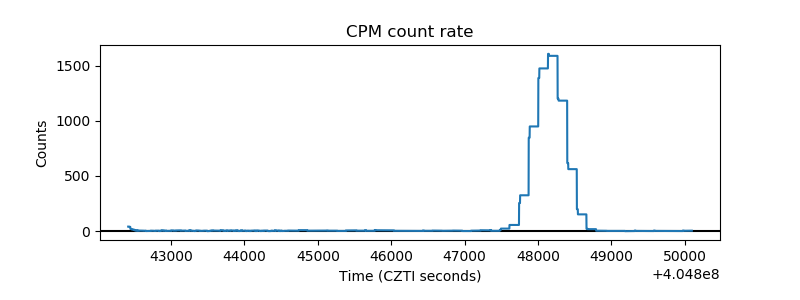 |
| CZT Counter | 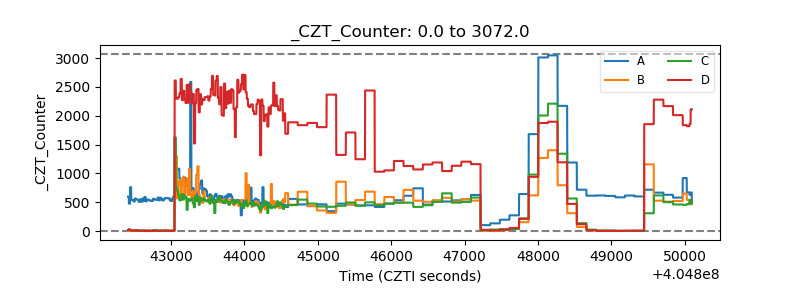 |
| +2.5 Volts monitor |  |
| +5 Volts monitor | 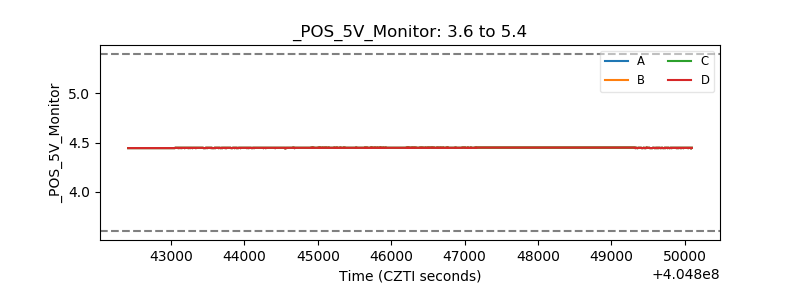 |
| _ROLL_ROT | 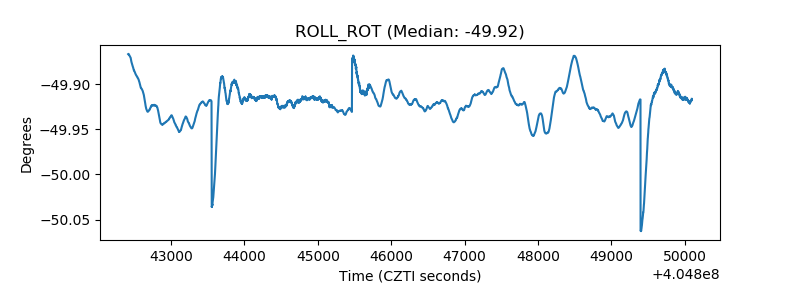 |
| _Roll_DEC | 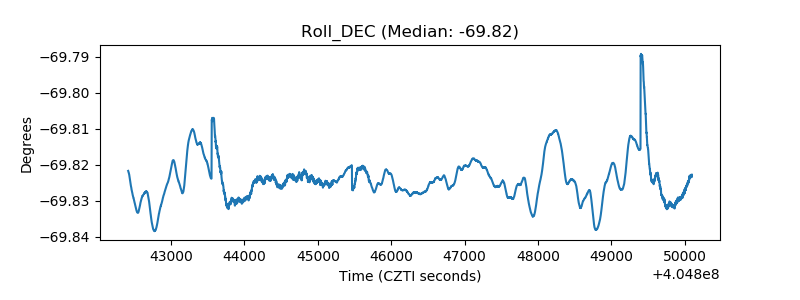 |
| _Roll_RA | 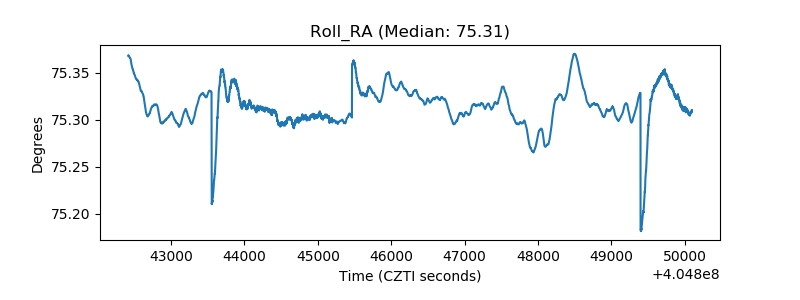 |
| Veto Counter | 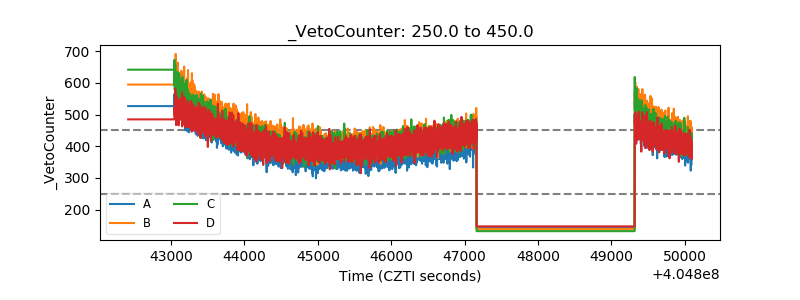 |