| Param | Original file | Final file |
|---|---|---|
| Filename | modeM0/AS1A10_094T24_9000005374_38333cztM0_level2.fits | modeM0/AS1A10_094T24_9000005374_38333cztM0_level2_quad_clean.evt |
| Size (bytes) | 448,954,560 | 85,242,240 |
| Size | 428.2 MB | 81.3 MB |
| Events in quadrant A | 2,771,456 | 601,665 |
| Events in quadrant B | 2,555,288 | 616,005 |
| Events in quadrant C | 2,377,388 | 581,911 |
| Events in quadrant D | 8,534,658 | 437,531 |
| Mode SS | |||
|---|---|---|---|
| Quadrant | BADHDUFLAG | Total packets | Discarded packets |
| A | 0 | 102 | 0 |
| B | 0 | 102 | 0 |
| C | 0 | 102 | 0 |
| D | 0 | 102 | 0 |
| Mode M0 | |||
|---|---|---|---|
| Quadrant | BADHDUFLAG | Total packets | Discarded packets |
| A | 0 | 11280 | 3 |
| B | 0 | 10714 | 2 |
| C | 0 | 10065 | 2 |
| D | 0 | 28751 | 2 |
| Mode M9 | |||
|---|---|---|---|
| Quadrant | BADHDUFLAG | Total packets | Discarded packets |
| A | 0 | 31 | 0 |
| B | 0 | 31 | 0 |
| C | 0 | 31 | 0 |
| D | 0 | 32 | 0 |
| Quadrant | Total seconds | Saturated seconds | Saturation percentage |
|---|---|---|---|
| A | 4896 | 33 | 0.674020% |
| B | 4896 | 33 | 0.674020% |
| C | 4896 | 12 | 0.245098% |
| D | 4896 | 1200 | 24.509804% |
Noise dominated data is calculated using 1-second bins in cleaned event files. If a bin has >2000 counts, and if more than 50% of those come from <1% of pixels, then it is considered to be noise-dominated and hence unusable.
| Quadrant | # 1 sec bins | Bins with >0 counts | Bins with >2000 counts | High rate bins dominated by noise | Noise dominated (total time) | Noise dominated (detector-on time) | Marked lightcurve |
|---|---|---|---|---|---|---|---|
| A | 7050 | 4897 | 27 | 27 | 0.38% | 0.55% | 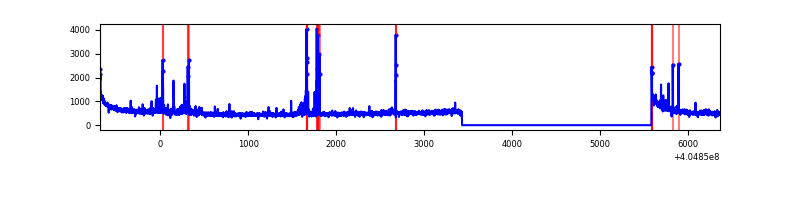 |
| B | 7050 | 4897 | 17 | 17 | 0.24% | 0.35% | 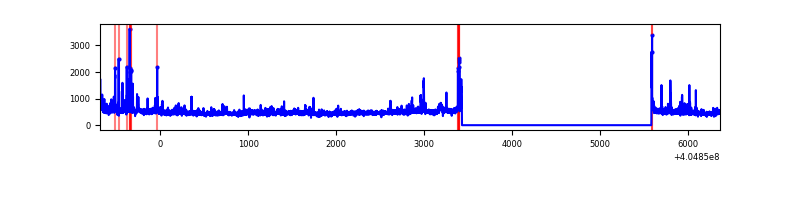 |
| C | 7050 | 4897 | 5 | 5 | 0.07% | 0.10% | 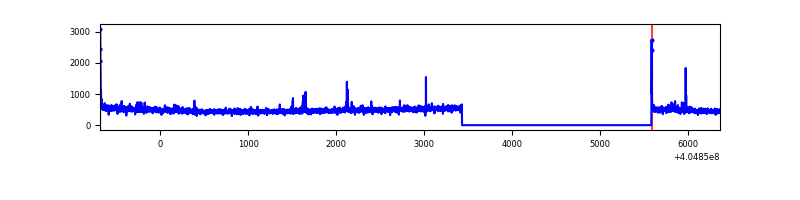 |
| D | 7050 | 4897 | 1747 | 1747 | 24.78% | 35.67% | 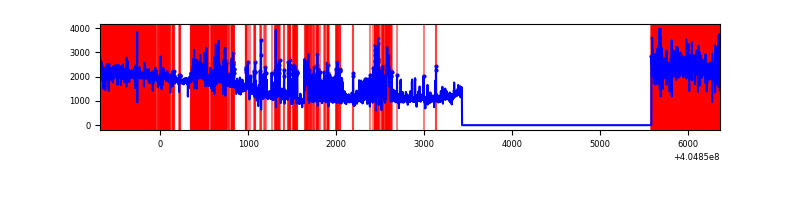 |
Top three noisy pixels from each quadrant. If the there are fewer than three noisy pixels in the level2.evt file, extra rows are filled as -1
| Pixel properties | Quadrant properties | ||||||
|---|---|---|---|---|---|---|---|
| Quadrant | DetID | PixID | Counts | Sigma | Mean | Median | Sigma |
| A | 10 | 83 | 397004 | 3568.4 | 546 | 536 | 111.1 |
| A | 9 | 143 | 79521 | 710.9 | 546 | 536 | 111.1 |
| A | 12 | 189 | 75752 | 676.98 | 546 | 536 | 111.1 |
| B | 0 | 183 | 250499 | 2389.59 | 554 | 539 | 104.6 |
| B | 0 | 229 | 42116 | 397.47 | 554 | 539 | 104.6 |
| B | 0 | 213 | 25036 | 234.19 | 554 | 539 | 104.6 |
| C | 15 | 214 | 207635 | 1661.46 | 536 | 540 | 124.6 |
| C | 0 | 10 | 26748 | 210.26 | 536 | 540 | 124.6 |
| C | 14 | 254 | 17285 | 134.34 | 536 | 540 | 124.6 |
| D | 10 | 203 | 4911129 | 40316.29 | 498 | 484 | 121.8 |
| D | 2 | 16 | 944682 | 7751.84 | 498 | 484 | 121.8 |
| D | 2 | 250 | 204275 | 1673.12 | 498 | 484 | 121.8 |
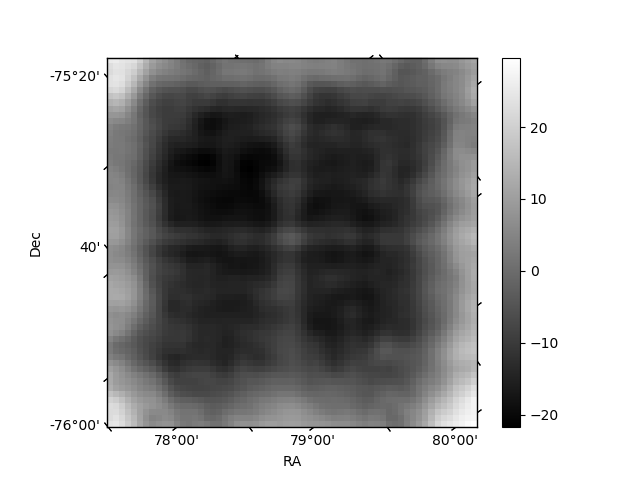
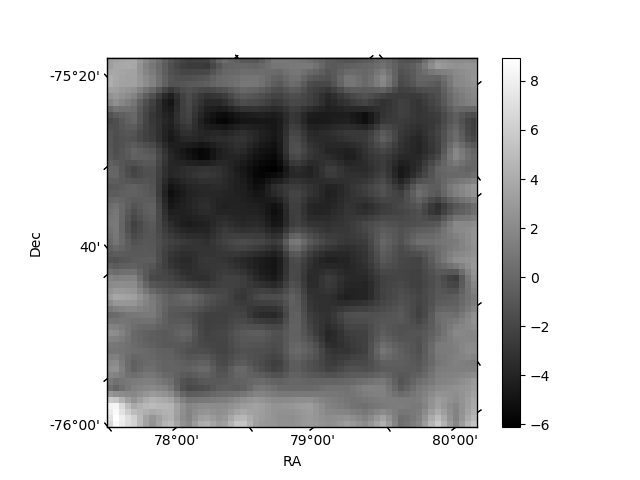
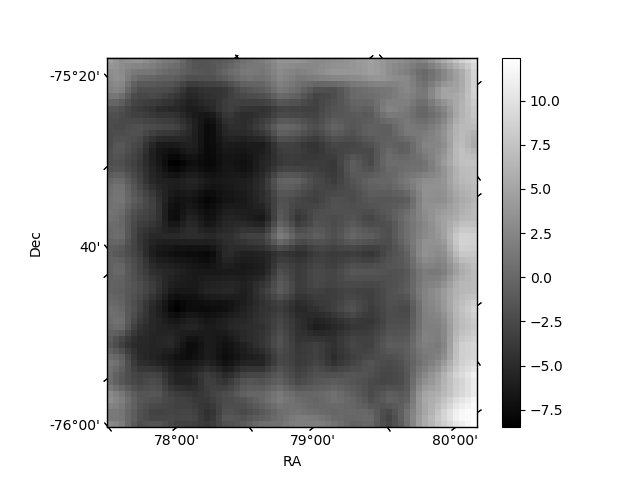
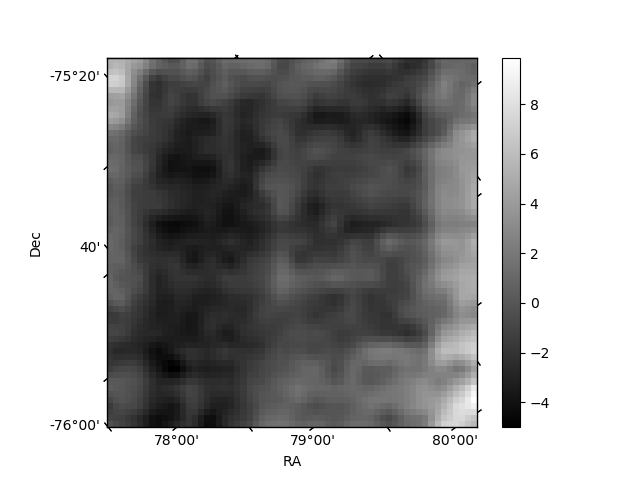
Histogram calculated using DETX and DETY for each event in the final _common_clean file
| Quadrant A | 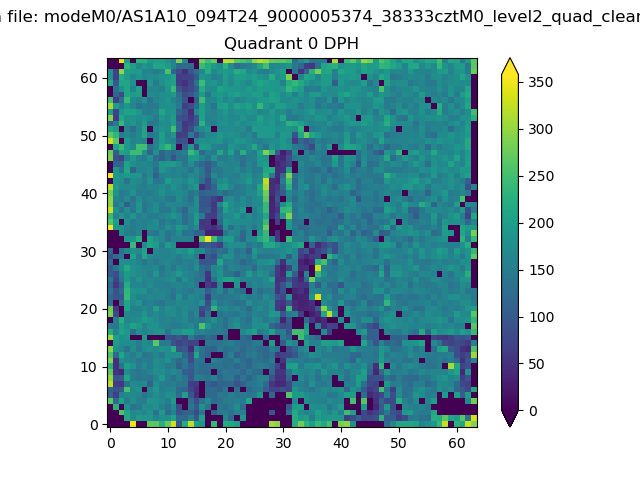 |
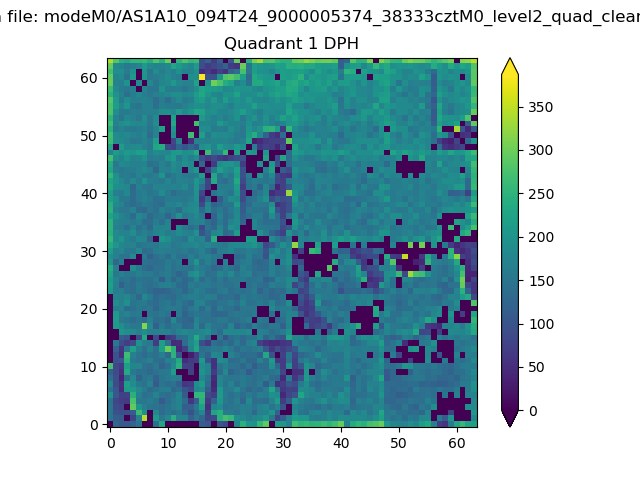 |
Quadrant B |
|---|---|---|---|
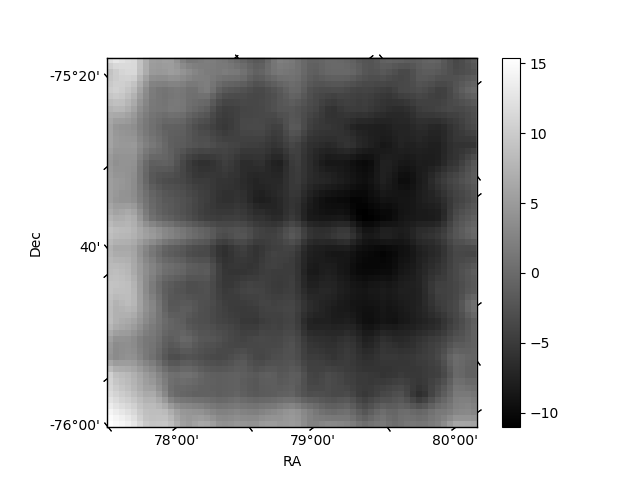
| Quadrant D | 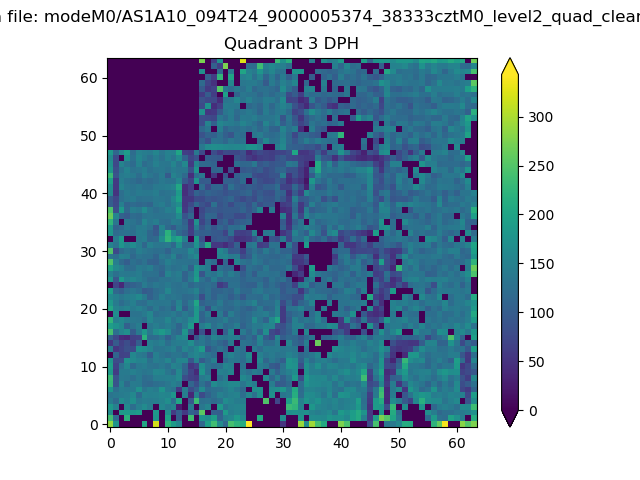 |
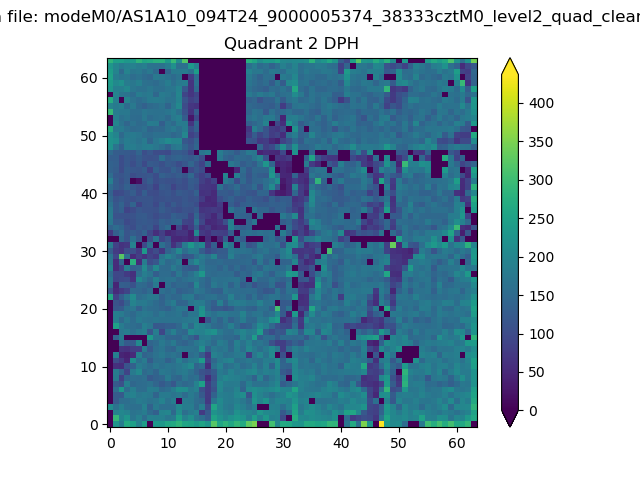 |
Quadrant C |
| Plot type | Count rate plots | Images |
|---|---|---|
| Comparison with Poisson distribution Blue bars denote a histogram of data divided into 1 sec bins. Red curve is a Poisson curve with rate = median count rate of data. |
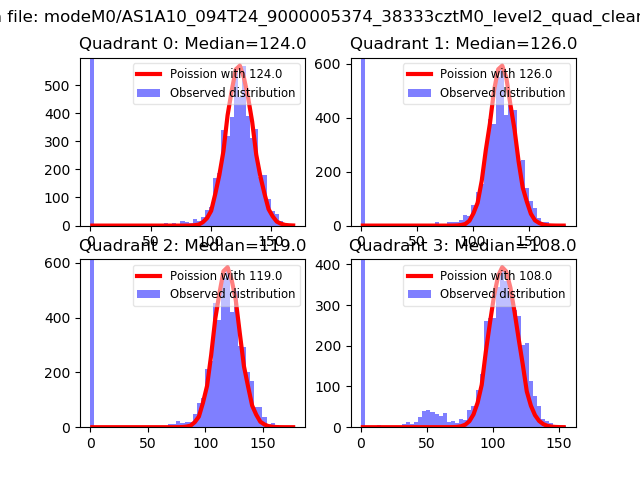 |
 |
| Quadrant-wise count rates Data is divided into 100 sec bins |
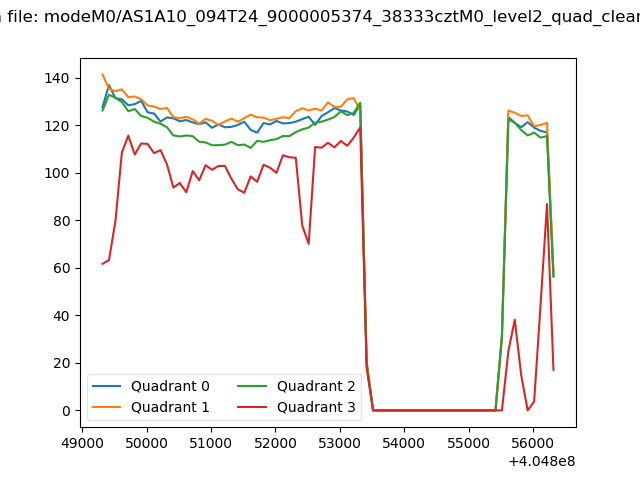 |
|
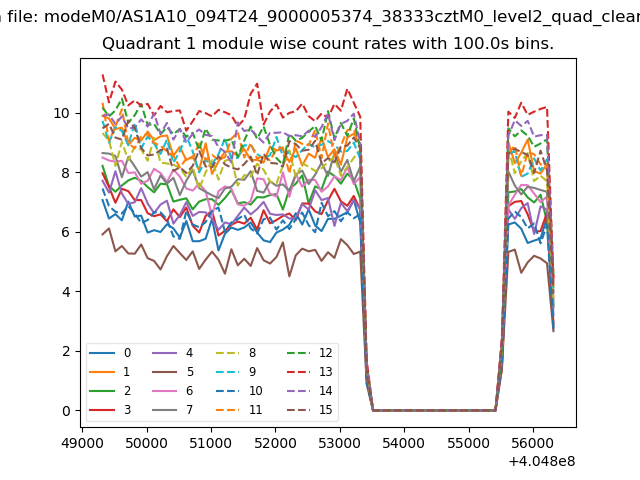
| Module-wise count rates for Quadrant A Data is divided into 100 sec bins |
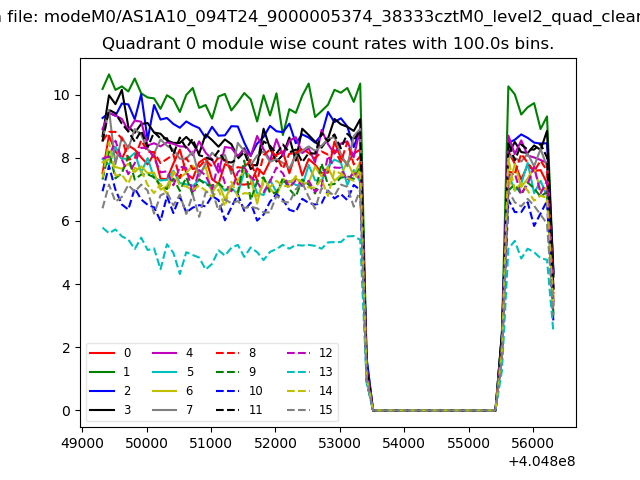 |
 |
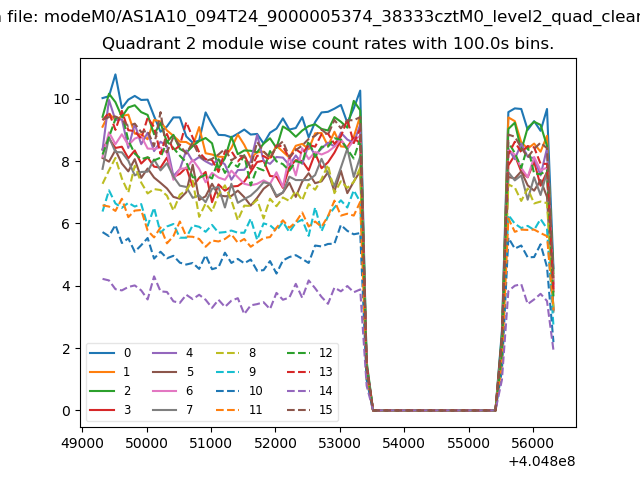
| Module-wise count rates for Quadrant B Data is divided into 100 sec bins |
 |
 |
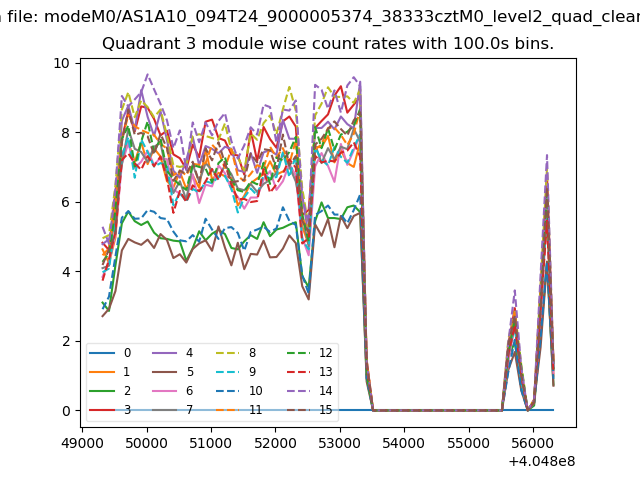
| Module-wise count rates for Quadrant C Data is divided into 100 sec bins |
 |
 |
| Module-wise count rates for Quadrant D Data is divided into 100 sec bins |
 |
 |
| Parameter | Plot |
|---|---|
| CZT HV Monitor | 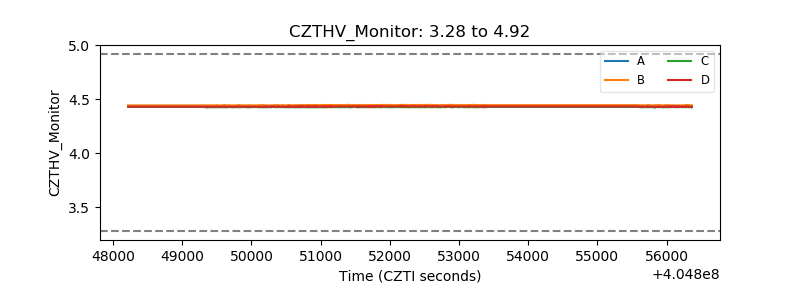 |
| D_VDD | 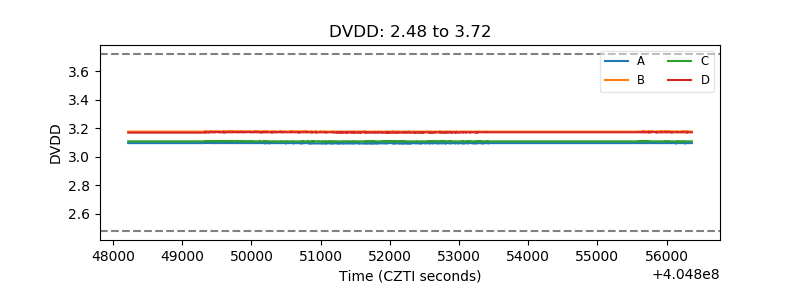 |
| Temperature 1 | 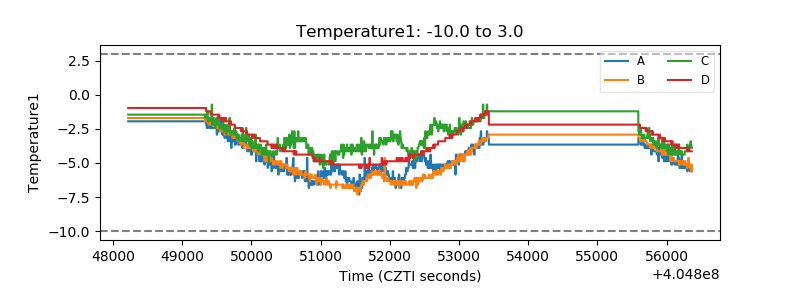 |
| Veto HV Monitor | 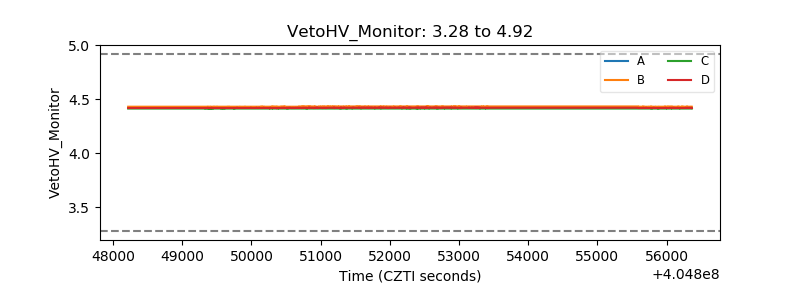 |
| Veto LLD | 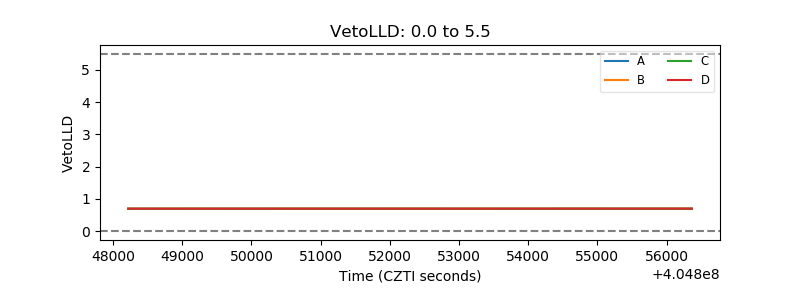 |
| Alpha Counter | 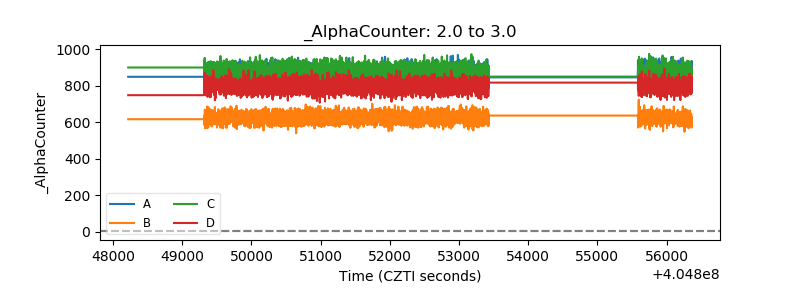 |
| _CPM_Rate | 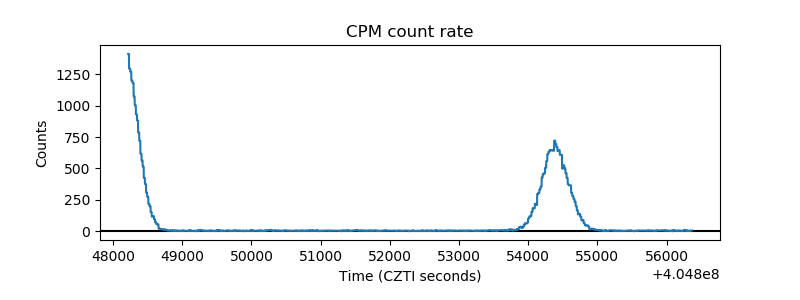 |
| CZT Counter | 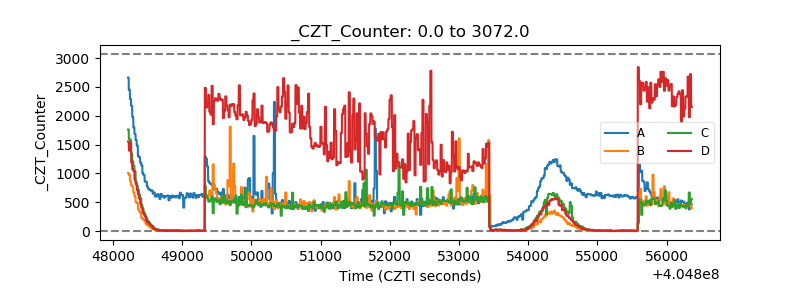 |
| +2.5 Volts monitor | 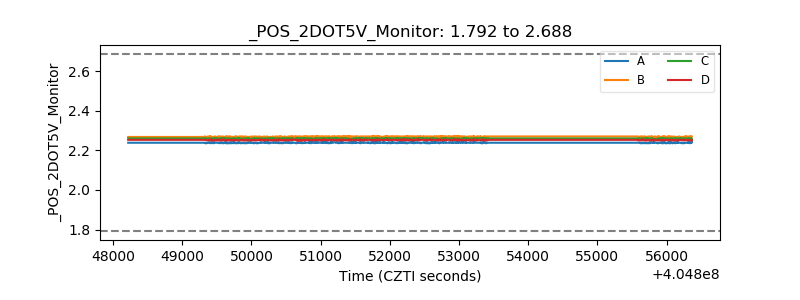 |
| +5 Volts monitor | 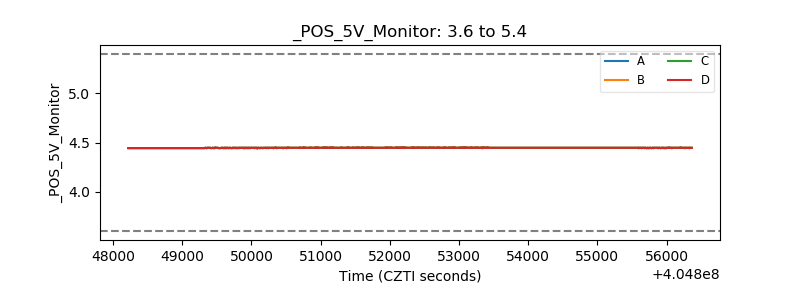 |
| _ROLL_ROT | 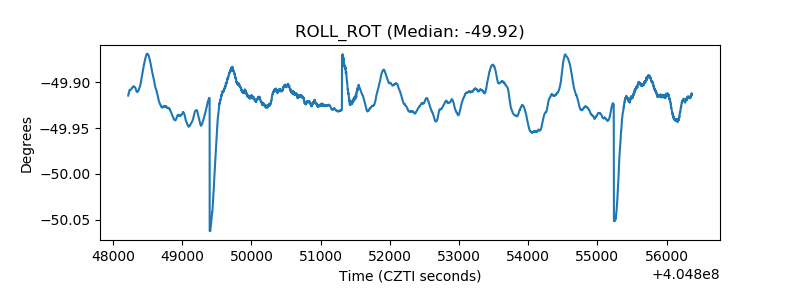 |
| _Roll_DEC | 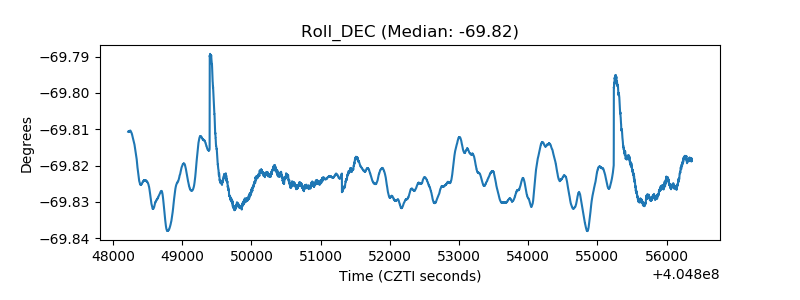 |
| _Roll_RA | 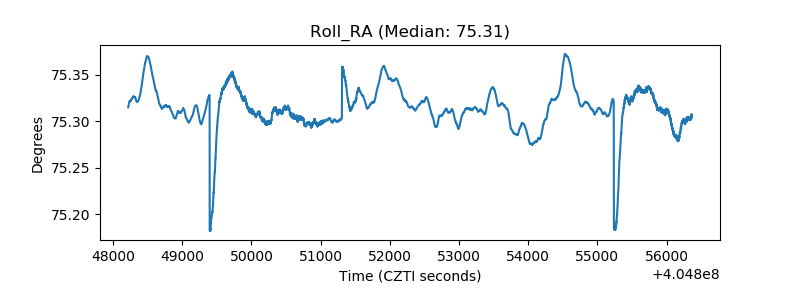 |
| Veto Counter | 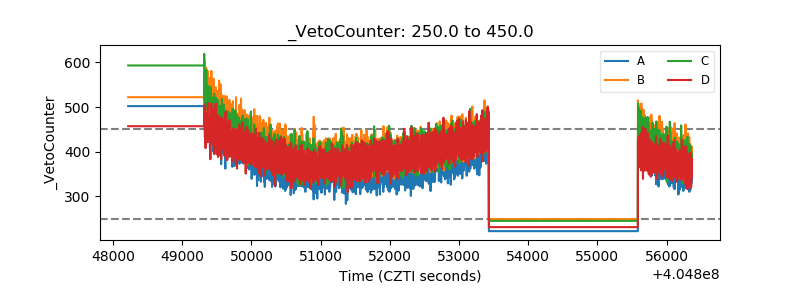 |